http://dx.doi.org/10.4236/ti.2012.31001 Published Online February 2012 (http://www.SciRP.org/journal/ti)
Inequality and Growth Re-Examined
Jacob Assa
New School for Social Research, New York, USA Email: [email protected]
Received November 28, 2011; revised December 28, 2011; accepted January 5,2012
ABSTRACT
This paper examines the relationship between income inequality and subsequent economic growth. It builds on the model suggested by Alesina and Rodrik (1994) in which inequality works through greater demands for redistribution to slow down growth, and the idea by Ray (1998) that inequality negatively affects savings, work capacity, economic in-centives, and access to and efficiency of credit and financial markets. Using an updated dataset and seven model vari-ants, both OLS and 2SLS regressions find a strong negative effect of income inequality on future growth. The effect is considerably stronger for developing countries, but the existence or absence of democracy has no effect on either the relationship between inequality and growth or on the rate of growth itself. There is also no support for Barro’s (2008) claim that inequality impacts growth positively in developed countries.
Keywords: Economic Development; Growth; Income Distribution; Inequality
1. Introduction
Inequality may be objectionable on intrinsic, moral grounds, as well as for functional reasons. The latter are based on the idea that inequality has an instrumental role vis-à-vis other economic processes, such as growth and development. While this is true for countries at any stage of development, Ray (1998) suggests that the consequ- ences “are far more acute for developing countries than for their economically developed counterparts” [1]. Barro (2000) finds that inequality indeed has a negative impact on growth in poor countries, but a positive effect on growth in rich countries [2]. Furthermore, the causality between inequality and growth runs in both directions. For example, Kuznets’s inverted-U hypothesis posits that inequality first rises and then drops as an economy grows. This paper will focus on impacts in the other direction —the effects of initial inequality on subsequent growth.
Recent research confirms the overall negative effects of inequality on growth. Fosu (2009) finds that initial inequality negatively affects the impact of GDP growth on poverty reduction for countries in sub-Saharan Africa [3]. Qin et al. (2009) shows the negative consequences of inequality in China on GDP and sectoral growth [4]. Ca- stelló-Climent (2010) also finds a negative effect of ine-quality (both income and human capital) on economic growth but only for low and middle-income economies [5].
The theoretical motivation for this study follows the analysis in Alesina and Rodrik (1994, AR below). AR explains the effects of greater inequality (of income, edu- cation and land ownership) working through increased
demands for redistribution and higher taxes, resulting in lower growth rates. Other channels mentioned by Ray include the negative effects of inequality on savings, work capacity, economic incentives, and access to and effi- ciency of credit and financial markets [6]. Barro (2000) confirms the role of political economy, credit market im- perfections and saving rates, and adds social unrest to this list [7]. In addition to these direct effects, De Greg- orio and Lee (2004, quoted in Barro 2008) point out in-direct effects of higher inequality: raising fertility, low-ering secondary school enrolment and weakening the rule of law [7].
AR discusses heterogeneity in factor ownership (e.g. land ownership, or income and education as proxies) as the cause of differential individual preferences for redis- tributive policies. Such different preferences would result in a policy compromise (based on the median-voter the- ory), and the accompanying growth rate may not be the maximum growth rate. The authors clearly find that “the more unequal is the distribution of income and wealth, the lower is the rate of growth” [6]. This is because there would be more pressure for (distortionary) redistributive policies in more unequal societies, reducing the long- term growth rate. However, AR finds no effective dif- ference in growth rates between democracies and non-de- mocracies (since even dictatorships are subject to some pressure). This paper will attempt to study the overall relationship between inequality and growth, regardless of channel, using an updated dataset.
set, which is then used to estimate the model in Section 4. Section 5 concludes.
2. The Model
Following AR, this paper will examine the impact of ini- tial income inequality within different countries on their subsequent growth rates. The basic model is:
i 0 i i
Y α Xβ ε (1)
where the dependent variable, Yi, is the compound an-
nual growth rate (CAGR). It is calculated for the period 1998-2008 for each country in the sample. The calcula- tion is based on the geometric mean of per capita GDP (in constant 2005 PPP) for the first and last years:
1 101998
Y Y 1
i Devi
α β ε
i Demiεi 2008
CAGR
The independent variables matrix, Xi, includes GINI
data around 1998 (see Section 3 below), per capita GDP in 1998 (in constant 2005 PPP) and the 1998/99 primary enrolment ratio.
Including a dummy variable for developing countries is useful in examining Ray’s claim that inequality af- fects developing countries more intensely than developed ones:
i 0
Y X i (2)
where Devi takes a value of 0 for developed countries
(high-income economies in the World Bank classifica- tion, see Section 3 below), and 1 for developing countries (all other economies).
Furthermore, following Barro (2008), the model for the longer sample (using 2SLS) will include an intera- ction term between the log of per capita GDP in 1998 and the GINI coefficient, to examine Barro’s finding that inequality has a negative effect for poor countries but a positive one for rich countries [7]. This will be further tested by running separate regressions for developed and developing countries.
An extended model includes a democracy dummy based on the EIU democracy index, in order to check whether the type of regime has an effect on the rela- tionship between inequality and growth (posited by AR to work through pressure for redistribution):
i 0
Y α X β (3)
where Demi is the democracy dummy, taking a value of 1
for full or flawed democracies and 0 for non-democratic regimes (hybrid and authoritarian). In addition, the model will be estimated with both the development and democ- racy dummies.
3. The Data
Given the scarcity of data on land inequality, GINI coef-ficients for income have been used instead (data was
available from the World Bank for 141 countries around the year 1998). Following AR, and “to avoid reverse causation from growth to distribution” [6], the sample is first limited to countries with GINI data around the be-ginning of the period over which growth is measured. However, only 100 of the 141 countries in the full sam-ple have GINI coefficients between 1992 and 1998, pre-ceding the period of growth we seek to explain. For these 100 countries, OLS has been used. In order to include the other countries (with GINI data between 1999 and 2005), Two-Stage Least-Squares estimation is then used to ac-count for the possible endogeneity from growth to ine-quality during the same period. Appendix I provides a list of all 141 countries in the larger sample and their corresponding dates for income GINI coefficients.
The dependent variable is the compound average growth rate of GDP per capita between 1998-2008 (data for 2009 has been excluded to avoid the effects of the financial crisis), and will be regressed on GINI around 1998, GDP per capita in 1998 and primary education enrolment in the school year 1998/99. As suggested in AR, including initial income per capita accounts for the possibility of convergence, while including initial pri-mary enrollment measures human capital levels.
In addition, two dummy variables—for stage of deve- loppment and type of regime—will be used. The World Bank income classification (as of January 2011) used in the analysis is as follows (based on annual per capita income):
1) Low-income economies ($995 or less);
2) Lower-middle-income economies ($996 to $3,945); 3) Upper-middle-income economies ($3,946 to $12,195); 4) High-income economies ($12,196 or more).
For the purpose of the dummy variable Devi, the first
three groups above are considered developing countries (Devi = 1), while the last group—high-income econom-
ics—is considered developed countries (Devi = 0).
Data on democracy has been compiled by the Eco- nomist Intelligence Unit since 2006. The third edition of the EIU’s Democracy Index reflects the situation as of November 2010. As described by the report, “the index provides a snapshot of the state of democracy worldwide for 165 independent states and two territories. [The index] is based on five categories: electoral process and plural- ism; civil liberties; the functioning of government; po- litical participation; and political culture. Countries are placed within one of four types of regimes: full democra- cies; flawed democracies; hybrid regimes; and authori- tarian regimes” [8].
This paper uses EIU’s democracy type and overall score:
Full democracies—score of 8 to 10
Flawed democracies—score of 6 to 7.99
Hybrid regimes—score of 4 to 5.99
For the purpose of the dummy variable Demi, the first
two groups are considered here to be democracies (Demi
= 1), while the last two groups are considered non-demo- cracies (Demi = 0).
4. Estimation
[image:3.595.59.538.452.655.2]The model and its different variants are estimated twice— once with OLS for countries where GINI data was avail- able up to 1998, and once with 2SLS for the whole sam- ple, including those countries with GINI coefficients after 1998. The use of an instrumental variable in the latter case is meant to deal with a potential endogeneity, since growth between 1998 and 2008 may have affected the GINI index measured within that period.
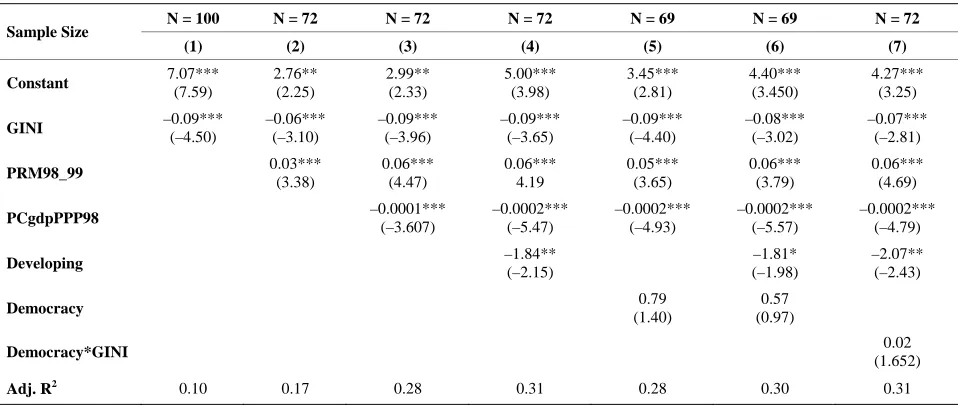
Table 1 presents the results of the OLS regression for the 100 countries that have GINI coefficients for 1998 or slightly before (1992-1998). This restriction is applied to avoid reverse causation from economic growth to ineq- uality. The results confirm AR’s finding that “income ine- quality is negatively correlated with subsequent growth” [6]. The coefficient for the GINI variable is negative and statistically significant at the 1% level in all 7 columns (the t-statistics are also quite high). On average, a one stan-dard-deviation increase in the GINI index results in 6%- 9% lower growth between 1998 and 2008. As more vari-ables are added, the sample sizes decreases (only 72 coun-tries have data on primary education or democracy).
The effect of initial per capita income in 1998 is small but negative and significant. The regressions including this variable also had higher adjusted R2 values, con- firming AR’s point about using initial income per capita to control for convergence. As Barro puts it, “countries grow faster if they start poorer” [7]. Whether a country is developing or not has a large negative coefficient of -1.84 (significant at the 5% level), supporting Ray’s claim that the effect of inequality is much stronger in developing countries. The democracy dummy in Col- umns (5) and (6) is not statistically significant, implying that there is no difference in the rate of growth between democracies and dictatorships. The interactive democ-racy-GINI term in Column (7) is also statistically insig- nificant, supporting AR’s conclusion that there is no dif- ference between democracies and non-democracies in terms of the relationship between inequality and growth.
In order to take advantage of the larger sample, the models were also estimated for all countries in the sam- ple (including those with GINI coefficients up to 2005). To correct for a possible endogeneity bias (with growth affecting inequality), 2SLS regressions were used with primary school enrolment serving as the instrumental variable for GINI. This seemed a reasonable choice of instrument, since an unequal distribution of income is often correlated with unequal access to education, while the latter is not correlated with growth. Furthermore, as
Table 1. Growth regressions for 1998-2008 using GINI coefficients up to 1998 OLS (heteroskedasticity-robust standard er-rors, variant HC1).
N = 100 N = 72 N = 72 N = 72 N = 69 N = 69 N = 72
Sample Size
(1) (2) (3) (4) (5) (6) (7)
Constant 7.07***
(7.59)
2.76** (2.25)
2.99** (2.33)
5.00*** (3.98)
3.45*** (2.81)
4.40*** (3.450)
4.27*** (3.25)
GINI –0.09*** (–4.50) –0.06*** (–3.10) –0.09*** (–3.96) –0.09*** (–3.65) –0.09*** (–4.40) –0.08*** (–3.02) –0.07*** (–2.81)
PRM98_99 0.03*** (3.38) 0.06*** (4.47) 0.06*** 4.19 0.05*** (3.65) 0.06*** (3.79) 0.06*** (4.69)
PCgdpPPP98 –0.0001***
(–3.607)
–0.0002*** (–5.47)
–0.0002*** (–4.93)
–0.0002*** (–5.57)
–0.0002*** (–4.79)
Developing –1.84**
(–2.15)
–1.81* (–1.98)
–2.07** (–2.43)
Democracy 0.79
(1.40)
0.57 (0.97)
Democracy*GINI (1.652) 0.02
Adj. R2 0.10 0.17 0.28 0.31 0.28 0.30 0.31
Sources: World Bank, World Development Indicators (accessed 24 April 2011); Economist Intelligence Unit, Democracy index 2010.
The dependent variable is average per capita growth rate over 1998-2008. t-statistics are in parentheses. ***denotes significance at the 1% level; **denotes significance at the 5% level; *denotes significance at the 10% level.
Independent variables are defined as follows:
GINI: GINI coefficient data point around 1998 (1992-1998).
PRM98_99: Primary school enrolment ratio in academic year 1998/1999. PCgdpPPP98: Per capita GDP in 1998 (in constant 2005 PPP).
Developing: Developing country dummy (1 = developing, 0 = developed).
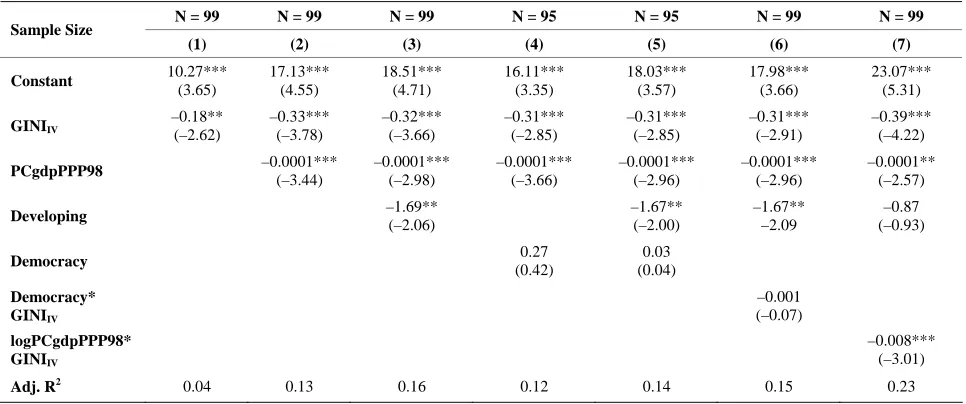
Table 2. Growth regressions for 1998-2008 using GINI coefficients between 1992 and 2005 2SLS (heteroskedasticity-robust standard errors, variant HC1).
N = 99 N = 99 N = 99 N = 95 N = 95 N = 99 N = 99
Sample Size
(1) (2) (3) (4) (5) (6) (7)
Constant 10.27***
(3.65)
17.13*** (4.55)
18.51*** (4.71)
16.11*** (3.35)
18.03*** (3.57)
17.98*** (3.66)
23.07*** (5.31)
GINIIV
–0.18** (–2.62)
–0.33*** (–3.78)
–0.32*** (–3.66)
–0.31*** (–2.85)
–0.31*** (–2.85)
–0.31*** (–2.91)
–0.39*** (–4.22)
PCgdpPPP98 –0.0001***
(–3.44)
–0.0001*** (–2.98)
–0.0001*** (–3.66)
–0.0001*** (–2.96)
–0.0001*** (–2.96)
–0.0001** (–2.57)
Developing –1.69** (–2.06) –1.67** (–2.00) –1.67** –2.09 (–0.93) –0.87
Democracy (0.42) 0.27 (0.04) 0.03
Democracy* GINIIV
–0.001 (–0.07)
logPCgdpPPP98* GINIIV
–0.008*** (–3.01)
Adj. R2 0.04 0.13 0.16 0.12 0.14 0.15 0.23
Sources: World Bank, World Development Indicators (accessed 24 April 2011); Economist Intelligence Unit, Democracy index 2010.
The dependent variable is average per capita growth rate over 1998-2008. t-statistics are in parentheses. ***denotes significance at the 1% level; **denotes significance at the 5% level; *denotes significance at the 10% level.
Independent variables are defined as follows:
GINIIV: GINI coefficient data point (between 1992 and 2005) instrumented by primary school enrolment ratio in 1998-1999 (PRM98_99).
PCgdpPPP98: Per capita GDP in 1998 (in constant 2005 PPP). Developing: Developing country dummy.
Democracy: Democracy dummy.
the primary education data was measured for the 1998/99 academic year in all countries for which it was available, it precedes the growth period studied here and hence cannot affect the dependent variable directly.
Table 2 presents the results for the 2SLS regression, showing the instrumented GINIIV which was regressed
on primary schooling in the first stage. The coefficients on the GINIIV variable are between 2 and 5 times higher
than in the OLS regressions, likely the result of using a larger sample while controlling for endogeneity. They are all statistically significant at the 1% level, and imply an effect of up to 34% lower growth resulting from a one standard-deviation increase in the GINI index. The coef- ficient for initial per capita income is once again small but significant, allowing for convergence. The develop- ing country dummy effect is a bit smaller (–1.69) than in the OLS results, but still negative and significant (at the 5% level). Once again, both the democracy dummy and the interactive democracy-GINI variable are not statistic- cally significant, showing no difference—in terms of ei- ther the growth rate alone or the relationship of inequal- ity of growth-between democracies and non-democracies.
Column (7) interacts the log of per capita GDP in 1998 with the GINIIV coefficient. Similar to Barro, the GINIIV
itself is still strongly negative, but unlike Barro’s results, the coefficient for the interaction term here is also ne- gative and significant (at 1%). This contradicts Barro’s conclusion that “the effect attenuates as per capita GDP
rises” [7].
To further test Barro’s assertion that inequality affects growth negatively in poor countries but positively in rich ones, model (2) was estimated separately for developed countries (Devi = 0) and developing ones (Devi = 1). The
result of the first regression (N = 31) was indeed positive, 1.08, but not statistically significant (t-stat = 1.278), while the second regression (N = 68) had a strongly ne- gative coefficient –0.37, statistically significant at the 1% level (t-stat = –2.902). Thus there is no clear relationship between income inequality and subsequent growth in de- veloped countries, while there is a negative and signi- ficant one in developing countries.
5. Concluding Remarks
statistically significant positive affect on growth. The overall conclusion is that, beyond any moral objections to inequality, there are strong economic reasons to be concerned about it, as it retards growth under any poli- tical regime, at least in developing countries.
REFERENCES
[1] D. Ray, “Development Economics,” Princeton University Press, Princeton, 1998.
[2] R. J. Barro, “Inequality and Growth in a Panel of Coun- tries,” Journal of Economic Growth, Vol. 5, No. 1, 2000, pp. 5-32. doi:10.1023/A:1009850119329
[3] A. K. Fosu, “Inequality and the Impact of Growth on Po- verty: Comparative Evidence for Sub-Saharan Africa,”
Journal of Development Studies, Vol. 45, No. 5, 2009, pp. 726-745.
[4] D. Qin, M. A. Cagas, G. Ducanes, X.-H. He, R. Liu and S.-G. Liu, “Effects of Income Inequality on China’s Eco-nomic Growth,” Journal of Policy Modeling, Vol. 31, No. 1, 2009, pp. 69-86.
doi:10.1016/j.jpolmod.2008.08.003
[5] A. Castelló-Climent, “Inequality and Growth in Ad- vanced Economies: An Empirical Investigation,” Journal
of Economic Inequality, Vol. 8, No. 3, pp. 293-321. doi:10.1007/s10888-010-9133-4
[6] A. Alesina and D. Rodrik, “Distributive Politics and Eco- nomic Growth,” The Quarterly Journal of Economics, Vol. 109, No. 2, 1994, pp. 465-490. doi:10.2307/2118470 [7] R. J. Barro, “Inequality and Growth Revisited,” ADB Work-
ing Paper Series on Regional Economic Integration, No. 11, January 2008.
Appendix 1. List of Countries and Years for GINI Coefficients for Income—Full Sample.
Country Year
Albania 1997 Algeria 1995 Angola 2000 Argentina 1998 Armenia 1996 Australia 1994 Austria 2000 Azerbaijan 1995 Bangladesh 1996 Belarus 1998 Belgium 2000 Belize 1995 Benin 2003 Bhutan 2003 Bolivia 1997 Bosnia and Herzegovina 2001
Botswana 1994 Brazil 1998 Bulgaria 1997 Burkina Faso 1998
Burundi 1998 Cambodia 1994 Cameroon 1996 Canada 2000 Cape Verde 2001
Central African Republic 1993
Chad 2003 Chile 1998 China 2005 Colombia 1998 Comoros 2004 Congo, Rep. 2005
Costa Rica 1998 Cote d'Ivoire 1998
Croatia 1998 Czech Republic 1996
Denmark 1997 Djibouti 1996 Dominican Republic 1997
Ecuador 1998 Egypt, Arab Rep. 1996
El Salvador 1998
Estonia 1998 Ethiopia 1995 Finland 2000 France 1995 Gabon 2005
Country Year
Gambia, The 1998
Georgia 1998 Germany 2000 Ghana 1998 Greece 2000 Guatemala 1998 Guinea 1994 Guinea–Bissau 1993 Guyana 1998 Haiti 2001 Honduras 1997 Hong Kong SAR, China 1996
Hungary 1998 India 2005 Indonesia 2005 Iran, Islamic Rep. 1998
Ireland 2000 Israel 2001 Italy 2000 Jamaica 1996 Japan 1993 Jordan 1997 Kazakhstan 1996 Kenya 1997 Korea, Rep. 1998
Kyrgyz Republic 1998
Lao PDR 1997
Latvia 1998 Lesotho 1995 Lithuania 1998 Luxembourg 2000 Macedonia, FYR 1998
Madagascar 1997 Malawi 1998 Malaysia 1997 Maldives 2004 Mali 1994 Mauritania 1996 Mexico 1998 Micronesia, Fed. Sts. 2000
Moldova 1997 Mongolia 1998 Morocco 1999 Mozambique 1997 Namibia 1993 Nepal 2004 Netherlands 1999
Country Year
New Zealand 1997
Nicaragua 1998 Niger 1994 Nigeria 1996 Norway 2000 Pakistan 1997 Panama 1997 Papua New Guinea 1996
Paraguay 1998 Peru 1996 Philippines 1997 Poland 1998 Portugal 1997 Romania 1998 Russian Federation 1996
Rwanda 2000 Senegal 1995 Sierra Leone 2003
Singapore 1998 Slovak Republic 1996
Slovenia 1998 South Africa 1995
Spain 2000 Sri Lanka 1996
St. Lucia 1995
Suriname 1999 Swaziland 2001 Sweden 2000 Switzerland 2000 Syrian Arab Republic 2004
Tajikistan 1999 Tanzania 2000 Thailand 1998 Trinidad and Tobago 1992
Tunisia 1995 Turkey 1994 Turkmenistan 1998 Uganda 1996 Ukraine 1996 United Kingdom 1999
United States 2000
Uruguay 1998 Uzbekistan 1998 Venezuela, RB 1998
Vietnam 1998 Yemen, Rep. 1998