ISSN Online: 2164-5353 ISSN Print: 2164-5345
Synthesis of Poly(AAm-
co
-AA) and
Investigation of its Swelling Behavior: Using
Response Surface Methodology (RSM)
Samira Heidari
1, Jafar Saberi Doust
2, Feridun Esmaeilzadeh
1*1School of Chemical and Petroleum Engineering, Enhanced Oil and Gas Recovery Institute, Enhanced Gas Condensate Recovery
Research Group, Shiraz University, Shiraz, Iran
2Petro Pars Ghodrat Company, Shiraz, Iran
Abstract
Unwanted water production together with oil and gas production is a striking problem in oil and gas industries, and many approaches have been examined to overcome this major problem. Preformed particle gels (PPGs) showed dramatically good properties for this purpose in mature oil and gas reservoirs. In this study, we carefully synthesized an efficient series of PPGs with using a design of experiments (DOE) software. Acrylamide (AAm)/Acrylic acid (AA) mole ratio, N,N’-methylenebisacrylamide (MBA) mole percentage and swel-ling time were considered as key parameters to examine PPG swelswel-ling beha-vior. Our results presented a detailed empirical correlation, which could sig-nificantly predict the swelling capacity of PPGs in CaCl2 salt solution (200,000 ppm).
Keywords
Response Surface Methodology (RSM), Optimization, Synthesis, Water Conformance
1. Introduction
Today, the remained oil in the most of oil reservoirs is a heavy oil. Because of increasing demand for energy sources, enhanced oil recovery (EOR) from oil reservoirs has been vastly considered in the worldwide. There are several ap-proaches to upgrade the heavy oil from reservoirs such as gas injection, water flooding, thermal, and chemical methods. In many EOR approaches, it is tried to reduce oil viscosity and literally squeeze oil through the pores of the oil matrix.
Producing unwanted water together with oil is a big trouble for the most of
How to cite this paper: Heidari, S., Doust, J.S. and Esmaeilzadeh, F. (2018) Synthesis of Poly(AAm-co-AA) and Investigation of its Swelling Behavior: Using Response Surface Methodology (RSM). Modeling and Nu-merical Simulation of Material Science, 8, 65-78.
https://doi.org/10.4236/mnsms.2018.84004
Received: September 14, 2018 Accepted: October 28, 2018 Published: October 31, 2018
Copyright © 2018 by author(s) and Scientific Research Publishing Inc. This work is licensed under the Creative Commons Attribution-NonCommercial International License (CC BY-NC 4.0).
http://creativecommons.org/licenses/by-nc/4.0/ Open Access
producers in many EOR processes. Because unwanted water production in-creases the corrosion level, environmental worries, burden on fluid-handling fa-cilities and eventually workover costs, it is contrary to the economically oil pro-duction. When the amount of unwanted water production exceeds the economic limitations of water oil ratio (WOR), the production is winded up and the well is closed. Hence, a major objective of many oil producers is to control unwanted water production.
There are different ways to control unwanted water production from oil and gas reservoirs; solutions that are relatively inexpensive to more complex. Gel treatment is one of the successful methods to control unwanted water produc-tion from fractured oil reservoirs [1] [2] [3]. The gel reduces water production by using two mechanisms: changing wettability [4] [5] or/and blocking fractures [6]. Hitherto, gels have been employed in both immature (gelant) [7] [8] [9] and preformed particle gel (PPG) forms [10] [11]. One of the differences between these two forms is that the crosslinking process of gelant occurs at the reservoir conditions while it occurs in the surface facilities for PPGs. The fundamental discrepancy between the gelant and PPG is that PPG is resistant against all kinds of salt solutions with high concentration, temperature and pressure. This differ-ence makes PPG approach to be superior. In addition, PPG is adjustable in size between micrometers and centimeters, is inflatable between 50 - 200 times of original size, and is controllable in the swelling behavior. Therefore, PPGs are more successful than immature gels [12] [13].
Based on the currently available evidences, the most important parameters that affect the PPG performance are its synthesis approach [14] [15] [16], the properties of salt solution and the properties of medium in where PPG is swol-len. Solution and suspension polymerization are two well-known synthesis ap-proaches. Type and mole ratio of monomers [15] [17], type of initiator [18], type of additive [10] [19] and type and mole percentage of the crosslinking agents [14] are the key factors in a synthesis reaction. Concentration, pH, and type of salt solution are the most important properties of salt solutions. The most prominent features of medium that affect the hydrogel swelling behavior are pressure and temperature [10] [14].
Despite all experimental and field investigations carried out on the use of PPG samples to control unwanted water production [10] [11] and on poly(acrylamide- co-acrylic acid) as a good commercial superabsorbent, no one examined the po-lymerization approach to optimize the swelling percentage of poly(acrylamide- co-acrylic acid) in high salinity water (CaCl2 salt water, 200,000 ppm). On the best of our knowledge, there is not any report in the literature that presents an efficient empirical correlation for water conformance based optimized key pa-rameters affecting swelling capacity of poly(acrylamide-co-acrylic acid) in CaCl2 salt water as one of the most effective salts in the formation water. The aim of this work is to develop an optimum empirical correlation to predict the swelling capacity of PPGs, composed of AAm and AA, in CaCl2 salt water (200,000 ppm). To do so, the overall acceptable ranges of AAm/AA mole ratio [19], MBA mole
percentage [19], and swelling time were examined as vital factors affecting the swelling percentage of PPGs in the salt water. Existing such empirical correlation that can optimize the swelling capacity of PPGs in the high salinity water can help producers to know how much PPGs have to be injected into the reservoir for water conformance.
Design of experiments (DOE) software is a benefit tool to elucidate and op-timize the vital parameters affecting the desired experiments with minimum possible tests. There are many design methods in DOE. Response surface me-thodology (RSM), introduced by Box and Wilson [20], is one of the design ap-proaches that examines key variables to optimize the desired responses. RSM has several mathematical and statistical techniques for optimization such as central composite design (CCD). Until now, several researchers used CCD approach to evaluate dominant parameters in synthesis experiments [21] [22] [23], to optim-ize chemical and physical properties of synthesoptim-ized polymers [24] [25] and fi-nally to propose a predictive mathematical model based on the performed syn-thesis experiments [26] [27] [28] [29]. To our purpose, we used CCD approach, Design- V7 software, to design synthesis experiments. Mole ratio of AAm/AA, swelling time, and mole percentage of MBA were evaluated as the vital factors affecting the swelling percentage of PPGs.
In this study, we first synthesized 17 PPG samples by free radical approach based on CCD suggested runs. Then, we swelled PPGs in CaCl2 salt water and examined their swelling behavior. After that, we presented an empirical correla-tion that it can predict the swelling percentage of PPG samples. In the end, we evaluated the accuracy of our proposed correlation.
1B
2. Experiments
7B
2.1. Materials
Acrylamide (AAm, Sigma-Aldrich, >99%) and acrylic acid (AA, Sigma-Aldrich, > 99%) were two monomers used in this study. N,N’-methylenebisacrylamide (MBA, Sigma-Aldrich, >99%) and sodium persulfate (Na2S2O8, Sigma-Aldrich, >98%) were used as a crosslinking agent and an initiator, respectively. Distillated water was used as solvent in the synthesis experiments. CaCl2 (CaCl2, Merck Company, 99%) salt solution with the concentration of 200,000 ppm was used in swelling experiments.
8B
2.2. Central Composite Design (CCD)
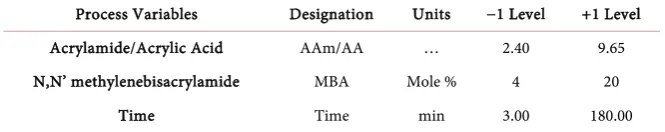
To synthesis PPG samples and study their swelling behaviors, we considered the mole ratio of AAm/AA, mole percentage of MBA and swelling time as the do-minant factors. Table 1 shows the mixing ranges of these key factors. As re-ported in [20], the mole ratio of AAm/AA and the mole percentage of the cros-slinker agent in the copolymerization reaction are better to be in the range of 2 - 10 mole ratio and 4 - 20 mole percentage, respectively. In addition, several au-thors were used these mentioned ratios for AAm/AA and MBA [16] [30].
Table 1. The coded level of affected variables.
Process Variables Designation Units −1 Level +1 Level Acrylamide/Acrylic Acid AAm/AA … 2.40 9.65 N,N’ methylenebisacrylamide MBA Mole % 4 20
Time Time min 3.00 180.00
Therefore, in this work the values of 2.41, 4.82, and 9.65 for AAm/AA mole ratio and the values of 4, 16, 18 and 20 for MBA mole percentage were considered to cover the entire acceptable range of key parameters.
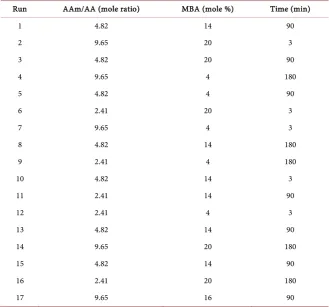
To achieve our aim, synthesizing an efficient set of PPG samples with an op-timum swelling percentage, CCD suggested 17 experiments that three of them were replicated as the central points. Table 2 shows these proposed experiments.
2.3. Synthesis Experiments
To perform the 17 designed experiments, we first prepared crosslinking solu-tions. To do so, a certain amount of MBA, based on the suggested mole percen-tage by CCD, was fully dissolved in 1.0 mL of distillated water in a waterless vo-lumetric flask 5.0 mL (borosilicate glass 3.3). Then, initiator solution was pro-vided by carefully adding 0.1 grams of K2S2O8 to 1.0 mL of distillated water in a dry volumetric flask (5.0 mL, borosilicate glass 3.3). After that, 0.5 grams of AAm was quite solved in 1.0 mL of distillated water in a 10.0 mL falcontube for each experiment. 0.2 mL of the crosslinking solution was then meticulously added to the falcontube by using a microliter pipette (100 - 1000 µL, WATSON NEXTY Japan). In the end, 0.1 mL of the initiator solution (by using the micro-liter pipette) was quickly augmented to the falcontube to begin the synthesis reaction. Immediately after that, the falcontube was completely closed and quickly put in the oil bath that it was heated to exactly 80˚C. The falcontubes were kept in the oil bath just for three hours.
2.4. Swelling Experiments
To investigate the swelling percentage of PPG samples, we first prepared CaCl2 salt solution with the concentration of exactly 200,000 ppm. Then for each syn-thesized PPG sample, we carefully weighed 2.0 grams of PPG and swelled it in 20 mL of the prepared CaCl2 salt solution. In a certain swelling time, which speci-fied by CCD, swollen PPG sample was removed from the salt solution, its extra water was quickly taken with the use of a Whatman filter paper (40:8 µm), and carefully weighed by a digital balance (BP 210 S, German). All the tests were car-ried out at room temperature. The swelling percentage of PPG samples was then calculated by Equation (1).
Swelling percentage t o 100
o
m m m
−
= × (1)
where, mt and mo are the wet and dry weight of PPG samples, respectively.
Table 2. Central composite design.
Run AAm/AA (mole ratio) MBA (mole %) Time (min)
1 4.82 14 90
2 9.65 20 3
3 4.82 20 90
4 9.65 4 180
5 4.82 4 90
6 2.41 20 3
7 9.65 4 3
8 4.82 14 180
9 2.41 4 180
10 4.82 14 3
11 2.41 14 90
12 2.41 4 3
13 4.82 14 90
14 9.65 20 180
15 4.82 14 90
16 2.41 20 180
17 9.65 16 90
3. Results and Discussion
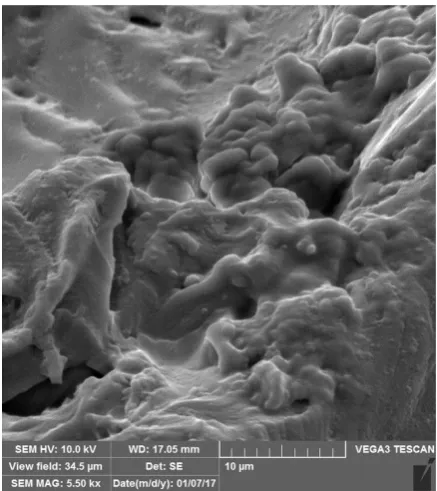
In this study, we synthesized 17 PPG samples as previously described to examine the swelling behavior of hydrogels. To check the desirability of the synthesized PPG structure and its morphology, Fourier transform infrared spectroscopy (FT-IR, Shimadzu FTIR-8300) and scanning electron microscopy (SEM, VEGA3 TESCAN, at 20 kV) were fulfilled. As an example, FT-IR of PPG sample 5 was shown in Figure 1. According to Figure 1, O–H and N–H stretching appeared in the range of 3100 - 3500 cm−1 confirms the formation of poly(AAm-co-AA). The asymmetric and symmetric NH2 stretching vibrations of acrylamide may be verified by two peaks appeared around 3395 and 3165 cm−1. The wide absorption bands from 3500 cm−1 to 2975 cm−1 can be attributed to the –OH bands of car-boxylic groups. CH2 and CH stretching vibrations were revealed by happened picks at 2920 and 1850 cm−1, respectively. C-O stretching vibrations of carbonyl groups of acrylic acid and acrylamide became evident at 1645 and 1705 cm−1. The emerged band at 1120 cm−1 and the observed peak at 1440 cm−1, respective-ly, approved C-C stretching and C-N stretching vibrations.
Figure 2 exemplifies SEM image of PPG sample 5. There are several holes (1 -
9 µm) in the structure of the examined PPG sample, which confirm the forma-tion of a water-absorbing network in the PPG structure.
After reviewing the correctness of the performed synthesis experiments, we investigated the swelling behavior of PPG samples in CaCl2 salt solution. To do
Figure 1. Fourier transform infrared spectroscopy of sample 1.
Figure 2. Scanning electron microscopy (SEM) image of sample 1.
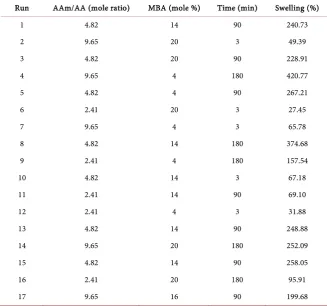
so, the swelling experiments were carried out as previously described; the results were given to the software. CCD used these data to offer a mathematical model, which can predict the swelling percentage of PPG samples. Table 3 presents the results of swelling experiments. According to these results, the swelling percen-tage of PPG samples changes by all the mentioned key factors. Mole ratio of monomers, mole percentage of the crosslinking agent and swelling time are the influencing factors in PPG swelling behavior which are generally in line with the performed synthesis experiments reported by a variety of authors [14] [17] [30]. However, the trend of swelling changes of hydrogels against these dominant factors is not obvious in detail.
Based on the fit summary analysis, CCD suggested a quadratic model for the response. Table 4 shows the details of the analysis of variance (ANOVA) tab.
Table 3. Central composite design matrix.
Run AAm/AA (mole ratio) MBA (mole %) Time (min) Swelling (%)
1 4.82 14 90 240.73
2 9.65 20 3 49.39
3 4.82 20 90 228.91
4 9.65 4 180 420.77
5 4.82 4 90 267.21
6 2.41 20 3 27.45
7 9.65 4 3 65.78
8 4.82 14 180 374.68
9 2.41 4 180 157.54
10 4.82 14 3 67.18
11 2.41 14 90 69.10
12 2.41 4 3 31.88
13 4.82 14 90 248.88
14 9.65 20 180 252.09
15 4.82 14 90 258.05
16 2.41 20 180 95.91
17 9.65 16 90 199.68
Table 4. ANOVA analysis (Partial Sum of Squares) for response surface quadratic model. (Response: swelling %)
Source Sum of Squares df Mean Square F-Value p-value Model 11.8076 5 2.36152 154.4337 <0.0001 A-AAm/AA 1.919111 1 1.919111 125.502 <0.0001 B-MBA 0.262023 1 0.262023 17.1352 0.0016 C-Time 6.48566 1 6.48566 424.1356 <0.0001
A2 1.869314 1 1.869314 122.2455 <0.0001
C2 0.448605 1 0.448605 29.33693 0.0002
Residual 0.168206 11 0.015291
Since the vital properties of the model are in the statistically confident level of 95%, the proposed model is significant; these properties are the P-value less than 0.0001 and the F-value equal to 154.43. On the basis of ANOVA results, A, B, C,
A2 and C2 terms are dominant factors, which have P-value less than 0.0500. To adjust the response surface and the process parameters, CCD suggested a natural log transformation model. The value of R square was almost one (Table 5), which confirms the compatibility between the experimental results and the pre-dicted values. Additionally, the slight difference between R2 and adjusted R2 (less than 0.2) verifies the accuracy of the proposed model. Equation (2) reveals the final coded mathematical model proposed by CCD in terms of coded factors.
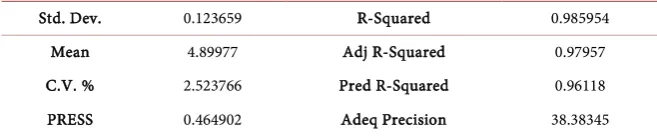
[image:7.595.210.540.440.563.2]Table 5. Different statistical values from ANOVA analysis.
Std. Dev. 0.123659 R-Squared 0.985954 Mean 4.89977 Adj R-Squared 0.97957 C.V. % 2.523766 Pred R-Squared 0.96118 PRESS 0.464902 Adeq Precision 38.38345
(
)
2 2ln Swelling% = +5.78 0.44+ × −A 0.16× +B 0.81× −C 0.9×A −0.39×C (2)
where A, B, and C are the previously defined parameters as key factors.
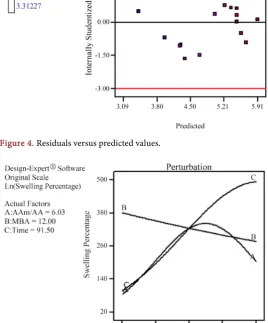
The diagnostic tab showed the validation of the model by the normal (Figure 3) and residual plot (Figure 4). Since the majority of the residuals were on the straight line, the error distribution of the performed experiments was normal. In addition, no unnatural schema or structure unfolded in the residual plot.
Which process parameter can more affect response surface? To find the an-swer, CCD changed one factor over its entire range while other factors were kept constant. The perturbation plot is a useful approach to compare the effect of vi-tal factors on the response surface. It checks the deviation of each parameter from a reference point defined by CCD. The lower parameter deviation, the more effective parameter. Figure 5 shows that AAm/AA mole ratio and MBA mole percentage are more effective parameters than swelling time on the swel-ling percentage.
Figure 6 shows the difference between the actual and predicted values of the
swelling percentage of PPG samples. Because a 45º-line traversed almost all points, there was a good agreement between actual and predicted values. This accordance reflects the accuracy of the proposed mathematical model.
Figure 7 reveals a three-dimensional plot of the swelling percentage against
the AAm/AA mole ratio and MBA mole percentage. It is obvious that the swel-ling percentage curve has a maximum point against AAm/AA mole ratio and has downward trend against MBA mole percentage. Because of decreasing car-boxylate groups existing in the AA structure, repulsive forces among them de-crease and the swelling percentage inde-creases. According to Lee and Yuan [29], there are two reasons for decreasing the swelling capacity by increasing AAm/AA mole ratio: first, increasing the mole ratio of AAm/AA increases the viscosity of the solution, limits the reactant movement and deactivates the growth of chains as soon as they form. Second, the reduction of carboxylate groups in copolymer chains decreases the osmotic pressure of the solution (p.9). For MBA concentra-tion, on the other hand, the density of the brine solution increases by increasing the mole percentage of MBA that it reduces interpolation spaces among copo-lymer chains. This reduction forms a rigid structure, which cannot absorb large amounts of water and properly swell. The reduction of swelling capacity with a slight change in the mole percentage of the crosslinking agent is consistent with the previous findings [30].
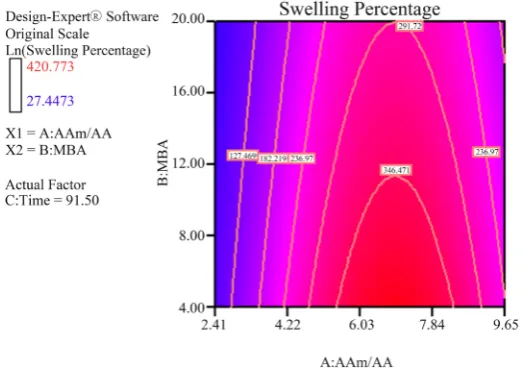
The contour plot shown in Figure 8 confirms that PPG samples have a
Figure 3. Normal probability plot of residuals.
[image:9.595.238.507.353.677.2]Figure 4. Residuals versus predicted values.
Figure 5. Perturbation plot.
Figure 6. Predicted against actual responses.
Figure 7. 3D surface graph of swelling percentage against the mole ratio of AAm/AA and mole percentage of MBA.
Figure 8. Contour plot of swelling percentage against the mole ratio of AAm/AA and mole percentage of MBA.
[image:10.595.242.505.511.695.2]maximum swelling percentage at the low mole percentage of MBA and the av-erage mole ratio of AAm/AA.
To optimize the swelling percentage of PPG samples in CaCl2 salt water, in the numerical optimization tab, we considered the variation range of each key pa-rameter in the same as its previously defined range (Table 1). In addition, the maximum value of the Ln (swelling percentage) was defined as the goal of opti-mization. CCD suggested three solutions to achieve this aim. Table 6 displays these proposed solutions.
To check the accuracy of the proposed optimization solutions, we performed the synthesis experiments based on the suggested values by CCD (Table 6).
Table 7 illustrates that there was a good agreement between the predicted and
obtained results. It means that the proposed solutions are acceptable.
[image:11.595.209.540.441.560.2]Generally, we used CCD method to carry out synthesis experiments. The ac-curacy of the network structure of synthesized hydrogels was confirmed by FT-IR and SEM results. Swelling experiments revealed that the average amount of AAm/AA mole ratio, low amount of MBA mole percentage and high amount of swelling time could create optimal conditions to have a maximum swelling capacity. In the end, CCD proposed an empirical correlation, which could well predict the swelling behavior of PPG samples. Confirmatory experiments indi-cated that there were good agreements between actual and predicted results. Al-though there were some errors in suggested solutions for optimizing swelling conditions, they were negligible.
Table 6. Optimal conditions suggested by CCD.
Solutions AAm/AA (mole ratio) MBA (mole %) Time (min) Desirability
1 6.94 4 180 1
2 6.94 4.5 180 1
3 6.94 5 180 1
4 6.5 4 180 1
5 7.3 4 180 1
[image:11.595.194.540.592.738.2]6 7 4 180 1
Table 7. Obtained swelling percentage.
Run (mole ratio) MBA (mole %) Time (min) AAm/AA swelling (S %) Predicted swelling (S %) Obtained
1 6.94 4 180 609.98 607.54
2 6.94 4.5 180 603.92 600.76
3 6.94 5 180 597.92 598.32
4 6.5 4 180 603.10 601.65
5 7.3 4 180 603.61 601.98
6 7 4 180 609.67 606.96
4. Conclusion
The present study awards a significant empirical correlation to predict swelling behaviors of PPGs in CaCl2 salt solution. The accuracy of the presented correla-tion was verified by several synthesis experiments. Although the synthesis me-chanism of hydrogels remains to be determined, the suggested correlation can be used as a diagnostic test for many of polymer researchers. Since PPG treatment is one of the best cost-effective approaches for oil and gas producers to control unwanted water production, our study provides the framework for future studies to assess PPG performance in CaCl2 salt solution.
Acknowledgements
The authors are grateful to the Shiraz University and Enhanced Gas Condensate Recovery Research Group for supporting this research.
Conflicts of Interest
The authors declare no conflicts of interest regarding the publication of this pa-per.
References
[1] Portwood, J. (2005) The Kansas Arbuckle Formation: Performance Evaluation and Lessons Learned from More than 200 Polymer-Gel Water-Shutoff Treatments. SPE Production Operations Symposium, Oklahoma City, 16-19 April 2005.
https://doi.org/10.2118/94096-MS
[2] Sydansk, R. and Southwell, G. (2000) More than 12 Years of Experience with a Suc-cessful Conformance-Control Polymer Gel Technology. SPE/AAPG Western Re-gional Meeting, Long Beach, 19-22 June 2000, 270-278.
https://doi.org/10.2118/62561-MS
[3] Bai, B., Wei, M. and Liu, Y. (2013) Field and Lab Experience with a Successful Pre-formed Particle gel Conformance Control Technology. SPE Production and Opera-tions Symposium, Oklahoma City, 23-26 March 2013.
https://doi.org/10.2118/164511-MS
[4] Standnes, D.C. and Austad, T. (2000) Wettability Alteration in Chalk: 2. Mechanism for Wettability Alteration from Oil-Wet to Water-Wet Using Surfactants. Journal of Petroleum Science and Engineering, 3, 123-143.
https://doi.org/10.1016/S0920-4105(00)00084-X
[5] Zhang, P. (2006) Water-Based EOR in Fractured Chalk; Wettability and Chemical Additives. Ph.D. Dissertation, Stavanger. ID: 935510.
[6] Stavland, A., Jonsbraten, H.C., Vikane, O., Skrettingland, K. and Fischer, H. (2011) In-Depth Water Diversion Using Sodium Silicate on Snorre-Factors Controlling In-Depth Placement. SPE European Formation Damage Conference, Noordwijk, 7-10 June 2011. https://doi.org/10.2118/143836-MS
[7] Willhite, G.P. and Pancake, R.E. (2008) Controlling Water Production Using Gelled Polymer Systems. SPE Reservoir Evaluation & Engineering, 3, 454-465.
https://doi.org/10.2118/89464-PA
[8] l-Muntasheri, G.A., Sierra, L., Garzon, F.O., Lynn, J.D. and Izquierdo, G.A. (2010) Water Shut-Off with Polymer Gels in a High Temperature Horizontal Gas Well: A
Success Story. SPE Improved Oil Recovery Symposium, Tulsa, Oklahoma, 24-28 April 2010.
[9] Spildo, K., Skauge, A., Aarra, M.G. and Tweheyo, M.T. (2009) A New Polymer Ap-plication for North Sea Reservoirs. SPE Reservoir Evaluation & Engineering, 3, 427-432. https://doi.org/10.2118/113460-PA
[10] Liu, Y., Zhu, M., Liu, X., Zhang, W., Sun, B., Chen, Y. and Adler, H.-J. P. (2006) High Clay Content Nanocomposite Hydrogels with Surprising Mechanical Strength and Interesting Deswelling Kinetics. Polymer, 1, 1-5.
https://doi.org/10.1016/j.polymer.2005.11.030
[11] Bai, B., Huang, F., Liu, Y., Seright, R.S. and Wang, Y. (2008) Case Study on Pre-fromed Particle Gel for In-Depth Fluid Diversion. SPE Symposium on Improved Oil Recovery, Tulsa, Oklahoma, 20-23 April 2008.
https://doi.org/10.2118/113997-MS
[12] Bai, B. and Zhang, H. (2011) Preformed-Particle-Gel Transport through Open Fractures and Its Effect on Water Flow. SPE Journal, 16, 388-400.
https://doi.org/10.2118/129908-PA
[13] Tongwa, P., Nygaard, R., Blue, A. and Bai, B. (2013) Evaluation of Potential Frac-ture-Sealing Materials for Remediating CO2 Leakage Pathways during CO2
Seques-tration. International Journal of Greenhouse Gas Control, 18, 128-138.
https://doi.org/10.1016/j.ijggc.2013.06.017
[14] Malana, M. A., Bukhari, J.-u.-D. and Zohra, R. (2014) Synthesis, Swelling Behavior, and Network Parameters of Novel Chemically Crosslinked Poly(acrylamide- co-methacrylate-co-acrylic acid) Hydrogels. Designed Monomers and Polymers, 17, 266-274. https://doi.org/10.1080/15685551.2013.840501
[15] Othman, M.B.H., Akil, H.M., Osman, H., Khan, A. and Ahmad, Z. (2015) Synthesis, Characterisation and Thermal Properties of Hyperbranched Polyimide Derived from Melamine via Emulsion Polymerisation. Journal of Thermal Analysis and Ca-lorimetry, 120, 1785-1798. https://doi.org/10.1007/s10973-015-4464-9
[16] Craciun, G., Manaila, E. and Stelescu, M.D. (2016) Electron Beam Synthesis and Characterization of Acrylamide/Acrylic Acid Hydrogels Using Trimethylolpropane Trimethacrylate as Cross-Linker. Journal of Chemistry, 2016, Article ID: 1470965. [17] RPacheco, R.J., Silva, M., Sousa, R. and Freitas, R. (2014) Swelling Behavior of
Po-lyacrylamide Hydrogels near Phase Transition. Materials Sciences and Applications, 5, 610-616. https://doi.org/10.4236/msa.2014.58063
[18] Kabiri, K., Omidian, H., Hashemi, S. and Zohuriaan-Mehr, M. (2003) Concise Syn-thesis of Fast-Swelling Superabsorbent Hydrogels: Effect of Initiator Concentration on Porosity and Absorption Rate. Journal of Polymer Materials, 1, 17-22.
[19] Tongwa, P. and Baojun, B. (2015) A More Superior Preformed Particle Gel with Potential Application for Conformance Control in Mature Oilfields. Journal of Pe-troleum Exploration and Production Technology, 2, 201-210.
https://doi.org/10.1007/s13202-014-0136-8
[20] Zheng, Y., Zhao, S., Zeng, A. and Guo, Y. (2012) The Application of Response Sur-face Methodology on the Synthesis of Grafted Polypropylene through the Solvo-thermal Route. Advances in Polymer Technology, 2, 109-117.
https://doi.org/10.1002/adv.20242
[21] Zhao, Y., Fang, L. and Tan, T. (2006) Optimization of the Preparation of a Poly (Aspartic Acid) Superabsorbent Resin with Response Surface Methodology. Journal of Applied Polymer Science, 3, 2616-2622.https://doi.org/10.1002/app.23991
[22] Hong, F.L., Peng, J. and Lui, W.B. (2011) Optimization of the Process Variables for the Synthesis of Starch-Based Biodegradable Resin Using Response Surface Metho-dology. Journal of Applied Polymer Science, 3, 1797-1804.
https://doi.org/10.1002/app.32883
[23] Zare, Y., Garmabi, H. and Sharif, F. (2011) Optimization of Mechanical Properties of PP/Nanoclay/CaCO3 Ternary Nanocomposite Using Response Surface
Metho-dology. Journal of Applied Polymer Science, 5, 3188-3200. https://doi.org/10.1002/app.34378
[24] Cheng, W.Y., Peng, J. and Lui, W.B. (2011) Effects of α-Amylase and Glycerol Le-vels on the Composition Optimization of Poly (β-hydroxybutyrate co-valerate)/Starch Blended Biodegradable Resin Analyzed with Response Surface Methodology. Journal of Applied Polymer Science, 5, 2571-2578.
https://doi.org/10.1002/app.33326
[25] Biswas, S. and Mulaba-Bafubiandi, A.F. (2016) Optimization of Process Variables for the Biosynthesis of Silver Nanoparticles by Aspergillus wentii Using Statistical Experimental Design. Advances in Natural Sciences: Nanoscience and Nanotech-nology, 4, 1-10.
[26] Bitaraf, M., Amoozadeh, A. and Otokesh, S. (2016) A Simple and Efficient One-Pot Synthesis of 1, 4-Dihydropyridines Using Nano-WO3-Supported Sulfonic Acid as an Heterogeneous Catalyst under Solvent-Free Conditions. Journal of the Chinese Chemical Society, 4, 336-344.https://doi.org/10.1002/jccs.201500453
[27] Ripoll, L. and Clement, Y. (2016) Polyamide Microparticles Containing Vitamin C by Interfacial Polymerization: An Approach by Design of Experimentation. Cos-metics, 4, 38.https://doi.org/10.3390/cosmetics3040038
[28] Raghupathy, R. and Amirthagadeswaran, K. (2014) Optimization of Casting Process Based on Box Behnken Design and Response Surface Methodology. International Journal for Quality Research, 4, 569-582.
[29] Işık, B. (2004) Swelling Behavior and Determination of Diffusion Characteristics of Acrylamide-Acrylic Acid Hydrogels. Journal of Applied Polymer Science, 2, 1289-1293.https://doi.org/10.1002/app.13270
[30] Lee, W.F. and Yuan, W.Y. (2000) Thermoreversible Hydrogels X: Synthesis and Swelling Behavior of the (N-isopropylacrylamide-co-sodium 2-acrylamido-2- methylpropyl sulfonate) Copolymeric Hydrogels. Journal of Applied Polymer Science, 8, 1760-1768.
https://doi.org/10.1002/1097-4628(20000822)77:8<1760::AID-APP13>3.0.CO;2-J