RESEARCH ARTICLE
EXPERIMENTAL ANALYSIS OF THERMAL CONTACT RESISTANCE ACROSS DIFFERENT
COMPOSITE MATERIAL PAIR USING DIFFERENT INTERFACE MATERIAL IN
PRESENCE OF PRESSURE CONDITION
*,1Bipin G. Vyas and
2Nirmal Parmar
1
PG Student, Government Engineering College, Valsad, Gujarat, India
2PhD Fellow, Czech Technical University, Prague, Czech Republic
ARTICLE INFO ABSTRACT
The Practical study of heat transfer through surface contact resistance is very essential for advancement of thermal applications. It is required to understand the heat transfer between composite pair having same as well as different interface material. The outcomes will very essential for design of different heat transfer thermal applications. The sole objective of the dissertation work is to reduce the Thermal Contact Resistance (TCR) and increases thermal efficiency of the application. To minimize thermal contact resistance, the study of heat transfer with composite material pair & Thermal Interface Material (TIM) and varying pressure conditions has been carried out experimentally. The Experimental work includes effective possible pairs of circular plates of aluminum (HE30/6082) and copper (EC101) alloys. To avoid radial losses during experiments plates are designed and manufactured in circular disc form 184 mm diameter with 5mm thickness each. Each of plate having four groove, Pencil k type thermocouple (Tip length: 70mm & diameter: 3mm) placed inside that grove which measured average temperature between top surface of cu plate and bottom plate of aluminum plate with the help of 8 channel temperature indicator. The various effective pair of metal alloys disc has been considered during practical where air and brass foil are used as TIM for particulate pair. In advancement of minimization of TCR, experiments with various pressure range also has been conducted for possible different pairs of metal disc with TIM. The effect of pressure in weight ranges from 100 gm to 1800gm was investigated in different temperature condition up to 70oC.
When all temperatures attain the steady condition at 40oC -70oC interval, at that time measured the average temperature of it. An experiment has been conducted with some specific conditions to achieve ideal results. With experiment, it is possible to analyze and identify suitable thermal interface material with minimum thermal contact resistance between two plates. Selection of proper TIM will lead towards higher heat transfer rate.
Copyright © 2016, Bipin G. Vyas and Nirmal Parmar. This is an open access article distributed under the Creative Commons Attribution License, which permits
unrestricted use, distribution, and reproduction in any medium, provided the original work is properly cited.
1. INTRODUCTION
Heat transfer across a contact interface formed by any two solid bodies is usually accompanied by a measurable temperature difference because there exists a thermal resistance to heat flow in the region of the interface. The temperature difference at the contact interface is obtained by extrapolating the steady state unidirectional temperature distribution from regions far from the contact plane. When two surfaces come into contact as shown in Figure 1.1, they remain separated by their roughness elements. A gas or a liquid may also fill the spaces between the surfaces, and if the interface fluid has a lower thermal conductivity than the surface materials a contact resistance may exist that can become a design consideration. Figure 1.1 also illustrates the type of
*Corresponding author: Bipin G. Vyas,
PG Student, Government Engineering College, Valsad, Gujarat, India.
[image:1.595.373.496.615.756.2]temperature distribution that is encountered in such situations where a sharp temperature gradient across the small interfacial separation distance is caused by the contact resistance.
Figure 1.1 Interfacial contact
ISSN: 0975-833X
International Journal of Current Research Vol. 8, Issue, 09, pp.39322-39328, September, 2016
OF CURRENT RESEARCH
Article History:
Received 07thJune, 2016
Received in revised form 23rdJuly, 2016
Accepted 17thAugust, 2016
Published online 30thSeptember, 2016
Key words:
Heat transfer, Thermal applications, Thermal contact resistance, Thermal interfacial material, Pressure, Temperature,
Circular plate and radial heat losses.
Citation: Bipin G. Vyas and Nirmal Parmar, 2016.“Experimental analysis of thermal contact resistance across different composite material pair using
different interface material in presence of pressure condition”,International Journal of Current Research, 8, (09), 39322-39328.
RESEARCH ARTICLE
EXPERIMENTAL ANALYSIS OF THERMAL CONTACT RESISTANCE ACROSS DIFFERENT
COMPOSITE MATERIAL PAIR USING DIFFERENT INTERFACE MATERIAL IN
PRESENCE OF PRESSURE CONDITION
*,1Bipin G. Vyas and
2Nirmal Parmar
1
PG Student, Government Engineering College, Valsad, Gujarat, India
2PhD Fellow, Czech Technical University, Prague, Czech Republic
ARTICLE INFO ABSTRACT
The Practical study of heat transfer through surface contact resistance is very essential for advancement of thermal applications. It is required to understand the heat transfer between composite pair having same as well as different interface material. The outcomes will very essential for design of different heat transfer thermal applications. The sole objective of the dissertation work is to reduce the Thermal Contact Resistance (TCR) and increases thermal efficiency of the application. To minimize thermal contact resistance, the study of heat transfer with composite material pair & Thermal Interface Material (TIM) and varying pressure conditions has been carried out experimentally. The Experimental work includes effective possible pairs of circular plates of aluminum (HE30/6082) and copper (EC101) alloys. To avoid radial losses during experiments plates are designed and manufactured in circular disc form 184 mm diameter with 5mm thickness each. Each of plate having four groove, Pencil k type thermocouple (Tip length: 70mm & diameter: 3mm) placed inside that grove which measured average temperature between top surface of cu plate and bottom plate of aluminum plate with the help of 8 channel temperature indicator. The various effective pair of metal alloys disc has been considered during practical where air and brass foil are used as TIM for particulate pair. In advancement of minimization of TCR, experiments with various pressure range also has been conducted for possible different pairs of metal disc with TIM. The effect of pressure in weight ranges from 100 gm to 1800gm was investigated in different temperature condition up to 70oC.
When all temperatures attain the steady condition at 40oC -70oC interval, at that time measured the average temperature of it. An experiment has been conducted with some specific conditions to achieve ideal results. With experiment, it is possible to analyze and identify suitable thermal interface material with minimum thermal contact resistance between two plates. Selection of proper TIM will lead towards higher heat transfer rate.
Copyright © 2016, Bipin G. Vyas and Nirmal Parmar. This is an open access article distributed under the Creative Commons Attribution License, which permits
unrestricted use, distribution, and reproduction in any medium, provided the original work is properly cited.
1. INTRODUCTION
Heat transfer across a contact interface formed by any two solid bodies is usually accompanied by a measurable temperature difference because there exists a thermal resistance to heat flow in the region of the interface. The temperature difference at the contact interface is obtained by extrapolating the steady state unidirectional temperature distribution from regions far from the contact plane. When two surfaces come into contact as shown in Figure 1.1, they remain separated by their roughness elements. A gas or a liquid may also fill the spaces between the surfaces, and if the interface fluid has a lower thermal conductivity than the surface materials a contact resistance may exist that can become a design consideration. Figure 1.1 also illustrates the type of
*Corresponding author: Bipin G. Vyas,
PG Student, Government Engineering College, Valsad, Gujarat, India.
temperature distribution that is encountered in such situations where a sharp temperature gradient across the small interfacial separation distance is caused by the contact resistance.
Figure 1.1 Interfacial contact
ISSN: 0975-833X
International Journal of Current Research Vol. 8, Issue, 09, pp.39322-39328, September, 2016
OF CURRENT RESEARCH
Article History:
Received 07thJune, 2016
Received in revised form 23rdJuly, 2016
Accepted 17thAugust, 2016
Published online 30thSeptember, 2016
Key words:
Heat transfer, Thermal applications, Thermal contact resistance, Thermal interfacial material, Pressure, Temperature,
Circular plate and radial heat losses.
Citation: Bipin G. Vyas and Nirmal Parmar, 2016.“Experimental analysis of thermal contact resistance across different composite material pair using
Thermal resistance is thermal property of a material and it indicates how it resists heat at a specific thickness. As shown below, thermal resistance is proportional to the thickness of the material, but it can be affected by gaps that occur between contact surfaces. These gap create contact resistance, contributing to additional thermal resistance.
A) Methods to Reduce Contact Resistance (Bipin G. Vyas et al., 2015)
For solid of high thermal conductivity, the contact resistance may be reduced by the following two methods:
1) Increasing the area of contact spots, accomplished by -Increasing contact pressure which will“flatten” the peaks and
valley of the micro roughness
-Reducing the roughness & waviness and increasing the flatness of surface
2) Using the Thermal interface material (TIM) of high thermal conductivity. Any interfacial material that fill the gap between contacting two surfaces, whose thermal conductivity exceed that of air
B) Various Types of Interface Material (Bipin G. Vyas et al., 2015)
1)No fluidic interfacial material
-Metallic Foils i.e., brass, copper, tin, lead, gold, indium etc. -Metallic and Nonmetallic Coatings
-Polymers i.e. thermosets, thermoplastic, elastomers etc. -Cements, Adhesives
2)Fluidic interfacial material
- Phase change material, silicon (Thermal grease)
3)Gases i.e. hydrogen, nitrogen, Helium, carbon dioxide, argon, mixture of helium + argon etc.
4)Vegetable oil
C) Ideal Thermal Interface Material (TIM) Characteristics (Bipin G. Vyas et al., 2015)
1) Minimum thickness is required.
2) It should have high thermal conductivity 3) It should be Non-toxic
4) It would not leak out of the interface zone
5) Easily deformed by small contact pressure so that uneven areas of both contacting surface become a flat 6) Manufacturing friendly means easy to apply and
remove
7) It would maintain performance indefinitely
2. Review of publications
A comprehensive literature review of thermal contact resistance has been provided in references (Yovanovich, 1971; Madhusudana, 1974; O'Callaghan and Probert, 1988; Lee et al., 1993; Koichi Nishino et al., 1995; Marcia B.H. Mantelli et al., 1992; Seri Lee et al., 1995; Khounsary et al., 1997; Wolff and Schneider, 1998; Syed M.S.Wahid and Madhusudana, 2000; Chung, 2001; Satre and Lallemand, 2001; Gwinn and Webb,
2002; Yeh et al., 2003; Avija et al., 2003; Rosochowska et al., 2004; Sunil Kumar and Ramamurthi, 2004; Rao et al., 2004; Vishal Singhal et al., 2005; Ruiping Xu and Lie Xu, 2005; Majid Bahrami et al., 2005; Voller and Tirovic, 2005; Fieberg and Kneer, 2007; Prashant Misra and Nagaraju, 2010; Wang Zongren et al., 2013; Donghuan Liu et al., 2014; Larry Pryor
et al.,). Thermal contact resistance is very essential for design
of heat transfer industrial applications. Various parameter influences on thermal contact resistance i.e. thermal interface material, surface morphology, pressure, metal thermal conductivities, material hardness etc. Surface morphology such as flatness, roughness and waviness have a maximum impact on the thermal contact resistance. It decrease with increasing flatness and decrease with waviness & roughness. Many investigator worked associated with two solid surfaces pressed together under ambient as well as applied load. Madhusudana (1974) found out the effect of various interstitial fluid on thermal contact resistance. He concluded contact resistance improves in presence of good conducting medium in between
two surfaces. O’Callaghan et al. (1988) developed computer
based mathematical model for interface material which will minimize the thermal contact resistance. Khounsary et al. (1997) measured the thermal contact resistance across silicon-copper interface by using various interface foil and also concluded softer the interface material, lower the thermal contact resistance. Chung (2001) reviewed material for thermal conduction include materials exhibiting high thermal conductivity as well as thermal interface materials and Carried out materials of high thermal conductivity are needed for the conduction of heat for the purpose of Heating or cooling.
Gwinn et al. (2002) carried out performance and testing of interface material and surface characteristic & interface material most critical parameter affecting on thermal contact resistance. The objective of this study was to experimental analysis of thermal contact resistance across different composite (Al-Al, Al-Cu) material pair using different interface material (Air, Brass foil) in presence of pressure condition. Experimental variables including ambient condition, position of top and bottom plate, temperature interval, interfacing material etc. Finally, experimentally investigated the composite metallic pair most suitable to minimize thermal contact resistance.
3. METHOD OF APPROACH
3.1 Apparatus
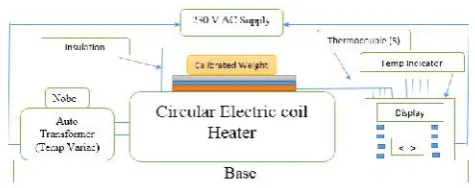
Experimentations has been conducted to find out the thermal contact resistance for same and different form of composite & thermal interface materials. The experimental setup is illustrated in Figure 2.1 and 2.2. Experimental setup consists of various components i.e. circular type electric heater (diameter: 200 mm, Height: 110 mm from the datum), pair of test specimen Copper (Grade: EC101), Al (grade: HE30/6082) (diameter: 184 mm & thickness: 0.5mm), 8 channel Temperature indicator (Model: MS1208,4 digit-LED, 0.56’’,3
digit-LED, 0.4’’), Continuous variable autotransformer
Figure 3.1 Schematic line diagram of experimental setup
Figure 3.2. Schematic actual diagram of experimental setup
3.2 Experimental Test Procedure
A circular form of Copper (EC 101) and Aluminum (HE30/6082) plate of size (diameter: 184 mm & thickness: 0.5mm) are taken for experimentation. A circular form of copper plate is placed on heat source of circular type electric heater (diameter: 200 mm, Height: 110 mm from the datum) having ceramic alloys material (insulation) which prevents the losses. In which, Cu (Bottom) - Al (Top) composite pair with interface material is placed on electric coil heater. Each of
plates has four grooves, ‘k’ types thermocouple are placed
inside that grove which measures the temperature difference (T1i-T2i) between top surface of copper plate and bottom surface of aluminum plate with the help of 8 channel temperature indicator. In Presence of pressure conditions, Calibrated weight (100-2000 kg) is placed on center of top plate at starting position so that pressure is uniformly distributed. One more thermocouple is also placed at bottom surface of Copper plate its temperature (T1) remains constant 40oC–70oC means constant heat flow is maintained by varying voltage of continuous variable autotransformer which is directly connected with electric coil heater. Also, one thermocouple is mounted on top surface (T2) of Al top plate. Both of these temperatures (T1 & T2) are also measured with the help of temperature indicator. The average temperature of plate surface is measured under the steady state condition at 40oC-70oC temperature interval. An experiment has been conducted with some specific conditions i.e. steady state conditions, one dimensional heat transfer, assuming constant Environment Temperature, avoiding convection losses, avoiding Radiation losses, minor Experimental errors avoided, proper Insulation, surfaces are clean and contact is static, thermal conductivities are uniform etc. to achieve ideal results. Same experiments are performed orientation wise in which changes the position of top & bottom plate with different interface material in ambient pressure condition. Same experiments test procedure was repeated for Al-Al composite
pair with different interfacial material in presence of pressure condition.
4. RESULTS AND DISCUSSION
[image:3.595.311.558.529.686.2]Based on experimental work on TCR, Five experiments were performed with same and different composite material pair using different interface material in presence of pressure conditions as well as same experiments were performed orientation wise. In advancement of minimization of TCR, experiments with various pressure range also have been conducted for possible different pairs of metal disc with TIM. The effect of pressure for weight ranges 100gm -1800gm was investigated. In whole experiment, T1 was kept at constant temperature 60oC because at this temperature, significance results were obtained for previous experiments (Reference given). During these all experiments, makes some suitable assumptions are as discussed in previous ones.
Figure 4.1. Composite metallic pair
Where;
Q = Total Heat Flow (W),
T1 = bottom surface temperature of bottom plate (oC) T1i =Top surface of bottom plate (oC),
T2i =bottom surface of top plate (oC), T2 =Top surface of top plate (oC)
Experiment: 1 Al-Air-Al (In presence of Pressure)
Experiment 1: From the outcome results of Al-Air-Al pair in absence of pressure condition, it was observed that, Al was taken as bottom and top plate and air was taken as thermal interface material, temperature drop of intermediate zone is increased and the same experiment performed in presence of pressure, temperature drop of intermediate zone remained constant.
Figure 3.1 Schematic line diagram of experimental setup
Figure 3.2. Schematic actual diagram of experimental setup
3.2 Experimental Test Procedure
A circular form of Copper (EC 101) and Aluminum (HE30/6082) plate of size (diameter: 184 mm & thickness: 0.5mm) are taken for experimentation. A circular form of copper plate is placed on heat source of circular type electric heater (diameter: 200 mm, Height: 110 mm from the datum) having ceramic alloys material (insulation) which prevents the losses. In which, Cu (Bottom) - Al (Top) composite pair with interface material is placed on electric coil heater. Each of
plates has four grooves, ‘k’ types thermocouple are placed
inside that grove which measures the temperature difference (T1i-T2i) between top surface of copper plate and bottom surface of aluminum plate with the help of 8 channel temperature indicator. In Presence of pressure conditions, Calibrated weight (100-2000 kg) is placed on center of top plate at starting position so that pressure is uniformly distributed. One more thermocouple is also placed at bottom surface of Copper plate its temperature (T1) remains constant 40oC–70oC means constant heat flow is maintained by varying voltage of continuous variable autotransformer which is directly connected with electric coil heater. Also, one thermocouple is mounted on top surface (T2) of Al top plate. Both of these temperatures (T1 & T2) are also measured with the help of temperature indicator. The average temperature of plate surface is measured under the steady state condition at 40oC-70oC temperature interval. An experiment has been conducted with some specific conditions i.e. steady state conditions, one dimensional heat transfer, assuming constant Environment Temperature, avoiding convection losses, avoiding Radiation losses, minor Experimental errors avoided, proper Insulation, surfaces are clean and contact is static, thermal conductivities are uniform etc. to achieve ideal results. Same experiments are performed orientation wise in which changes the position of top & bottom plate with different interface material in ambient pressure condition. Same experiments test procedure was repeated for Al-Al composite
pair with different interfacial material in presence of pressure condition.
4. RESULTS AND DISCUSSION
Based on experimental work on TCR, Five experiments were performed with same and different composite material pair using different interface material in presence of pressure conditions as well as same experiments were performed orientation wise. In advancement of minimization of TCR, experiments with various pressure range also have been conducted for possible different pairs of metal disc with TIM. The effect of pressure for weight ranges 100gm -1800gm was investigated. In whole experiment, T1 was kept at constant temperature 60oC because at this temperature, significance results were obtained for previous experiments (Reference given). During these all experiments, makes some suitable assumptions are as discussed in previous ones.
Figure 4.1. Composite metallic pair
Where;
Q = Total Heat Flow (W),
T1 = bottom surface temperature of bottom plate (oC) T1i =Top surface of bottom plate (oC),
T2i =bottom surface of top plate (oC), T2 =Top surface of top plate (oC)
Experiment: 1 Al-Air-Al (In presence of Pressure)
Experiment: 2 Cu-Air-Al (In presence of Pressure)
Experiment 2: It was observed that temperature drop of bottom Cu plate and top Al plate was decreased but temperature drop of intermediate interface zone remained constant. Temperature drop of interface zone was less compared to Al-Air-Al in presence of pressure condition (Experiment no: 1) and Cu-Air-Al in absence of pressure condition (Reference given (29) Experiment no: 2)
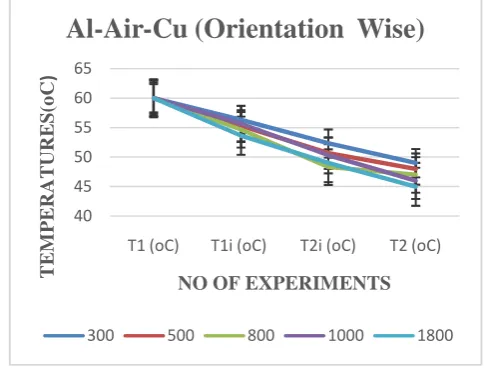
Experiment: 3 Al-Air-Cu (O) (In presence of Pressure)
Experiment 3. In Al-Air-Cu (Orientation wise) composite pair in presence of pressure, temperature drop of bottom Cu plate and top Al plate was decreased but temperature drop of intermediate interface zone remained constant. Temperature drop of interface zone was less compared to Cu-Air-Al in presence of pressure condition (Experiment no: 2) and Al-Air-Cu in absence of pressure (Reference given (29) Experiment no: 3).
Experiment 4: It was observed that temperature drop of bottom Copper plate, interface brass foil and top aluminum plate was remained constant. But temperature drop of interface zone was less compare to Cu-Air-Al in presence of pressure condition (Experiment no: 7) and Cu-Air-Al in absence of pressure condition. (Reference (29) Experiment no: 4)
Experiment: 4 Cu-Brass-Al (In presence of Pressure)
Experiment: 5 Al-Brass-Cu (O) (In presence of Pressure)
Experiment 5: In case of Cu-Brass-Al (Orientation wise) composite pair in presence of pressure,temperature drop of bottom Al plate, Brass interface and top Cu plate remained constant. But temperature drop of interface zone was more compare to Cu-Brass-Al in presence of pressure condition (Experiment no: 9) and Al-brass-Cu in absence of pressure condition. (Reference (29) Experiment no: 5)
5. Validation:
Based on performing five experiments with same and different composite material pair & interface material, Brass foil offered minimum thermal contact resistance compared to air. Experimental 4 & 5 results were validated in ANSYS
workbench’12 software through static thermal analysis.
[image:4.595.39.283.375.559.2]Outcomes results are illustrated graphically and in tabular form which are very close to experimental results
Table 5.1. Validated Experimental and ANSYS results of Cu-Brass-Al and Al-Brass-Cu (O) in presence of pressure
condition
Weight Source
Temp Cu-Brass-AL Al-Brass-Cu(O) T1 T2 Exp T2 ANSYS T2 Exp T2 ANSYS 300 gm 60 50 51.236 49 48.526 500 gm 60 52 52.869 51 52.986 800 gm 60 52 52.486 53 53.846 1000 gm 60 53 52.035 54 52.135 1800 gm 60 52 52.066 54 51.941
40 45 50 55 60 65 70
T1 (oC) T1i (oC) T2i (oC) T2 (oC)
T
E
M
P
E
RAT
URE
(o
C
)
NO OF EXPERIMENTS
Cu-Air-Al (With Pressure)
300 500 800 1000 1800
40 45 50 55 60 65
T1 (oC) T1i (oC) T2i (oC) T2 (oC)
T
E
M
P
E
RAT
URE
S
(o
C
)
NO OF EXPERIMENTS
Al-Air-Cu (Orientation Wise)
300 500 800 1000 1800
40 45 50 55 60 65
T1 (oC) T1i (oC) T2i (oC) T2 (oC)
T
E
M
P
E
RAT
URE
(o
C
)
NO OF EXPERIMENTS
Cu-Brass-Al (With Pressure)
300 500 800 1000 1800
40 45 50 55 60 65
T1 (oC) T1i (oC) T2i (oC) T2 (oC)
T
E
M
P
E
RAT
URE
S
(o
C
)
NO OF EXPERIMENTS
Al-Brass-Cu (Orientation Wise)
Figure 5.1. Temperature distribution profile Cu-Brass-Al (Left) and Al-Brass-Cu (O) (Right)
The Figure 5.1 shows variation of temperature distribution pattern for Cu-Brass-Al (Left) and Al-Brass-Cu (O) (Right) composite pair. It depicts how to temperature distribution profile gradually occurs from bottom plate to top plate which
are obtained in ANSYS workbench’12. The red color regions
indicates bottom source plate temperature which identify higher (Maximum) value of temperature. The light green (left) & darkbluish (right) regions indicates top sink plate temperature depicts lower (minimum) value of temperature. In first case, Temperature drop between top and bottom plate are less than Cu-Brass-Al composite pair in absence of pressure condition (Er. Bipin et al., 2015). This happened due to effect of pressure on composite pair. In second case, temperature drop bottom to top more than Cu-Brass-Al composite pair in presence of pressure condition. This happened due to properties of aluminum plate effected on temperature drop.
6. Micro observation:
Comparison between Al-air-Al, Cu-Air-Al, Al-Air-Cu (Orientation Wise), Cu-Brass-Al, Al-Brass-Cu (Orientation wise) pairs in absence of pressure at 60oCtemperature with orientation wise are illustrated in tabular as well as graphical representation in following ways respectively
Table 6.1. Experimental results of Al-air-Al, Cu-Air-Al, Al-Air-Cu (Orientation Wise), Al-Air-Cu-Brass-Al, Al-Brass-Al-Air-Cu (Orientation
wise) at 60oC
EXPERIMENTAL RESULTS
Composite pair T1 (oC) T1i (oC) T2i (oC) T2 (oC)
Al-Air-Al 60 53.66 49 45 Cu-Air-Al 60 50.33 47 45 Al-Air-Cu(O) 60 55 54.33 54 Cu-Brass-Al 60 56.33 53 52 Al-Brass-Cu (O) 60 58.33 55.66 54
Figure 6.1. Comparison of composite pair in presence of pressure condition
Table 6.1. Temperature difference overall, bottom, intermediate and top zone
Composite pair T1-T2 (oC) T1-T1i (oC) T1i-T2i (oC) T2i-T2 (oC) Al-Air-Al 15 6.34 4.66 4 Cu-Air-Al 15 9.67 3.33 2 Al-Air-Cu(O) 6 5 0367 0.33 Cu-Brass-Al 8 3.67 3.33 1 Al-Brass-Cu (O) 6 1.67 2.67 1.66
Table 6.2. Best pair results of air and brass as interface material in presence of pressure condition
S. No.
Temperature Drop Zone
Application Best Pair Air (interface
material)
Brass (interface material) 1 Bottom to Top Zone (∆T) Al-Air-Cu(O) Al-Brass-Cu (O) 2 Bottom Plate (∆T1) Al-Air-Cu(O) Al-Brass-Cu (O) 3 Intermediate Zone (∆Ti) Al-Air-Cu(O) Al-Brass-Cu (O) 4 Top Plate Zone (∆T2) Al-Air-Cu(O) Cu-Brass-Al
After performing five experiments in presence of pressure & orientation conditions, it was observed from the outcome of the results listed in above table and graph,
When temperature drop is required minimum for particular bottom to top overall application (∆T) in case
of air was used as interface material, best results obtained through Al-Air-Cu pair (Orientation wise) whose temperature drop is minimum compare to others in which Al-Air-Cu were taken as bottom, interface and top plate respectively. Thus, Al-Air-Cu is the best composite pair compare to others.
When temperature drop is required minimum for particular bottom to top overall application (∆T) in case
of brass foil was used as interface material, best results obtained through Al-Brass-Cu pair (Orientation wise) whose temperature drop is minimum compare to others in which Al-Brass-Cu were taken as bottom, interface and top plate respectively. Thus, Al-Brass-Cu is the best composite pair compare to others.
40 45 50 55 60 65
T1 (oC) T1i (oC)
T E M P E RAT URE (o C )
NO OF EXPERIMENTS
Comparison (With Pressure )
Al-Air-Al Al-Air-Cu(O) Al-Brass-Cu (O)
Figure 5.1. Temperature distribution profile Cu-Brass-Al (Left) and Al-Brass-Cu (O) (Right)
The Figure 5.1 shows variation of temperature distribution pattern for Cu-Brass-Al (Left) and Al-Brass-Cu (O) (Right) composite pair. It depicts how to temperature distribution profile gradually occurs from bottom plate to top plate which
are obtained in ANSYS workbench’12. The red color regions
indicates bottom source plate temperature which identify higher (Maximum) value of temperature. The light green (left) & darkbluish (right) regions indicates top sink plate temperature depicts lower (minimum) value of temperature. In first case, Temperature drop between top and bottom plate are less than Cu-Brass-Al composite pair in absence of pressure condition (Er. Bipin et al., 2015). This happened due to effect of pressure on composite pair. In second case, temperature drop bottom to top more than Cu-Brass-Al composite pair in presence of pressure condition. This happened due to properties of aluminum plate effected on temperature drop.
6. Micro observation:
Comparison between Al-air-Al, Cu-Air-Al, Al-Air-Cu (Orientation Wise), Cu-Brass-Al, Al-Brass-Cu (Orientation wise) pairs in absence of pressure at 60oCtemperature with orientation wise are illustrated in tabular as well as graphical representation in following ways respectively
Table 6.1. Experimental results of Al-air-Al, Cu-Air-Al, Al-Air-Cu (Orientation Wise), Al-Air-Cu-Brass-Al, Al-Brass-Al-Air-Cu (Orientation
wise) at 60oC
EXPERIMENTAL RESULTS
Composite pair T1 (oC) T1i (oC) T2i (oC) T2 (oC)
Al-Air-Al 60 53.66 49 45 Cu-Air-Al 60 50.33 47 45 Al-Air-Cu(O) 60 55 54.33 54 Cu-Brass-Al 60 56.33 53 52 Al-Brass-Cu (O) 60 58.33 55.66 54
Figure 6.1. Comparison of composite pair in presence of pressure condition
Table 6.1. Temperature difference overall, bottom, intermediate and top zone
Composite pair T1-T2 (oC) T1-T1i (oC) T1i-T2i (oC) T2i-T2 (oC) Al-Air-Al 15 6.34 4.66 4 Cu-Air-Al 15 9.67 3.33 2 Al-Air-Cu(O) 6 5 0367 0.33 Cu-Brass-Al 8 3.67 3.33 1 Al-Brass-Cu (O) 6 1.67 2.67 1.66
Table 6.2. Best pair results of air and brass as interface material in presence of pressure condition
S. No.
Temperature Drop Zone
Application Best Pair Air (interface
material)
Brass (interface material) 1 Bottom to Top Zone (∆T) Al-Air-Cu(O) Al-Brass-Cu (O) 2 Bottom Plate (∆T1) Al-Air-Cu(O) Al-Brass-Cu (O) 3 Intermediate Zone (∆Ti) Al-Air-Cu(O) Al-Brass-Cu (O) 4 Top Plate Zone (∆T2) Al-Air-Cu(O) Cu-Brass-Al
After performing five experiments in presence of pressure & orientation conditions, it was observed from the outcome of the results listed in above table and graph,
When temperature drop is required minimum for particular bottom to top overall application (∆T) in case
of air was used as interface material, best results obtained through Al-Air-Cu pair (Orientation wise) whose temperature drop is minimum compare to others in which Al-Air-Cu were taken as bottom, interface and top plate respectively. Thus, Al-Air-Cu is the best composite pair compare to others.
When temperature drop is required minimum for particular bottom to top overall application (∆T) in case
of brass foil was used as interface material, best results obtained through Al-Brass-Cu pair (Orientation wise) whose temperature drop is minimum compare to others in which Al-Brass-Cu were taken as bottom, interface and top plate respectively. Thus, Al-Brass-Cu is the best composite pair compare to others.
T1i (oC) T2i (oC) T2 (oC)
NO OF EXPERIMENTS
Comparison (With Pressure )
It was also observed at micro level from the graph and outcome results in presence of pressure conditions, Heat transfer phenomena is effected not only overall temperature drop (∆T) but also effected on all intermediate temperature
drop zone i.e.∆T1, ∆Ti, and ∆T2. Thus, there is relationship
between the same & different composite metal pair and used different interface material. In short, there is relationship between bottom plate & interface material and interface material & top plate.
When temperature drop is required minimum for particular base plate application (∆T1) in case of air
was taken as interface material, better results obtained with Al-Air-Cu pair (Orientation wise) in which Al should be preferred as bottom and Air should be preferred as interface material. In case of brass foil was taken as interface material, better results obtained with Al-Air-Cu (Orientation wise) pair in which aluminum should be used as bottom and Air should be preferred as interface material.
When temperature drop is required minimum for particular interface contact zone application (∆Ti) in
case of air was taken as interface material, better results obtained with Al-Air-Cu (Orientation wise) pair in which Al-Air-Cu should be preferred as bottom, interface and top plate respectively. In case of brass foil was taken as interface material, better results obtained with Brass-Cu (Orientation wise) pair in which Al-Brass-Cu should be preferred as bottom, interface and top plate respectively.
When temperature drop is required minimum for particular top zone application (∆T2) in case of air was
taken as interface material, better results obtained with Al-Air-Cu pair. Thus, Air should be chosen as interface material & Cu plate should be chosen as top plate. In case of brass foil was taken as interface material, better results obtained with Al pair. Thus, Cu-Brass-Al pair should be preferred as bottom, interface and top plate.
7. Conclusion
The experiments performed in presence of pressure conditions gives more significant results compared in absence of pressure conditions.
It was concluded from all experiments in presence of pressure conditions, brasss as interface material gives significant results compared to air as interface materialbecause thermal conductivity of copper is maximum compare to air.
In case of ambient conditions, when both top and bottom plate kept as aluminum, temperature drop of intermediate zone increase with increase in temperature but presence of pressure conditions, temperature drop of intermediate zone remained constant. This happened due to effect of pressure on metallic pair.
Finally, It was concluded that from observation of five experiments in presence of pressure conditions, two specific conditionsi) When Air was taken as interface material &aluminum was taken as bottom plate.2) When brass was taken as interface material &copper was taken as bottom plate transferred the maximum heat at minimum thermal contact resistance.
REFERENCES
Papers
AvijaI.S, J. R. Culham, M.M. 2003. Yovanovich, "Review of thermal contact conductance models for joints incorporating enhancement materials," Journal of thermophysics and heta transfer, SSN-0887-8722, vol. 17,
pp. 43-52.
Bipin G. Vyas, Nilesh R. Sheth and Mukesh P. Keshwani, 2015. "Review: Thermal contact resistance of metallic composite pair", International Journal of Application or
Innovation in Engineering & Management, vol.4, pp.
193-200.
Chung, D. D. L. 2001. "Materials for thermal conduction," Applied Thermal Engineering, vol. 21, pp. 1593-1605. Donghuan Liu, Yan Luo, Xinchun Shang, 2014. "Experimental
Investigation of high temperature thermal contact resistance between high thermal conductivity C/C material and Inconel 600," International Journal Heat and mass
Transfer, ISSN-0017-9310,vol. 80, pp. 407-410.
Er. Bipin G. Vyas, Nilesh R. Sheth and Mukesh P. Keshwani, Nirmal S. Parmar, 2015. "Experemntal analysis of thermal contact resistance across different composite material pair using different interface material in ambient pressure condition", Vol.3, issue 6, 62-73.
Fieberg, C. and R.Kneer, 2007. "Determination of thermal contact resistance from transient temperature measurement," International Journal Heat and mass
Transfer, ISSN-0017-9310,vol. 51, pp. 1017-1023.
Gwinn J.P. and R.L.Webb 2002."Performance and testing of thermal interface materials," Microelectronic Journal, vol. 34, pp. 215-222.
Khounsary A.M., D. Chojnowski, L. Assoufid, 1997. "Thermal Contact Resistance across acopper -silicon interface,"
SPIE, vol. 3151, pp. 45-51.
Koichi Nishino, Shigemasa Yamashita and Kahoru Torii, 1995. "Thermal contact conductnace under low applied load in a vacuum environment" Experimental Thermal and
Fluid Science, pp. 258-271.
Larry Pryor P.E, Rick Schlobohm P.E, and Bill Brownell P.E, "A Comparison of Aluminum Vs. Copper as used in Electrical Equipment"
Lee, S., S.Song & K.P.Moran, M.M.Yovanovich, 1993. "Analytical modeling of thermal resistance in bolted joint",
Enhanced cooling Techniques for Electronics Applications ASME, pp. 115-122.
Madhusudana, C.V. 1974. "The Effect of interface fluid on thermal contact conductance," International Journal Heat
and mass Transfer, ISSN-0017-9310, vol. 18, pp. 989-991.
Majid Bahrami, M. Michael yovanovich, J. Richard Culham, 2005. "Thermal Contact resistance at low contact pressure: Effect of elastic deformation," International Journal Heat
and mass Transfer, ISSN-0017-9310, vol. 48, pp.
3284-3293.
Marcia B.H. Mantelli, M.R. Sridhar and M.M. Yovanovich, 1995. "Influence of elastic and plastic contact models on the overall thermal resistance of bolted joints", Eleventh IEEE SEMI, pp.39-47.
O'Callaghan P.W., S.D. Probert, 1988. "Reducing the Thermal Resistance of a Pressed Contact," Applied Energy, vol. 30, pp. 53-60.
plating thickness," International Journal Heat and mass
Transfer, ISSN-0017-9310, vol. 53, pp. 5373-5379.
Rao, V.V., M. V. Krishna Mrthy, J. Nagaraju, "Thermal Conductivity and thermal contact conductance studies on Al2O3/Al-AlN metal matrix Composite," Composites
Science and Technology, vol. 64, pp. 2459-2462, 2004.
Rosochowska M., K.Chodnikiewicz, R. Balendra, 2004. "A new method of measuring thermal contact conductance,"
Journal of Materials and Processing Technology,
ISSN-0924-0136, vol. 145, pp. 207-214.
Ruiping Xu, Lie Xu 2005. "An Experimental Investigation of thermal contact conductance of stainless steel at low temperatures," Cryogenics, ISSN-0011-2275,vol. 45, pp. 694-704.
Satre V. and M. Lallemand 2001. "Enhancement of thermal contact conductance for electronic systems," Applied
Thermal Engineering, vol. 21, pp. 221-235.
Seri Lee, Kevin P. Moran, Seaho song, Van Au 1995. "Constriction/Spreading Resistance Model For Electronics Packaging," ASME/JSME Thermal Engineering Conference, vol. 4, pp. 199-206.
Sunil Kumar, S. and K. Ramamurthi, 2004. "Thermal Contact Conductance of Pressed contacts at low temperature," Cryogenics, ISSN-0011-2275, vol. 44, pp. 727-734. Syed M.S. Wahid, C.V. Madhusudana 2000. "Gap
Conductance in contact heat transfer," International Journal Heat and mass Transfer, ISSN-0017-9310, vol. 43,
pp. 4483-4487.
Vishal Singhal, Paul J.Litke, Anthony F. Black, Suresh V. Garimella, 2005. "An Experimentally validated thermo-mechanical model for the prediction of thermal contact conductance," International Journal Heat and mass Transfer, ISSN-0017-9310, vol. 48, pp. 5446-5459.
Voller, G.P. and M.Tirovic 2005. "Interface pressure distributions and thermal contact resistance of a bolted joint," Mathematical Physical & Engineering Sciences, ISSN-0017-9310, vol. 461, pp. 2339-2354.
Wang Zongren, Yang Jun, Wang Shung, Zhang weifang, 2013. "Compensation Heating Technique for experimental investigation of thermal contact conductance across GH4169/K417 interface," Sciencedirect vol. 42, pp. 1572-1575.
Wolff, E.G. and D.A. Schneider 1998. "Prediction of thermal contact resistance between polished surfaecs,"
International Journal Heat and mass Transfer,
ISSN-0017-9310, vol. 41, pp. 3469-3482.
Yeh, C.L., Y.F.Chen, C.Y. Wen, K.T. Li 2003. "Measurement of thermal contact resistance of aluminum honeycombs experimental," Thermal and Fluid Science, ISSN-0894-1777, vol. 27, pp. 271-281.
Yovanovich, M.M. 1971. "Thermal Contact Conductance of turned surfaces," Aerospace science SEMI, pp. 71-80.
Books
Cengel, Y. A. 2003. Heat Transfer: A Practical Approach, Second Edition., McGraw-Hill publication, pp 2-40 & 128-143.
Holman J.P. 2010. Heat Transfer, Tenth Edition, McGraw Hill Publication, pp 1-57.
Incopera, F.P. and D.P. Dewitt, 2005. Fundamental, Fundamentals of Heat and mass Transfer, Sixth edition, willey, New york, pp 57-101.
Irvine Jr. T.F. 1983. Themal contact resistance, Hemisphere publishing corporation, pp 2.4.6.1-2.4.6.4.
Lienhard IV and V John H. 2008. A Heat transfer textbook, Third Edition, Phlogiston press, Cambridge, U.S.A, pp 3-96.