ISSN Print: 2333-9705
DOI: 10.4236/oalib.1104476 Aug. 31, 2018 1 Open Access Library Journal
Methane Gas Emissions: Methods of Improving
the Efficiency of the Biggest Landfill Gas Waste
to Energy Project in the Middle East Installed in
Amman, Jordan
Constantine Hadjidimoulas
Independent Researcher/Student, Lorton, VA, USA
Abstract
In a world of increasing population and consumption, there is a pressing need to use our resources in the best possible way. This involves reducing the generation of waste, achieving high-quality recycling and efficient use of the residual waste for highly productive clean energy generation. A waste-to-energy facility may generate a range of energy outputs such as electricity, district heating, steam for industrial processes and many other energy outputs. In this way, residual waste, i.e. waste that cannot be recycled in an economic or en-vironmentally beneficial way, can become a resource by turning it into energy for the benefit of people, countries and the environment. In the last 20 years, the main waste treatment facilities are landfills. However, during this time period, there has been a huge progress and more efficient and environmen-tally friendly methods of waste treatment as M.B.T. (mechanical biological treatment) plants, burners, medical sterilization plants etc. are constructed, but landfills still remain the main method of waste treatment. Landfills are commonly found in developing countries. These landfills are constructed following the latest construction methods that minimize the environmental problems and maximize the energy efficiency. This research deals with the energy production of the main landfill in Amman, Jordan. The biggest waste to energy facility in the Middle East is located in Amman, Jordan. This re-search paper emphasizes on the problems that can occur in a waste to energy project and introduces many unique techniques that were applied in the big-gest waste to energy project in the Middle East to improve and maximize the landfill gas production in the most financially and environmentally friendly way as possible. These techniques have proved that they maximize the CH4
concentration which increases the energy utilization of the landfill gas and How to cite this paper: Hadjidimoulas, C.
(2018) Methane Gas Emissions: Methods of Improving the Efficiency of the Biggest Landfill Gas Waste to Energy Project in the Middle East Installed in Amman, Jordan. Open Access Library Journal, 5: e4476. https://doi.org/10.4236/oalib.1104476
Received: March 7, 2018 Accepted: August 28, 2018 Published: August 31, 2018
Copyright © 2018 by author and Open Access Library Inc.
This work is licensed under the Creative Commons Attribution International License (CC BY 4.0).
DOI: 10.4236/oalib.1104476 2 Open Access Library Journal
Keywords
Renewable Energy Sources, Waste to Energy, Biogas, Environment, Methane Gas, Engineering
1. Introduction
As a summer engineering intern, I had the chance to be part of a waste to energy project in Amman, Jordan. The scope of this project is to extract the landfill gas from Ghabawi landfill and produce 5 MW electrical power from it. By extracting and utilizing the landfill gas, we prevent its escape to the atmosphere, thus pro-tecting the environment by reducing greenhouse effect due to methane (CH4)
that is the main component of landfill gas and the main gas responsible for the greenhouse phenomenon. Also, electricity is produced that helps the decrease of the consumption of conventional energy sources for electricity production.
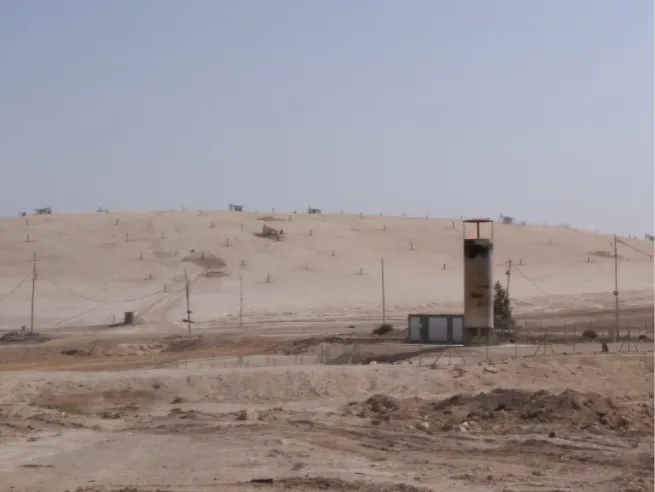
[image:2.595.210.538.460.706.2]In the Al Ghabawi dessert landfill, 40 km east of Amman, Jordan, an environ-mentally friendly project is taking place that involves the production of energy from waste. This landfill is the only landfill the city of Amman has. The total
DOI: 10.4236/oalib.1104476 3 Open Access Library Journal amount of waste that has been deposited in the landfill since the landfill was created, in 2003, is more than 12,000,000 tons. Inside the waste mass in the land-fill, a number of physical and chemical phenomena occur leading wastes to de-composition to their conversion in stable chemical compounds. Among others, the phenomenon of methane generation is observed, i.e. the creation and emis-sion of biogas produced by the anaerobic degradation of the organic fraction of wastes which is mainly consisted of methane (CH4) and carbon dioxide (CO2).
The proportion per volume of these ingredients varies between 45% - 60% for CH4 and 40% - 60% for CO2, while the entire process is completed through
cer-tain simultaneous stages that will be discussed later.
The project started in 2014 and it is currently in the biogas extraction phase. That means that the conversion of the biogas to electricity has not started yet and at the moment the biogas is burnt at a flare. It is very important that the Power Station starts producing electricity in 2018 as scheduled because of the energy needs the city of Amman has. The need for energy has encouraged people to find different and unique ways to supply the society with energy. This need has been more urgent for the city of Amman recently due to the increase of the population. The civil war in Syria has forced approximately 2,000,000 people to leave Syria and migrate in the capital of Jordan, in order to live a better life. This unexpected growth in the population has forced the city of Amman to find an alternative form of electricity production.
This waste to energy project is the largest project of its kind in the Middle East and the contractor is a joint-venture of two Greek construction Companies “Christopher D. Constantinidis S.A” and “HELECTOR S.A”. The owner of the project is the Greater Amman Municipality (GAM) and the funding for this project came from the World Bank and the European Bank of Reconstruction and Development (EBRD). The landfill accepts only Municipal Solid Waste (MSW) which includes residential wastes, commercial wastes, and non-hazardous industrial wastes. The unacceptable wastes are hazardous-toxic waste in accor-dance with the reference regulatory definition in Jordan, infectious medical waste, construction and demolition debris, tires, water and wastewater treatment plant sludge dewatered to a minimum of 20 percent solids.
1.1. Location and Topography of the Landfill
Ghabawi landfill is located within Greater Amman Municipality in Jordan, in its Eastern part, near Jabal-Al-Ghabawi. Its distance from the center of Amman is 40 km, whereas from Amman ring road is 23 km. The nearest residential area is 8 km at the west of the landfill.
The location and the surrounding area were owned by the Jordanian military, without any residential, historical and cultural land use.
The Ghabawi landfill site is extended in an area of approximately 2,000,000 m2. Its boundaries are presented in Figure 2 and Figure 3. Figure 3 depicts the
DOI: 10.4236/oalib.1104476 4 Open Access Library Journal Figure 2. Boundary of the landfill.
[image:4.595.233.516.361.705.2]DOI: 10.4236/oalib.1104476 5 Open Access Library Journal The volumes of waste have been deposited in cells as depicted in Figure 3 (above). So far Cells 1, 2, 3 have been filled with waste and the restoration works have been completed. Landfill gas is extracted from these three cells now. At the moment, cell 4 is the active cell and it is receiving all quantities of waste from Amman municipality greater area. In the following months, the construction of cell 5 will start. When the construction is completed in cell 5 the restoration and the landfill gas extraction works for cell 4 will start and cell 5 will be the active cell receiving the income waste. Gas extraction from Cell 4 is expected to start in the first months of 2019.
1.2. The Waste in the Landfill
The Ghabawi landfill serves the Greater Amman Municipality, Zarqa, and Ru-seifeh Municipalities (mostly via a transfer station) and some private companies, hospitals, universities and the Army. The waste quantity received at the landfill on a daily basis is measured by a single weighbridge which was recently con-nected to a computerized management system. The landfill accepts only Munic-ipal Solid Waste (MSW) which includes residential wastes, commercial wastes, and non- hazardous industrial wastes. The unacceptable wastes are hazardous- toxic waste in accordance with the reference regulatory definition in Jordan, in-fectious medical waste, construction and demolition debris, tires, water and wastewater treatment plant sludge dewatered to a minimum of 20 percent solids. More precisely, from August 2007, according to the internal regulation, the Solid Waste Materials that are banned from Ghabawi Landfill are: Chemical materials (Acids, Chlorine, etc.), Oils, Polyester, Alkaline materials, Liquid materials (shampoo, mineral water, etc.), Flammable and explosive materials, Iron, Wood, Tires and Nylon, Plastics, and Cardboard and Paper. Some of these materials are banned because of their hazardous properties, and others because they constitute recyclable materials and GAM intends to promote recycling. In that way, full loads of recyclable materials are refused to be dumped.
The daily waste quantity that is received in the landfill is about 3.500 tn/day. The annual quantities of waste received at Ghabawi landfill for the period from 2003 until today are presented in the following Table 1.
DOI: 10.4236/oalib.1104476 6 Open Access Library Journal
2007 795,188
2008 742,888
2009 892,464
2010 966,658
2011 937,645
2012 995,907
2013 1,048,612
2014 1,121,540
2015 1,172,980
2016 1,344,017
2017 (up to June 2017) 850.000
The next Phase of the project (3rd phase) is expected to start in August 2017.
The 3rd phase consists of the procurement and installation of the electric Power
Station (total capacity of approximately 5 MW) and their auxiliary equipment (chillers, transformers, middle voltage electric boards and equipment, blowers, etc.) as well as the permanent installation equipment necessary to transfer the produced electric energy to the supply grid. The electricity produced will be sold to the Jordanian Electric Power Company (JEPCO) which is in charge of sup-plying Jordan with electric energy.
2. Restoration of the Landfill
The restoration of the landfill is a very complicated process. The purpose of the restoration works is to insulate the landfill in order to avoid the escape of the landfill gas to the atmosphere. That is crucial for avoiding the environmental pollution from the landfill gas and increasing the quality and quantity of the ex-tracted gas that is used for the producing electrical energy so is increasing the income from the sale of the electrical energy. The time needed for the execution of the restoration works depends on the size of the landfill. More specifically the restoration works, for the Ghabawi landfill needed approximately 6 months/cell for the first 3 cells. However, cell 4 is slightly bigger than the previous three cells so it is expected that the restoration time plan will exceed the 6 months.
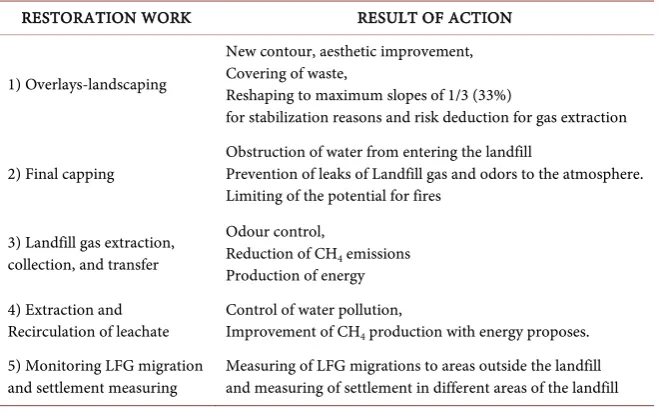
[image:6.595.210.538.89.376.2]DOI: 10.4236/oalib.1104476 7 Open Access Library Journal Table 2. The 4 stages of restoration and their results.
RESTORATION WORK RESULT OF ACTION
1) Overlays-landscaping
New contour, aesthetic improvement, Covering of waste,
Reshaping to maximum slopes of 1/3 (33%)
for stabilization reasons and risk deduction for gas extraction
2) Final capping Obstruction of water from entering the landfill Prevention of leaks of Landfill gas and odors to the atmosphere. Limiting of the potential for fires
3) Landfill gas extraction, collection, and transfer
Odour control,
Reduction of CH4 emissions Production of energy 4) Extraction and
Recirculation of leachate Control of water pollution, Improvement of CH4 production with energy proposes. 5) Monitoring LFG migration
and settlement measuring Measuring of LFG migrations to areas outside the landfill and measuring of settlement in different areas of the landfill
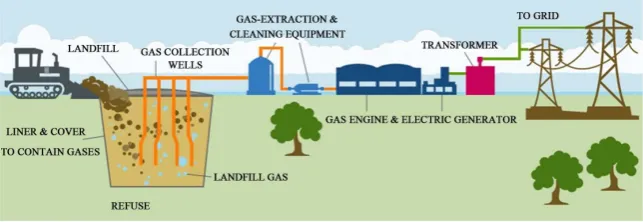
In addition to the above environmental benefits, the production of electrical energy provides income for the Owner and makes the project financially feasible. Electricity is expected to be produced in 2018. An overall presentation of the procedure of how the gas is collected and how it is converted to electricity is de-picted in Figure 4.
The restoration works that were executed in Ghabawi landfill and mentioned in Table 2 are described in detail in the following paragraphs:
2.1. Overlays-Landscaping
Before the construction of the works associated with Final Capping, LFG and Leachate Networks, it was required to execute earthworks with the necessary equipment in order to bring all cells to the appropriate condition that is:
All waste must be covered with soil; The slopes should not exceed 33%.
Table 3 shows the materials and the operation of the layers.
2.2. Final Capping
The final capping of cells 1, 2, 3 was the main rehabilitation element and the main roles of the final capping are:
Minimization of infiltration by surface water into wastes, in order to improve control over the produced leachate,
Maximization of surface run-off and drainage of the final contour, Control over biogas leaks,
Creation of a natural barrier between wastes and the environment.
DOI: 10.4236/oalib.1104476 8 Open Access Library Journal Figure 4. Process of converting biogas to electricity [3].
Table 3. Materials and operation of the layers.
Layer Operation Usual materials
Smoothing in order to construct the final Smoothing of waste contour capping-provisional capping.
Soil materials of average permeability
Low
permeability water ingress into wastes. Interruption of surface Clay Liner (GCL). Geosynthetic
Drainage
Controlled run-off of rainwater outside the final contour. Reduction of hydraulic elevation above the low permeability layer. Connected to
respective works for arranging rainwater.
Draining material (gravel)
Protection
The barrier between the capping layers and the overlaying new uses (vegetation, etc). Protection of underlying from the root
system of plants and from exposure.
Clean soil materials.
The layering of the final capping is shown in the drawing of the detailed de-sign below. Specifically, all layers on the top of the cell are the same with the lay-ers on the slopes and follow the same specifications (thickness, quality, water permeability etc.)
Description of Figure 5:
1) Above the soil material for the waste cover as well as the top formation layer a layer for smoothing the contour was placed, made from homogeneous materials of increased granulometry, with a diameter of 15 cm max, and of av-erage 50 cm thickness.
2) The above is then followed by a barrier layer made of geosynthetic clay lin-ing (GCL) of 7 mm thickness and of low water permeability, 5 × 10⁻¹¹ m/sec.
3) Then, gravel material shall be layered (drainage layer) of granulometric class 20/40 and of 20 cm thickness, with water permeability rate between 1 × 10⁻²
- 1 × 10⁻³ m/sec.
4) This was followed by separating geotextile, weighing 200 gr/m2, used for
protecting the overlaying layer against the draining layer.
[image:8.595.210.538.237.423.2]DOI: 10.4236/oalib.1104476 9 Open Access Library Journal Figure 5. Layer of final capping [1].
2.3. Landfill Gas Extraction, Collection, and Transfer
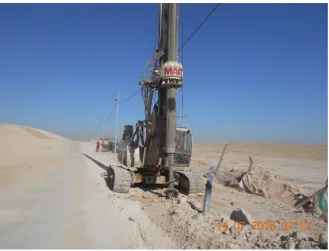
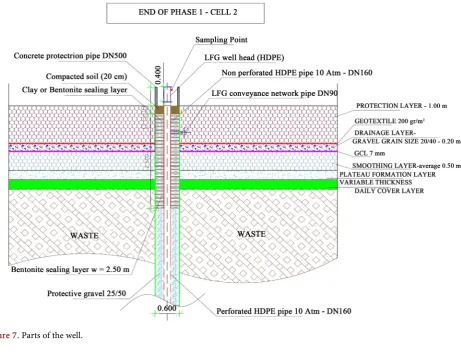
The landfill gas is extracted from the vertical wells that were drilled by a specia-lized drilling machine as is shown in the following picture. The gas wells are constructed using 600 mm diameter (nominal) boreholes. The whole landfill gas network is constructed by HDPE. (High-density polyethylene or polyethylene, it is a polyethylene thermoplastic made from petroleum).
Depicted in Figure 6 an HDPE pipe having an outside diameter of 160 mm, drilled in a pattern designed to optimize methane recovery is inserted vertically in the borehole and surrounded by gravel that acts as a filter to prevent solids from being ingested. The gravel was 25/50 mm granulometry of non-carbonic origin (limestone less than 25%).
The annulus around the top of the well was backfilled and sealed with clay or bentonite (2.5 m thickness) starting 1.5 m below the GCL layer to prevent the escape of landfill gas. The last 20 cm until the top of the well is filled with com-pacted soil.
DOI: 10.4236/oalib.1104476 10 Open Access Library Journal Figure 6. Machine used for drilling of the wella.
wellhead that permits the easy opening of the well in order to insert a submersi-ble pneumatic pump to drain the leachate from flooded wells. Each wellhead has a sample point for the measuring of the landfill gas concentration as seen in Figure 7.
In order to simplify the operation Individual wells are grouped in well stations (manifolds) that are shown in Figure 8.
The maximum distance between a well and its associated well station is 85 m and the horizontal piping between wells and well stations is made by HDPE PN10 DN90 pipe. The well stations feature a dedicated gate valve for each well, for flow regulation purposes. They also include sampling points for the measur-ing of the landfill gas concentration and flow. Both wellheads and well stations are manufactured out of hot dip galvanized steel pipe with flanged connections between steel and plastic pipes. The above ground equipment (wellheads and manifolds) are not made of HDPE but of galvanized steel due to the fact that HDPE is not suitable for explosion to the sun for a long period and at this area the days of sunshine more than 300days/year. A typical manifold design is shown in Figure 9.
The horizontal piping between manifolds and the flare was manufactured of HDPE PN10 of various diameters (max. diameter DN 560). In the next face, a power station of approximately 5 MW will be installed for the landfill gas utili-zation.
2.4. Extraction and Recirculation of Leachate
2.4.1. Leachate Extraction
DOI: 10.4236/oalib.1104476 11 Open Access Library Journal Figure 7. Parts of the well.
[image:11.595.112.485.422.709.2]DOI: 10.4236/oalib.1104476 12 Open Access Library Journal Figure 9. Typical drawing of manifold [1].
wells are installed in various positions. In each well, a pump is installed to pump the leachates from the bottom of the landfill to the surface. The position of all pumps was decided during the construction works and specifically during the drilling of the LFG wells. During the drilling of the LFG wells, the quantities of leachate in the wells were reported so the areas with larger amounts of leachate were identified and in these areas the leachate extraction wells were drilled.
2.4.2. Leachate Recirculation
In recent years, leachate recirculation has found widespread applications and continues to gain acceptance as a viable leachate treatment option. In fact, sever-al full-scsever-ale recirculation sites throughout the world, presently are evsever-aluating the performance of various recirculation systems.
These studies and research on leachate recirculation have generally reported benefits to landfill operations including an increased rate of refuse decomposi-tion and landfill stabilizadecomposi-tion, reducdecomposi-tion of leachate strength and associated lea-chate treatment cost, as well as increased methane gas production.
During the early stages of landfill operation, the leachate contained significant amounts of TDS (total dissolved solids), BOD5 (Biochemical Oxygen Demand), COD, nutrients and heavy metals. COD or Chemical Oxygen Demand is the to-tal measurement of all chemicals (organics & in-organics) in the water and in the wastewater.
BOD is a measure of, the amount of oxygen that requires for the bacteria to degrade the organic components present in water/wastewater.
The ratio of BOD/COD is about; COD is higher than that of BOD; maximum of up to 4 times in medium scale industries; but it varies based on the industrial process and nature of the raw materials used.
DOI: 10.4236/oalib.1104476 13 Open Access Library Journal when CH4 is produced, metals are precipitated and retained within the landfill.
An additional benefit of leachate recycling is the recovery of landfill gas that contains CH4. Typically, the rate of gas production is greater in leachate
recircu-lation systems. For the Al Ghabawi landfill, a vertical recircurecircu-lation system con-sisted of a number (37 wells) was constructed for the 3 cells (Cell 1 = 11, Cell 2 = 12, Cell 3 = 15). The installation of the wells was conducted by excavating a hole 1.20 min diameter and 3.5 m (below the lowest layer of the top cover) deep in the refuse. A High-density polyethylene (HDPE) pipe of 110 mm was installed in the center of the excavated holes shown in Figure 10.
Gravel backfill is installed to ensure uniform distribution of leachate at the refuse surface. A bentonite seal is installed at the well top to seal the cap against any leachate backup. These vertical systems are connected with a horizontal piping installation, above the top cover ground, which transfers the recirculated leachate from the filtration pond of the leachate treatment plant to the wells. In order to provide the necessary pressure to guide the leachate to the wells, a pumping station was constructed where submersible pumps are installed. This design provides the ability to recirculate leachate to each cell independently (for example recirculate only to cell 1 and not to the other 2 cells) and to control the quantity of recirculated leachate in relation to the produced landfill gas.
2.5. Emergency Leachate Storage Ponds
[image:13.595.66.536.436.702.2]In order to deal with leachate flowing from the cells on the western border, 4 emergency leachate storage ponds were constructed in the beginning of 2007.
DOI: 10.4236/oalib.1104476 14 Open Access Library Journal leachate and produce water for the landfill needs.
2.6. Monitoring LFG Migration and Settlement Measuring
Biogas production inspection is an indivisible section of the safe landfill opera-tion. It must be continued until the produced gas is not a hazard for the sur-rounding area. For the proper environmental inspection of the landfill, 22 biogas monitoring (detection) boreholes are installed around the landfill outside the cell limits in order to identify the landfill gas migration outside the landfill by measuring the CH4 concentration at the air inside those boreholes.
Furthermore, 132 settlement markers are installed in all cells in order to measure the settlement of different areas in the landfill on a regular basis. Im-portant Settlements may cause damages at the underground LFG pipes so repair works should be performed
2.7. Production Stages of LFG
Biogas production in a landfill is performed through five more or less distinct stages:
[image:14.595.211.538.465.706.2]Stage 1: Adjustment stage
DOI: 10.4236/oalib.1104476 15 Open Access Library Journal The organic content of wastes is degraded under the effect of microorganisms immediately after being disposed of in the landfill. At this stage, the biological degradation is aerobic, due to the air captured inside the waste mass. The mi-croorganisms causing the anaerobic or aerobic degradation come from the soil, which is used in order to cover the wastes on a daily basis, as well as from the bi-ological sludge if this is made available along with the wastes and finally by the leachate when it re-circulates inside the waste mass.
Stage 2: transition stage
In the second stage, oxygen is consumed and the anaerobic process begins. During the anaerobic process, nitrogen and sulfur are converted to gaseous ni-trogen and sulfuric hydrogen respectively by receiving electrons. At this stage, the redox potential is approx. −50 to −100 millivolts. Methane is produced when the redux potential lies between −150 and −300 millivolts. While the reduction of potential continues, the microorganisms responsible for producing methane and carbon dioxide start converting the organic material to organic acids, while reducing further pH.
Stage 3: Acid stage
This stage is characterized by the formation of organic acids and hydrogen gas. The first stage refers to the degradation of organic compounds of large mo-lecular weight into simple ones, which shall be used as a source of energy and carbon for microorganisms. In the second stage, organic acids are formed and pH is significantly reduced. In this stage, carbon dioxide is produced, as well as hydrogen gas. The value of pH of the formed leachate is lower than 5 due to the presence of organic acids. In these conditions, lots of inorganic constituents, and mainly heavy metals are dissolved and removed through leachate, as well as nu-trients.
Stage 4: Methane formation stage
This is the stage where methane is formed. Another group of microorganisms converts organic acids and hydrogen to methane and carbon dioxide. These mi-croorganisms are strictly anaerobic (methanogens or methane formers). pΗ in-creases in neutral conditions (6.8 - 7); the same occurs in leachate.
Stage 5: Maturation stage
This stage begins when the entire biodegradable material has been converted to CH4 and CO2. As moisture enters the waste mass, the organic material that
had remained stable starts dissolving. The biogas production rate is low and mainly CH4 and CO2, are formed, as well as small quantities of Ν2 and Ο2.
The duration of each separate stage varies and depends on the quantity of the organic materials disposed of in the landfill, the availability of nutrients, the moisture of the wastes and their compression level.
2.8. Produced Biogas Quantity
DOI: 10.4236/oalib.1104476 16 Open Access Library Journal order to produce methane and carbon dioxide is the following: Based on the above equation, and by using a different chemical formula for the fast and for the slow biodegrading material, we can calculate through stoichiometry the produced biogas quantity.
Under normal conditions, the degradation rate of wastes, measured by the produced biogas quantity, presents a maximum value in the first two years and then gradually is reduced, continuing, for certain gases, for a time period ex-ceeding 25 years. If moisture does not enter the wastes, in regard to properly compressed wastes, it is not rare to locate materials at their initial condition sev-eral years after they have been disposed of.
As mentioned above, a section of the wastes shall be subjected to anaerobic degradation immediately after being disposed of in the landfill, while another section shall start degrading after several years. A similar progress is presented by the biogas production rate, as noted in the following Figure 12.
[image:16.595.220.528.463.694.2]As presented in Figure 13, biogas production starts on the second year after disposing of the wastes. It is estimated that biogas production starts approx-imately at the end of the first year of a landfill’s operation and continues for sev-eral years after being filled; small quantities can be traced even 20 years after.
DOI: 10.4236/oalib.1104476 17 Open Access Library Journal Figure 13. Effect of reduced moisture content of the production of landfill gas. Source: “Integrated Solid Waste Management” G. Tchobanoglous, H. Theisen, S. Vigil [4].
In several cases, waste moisture is not enough in order to complete their anaerobic degradation. The best moisture rate is 50% - 60%. In case of insuffi-cient moisture, the production rate is reduced, resulting in a flatter biogas pro-duction curve, expanding to a large time period.
2.9. Landfill Gas Production
The production of LFG is determined from the mass of available carbon (1 mole of carbon produces 1 mole of carbon dioxide or methane). The proportion of carbon dioxide to methane for methanogenic degradation is determined using the ratio of 1%, as described above. The quantity of carbon dioxide and hydro-gen hydro-generated acetohydro-genically is determined by the equation below.
6 12 6 3 2 2
C H O →2CH COOH 4H+ +2CO
Table 4 demonstrates the amount of the LFG produced as well as the pro-jected amount up to the year 2028, from cell 1, 2 and 3. The LFG recovered quantity is the 75% of the estimated produced quantities and it is the amount that is expected to be utilized. This 75% is a correction factor based on the expe-rience of the contractor.
3. Measurements
During my time in the project, I cooperated with two local site engineers. We were in charge of measuring the following parameters:
1) Landfill gas composition, flow, and suction at the flare (completion of Form 1)
DOI: 10.4236/oalib.1104476 18 Open Access Library Journal
3 2013 1948 1742 2830 6520 4890
4 2014 1779 1593 3285 6657 4993
5 2015 1624 1451 3021 6096 4572
6 2016 1486 1322 2763 5571 4178
7 2017 1344 1208 2516 5068 3801
8 2018 1247 1108 2293 4648 3486
9 2019 1142 1015 2095 4252 3189
10 2020 1044 935 1922 3901 2925
11 2021 955 844 1760 3559 2669
12 2022 892 779 1622 3293 2469
13 2023 845 706 1464 3015 2261
14 2024 797 654 1351 2802 2102
15 2025 735 606 1224 2565 1924
16 2026 710 554 1134 2398 1799
17 2027 669 530 1051 2250 1687
18 2028 635 507 961 2103 1577
2) Landfill gas composition and suction at each manifold (completion of Form 2)
These measurements show the efficient operation of each manifold and we can identify if any problem exists at the manifold.
3) Landfill gas composition, flow, and suction of each well (completion of Form 3)
These measurements show the efficient operation of each well and we can identify if any problem exists at the well.
4) Landfill gas composition, flow, and suction of each well at the well and at the manifold (completion of Form 4).
These measurements allowed us to check everything as in form 3 but also to identify if there is a problem at the horizontal or the vertical LFG network.
5) Leachate level inside the LFG wells (completion of Form 5)
These measurements allow us to measure the leachate level inside the wells in order to decide to pump the leachate with a portable pump or not.
6) Air composition at the monitoring wells (completion of Form 6) in order to identify if any LFG migration exists outside the cell area
[image:18.595.216.539.89.438.2]DOI: 10.4236/oalib.1104476 19 Open Access Library Journal the settlement of the landfill periodically.
A portable gas analyzer was used for these measurements and also a portable digital manometer that measures suction and differential pressure. From the differential pressure, we were able to calculate the landfill gas flow. Monitoring events should be paired with balancing activities to optimize LFG composition at individual wells and at the manifolds as relevant.
3.1. Collection Field Monitoring and Adjustment
The LFG collection field must be routinely monitored and adjusted to optimize the effectiveness of the collection system. The adjustment of valve settings to re-duce or increase LFG flows from low or high generation areas of the landfill is required to maximize LFG collection without overdrawing from those areas of the site that may be susceptible to air intrusion. It should be noted that collec-tion field adjustments must be made based upon a review of history of well or trench performance considered within the context of the overall field operation. Even relatively minor changes to a particular collection point will influence flow and vacuum at other locations within the collection system.
A certain amount of judgment gained from site-specific experience is required when making adjustments to the collection field. If combustible gas readings at a specific well or trench are found to be substantially below the plant gas concen-tration, then the flow from that well or trench should be reduced. Changes in the valve position (i.e., going from fully open to fully closed) are often coun-ter-productive, as a given well may demonstrate high oxygen/low methane at full vacuum exertion, but reasonable gas quality at some reduced level; this reflects the purpose of well control valves. Smaller changes in valve position are more conducive to effective operations and are most useful when the history of a well relative to LFG quality and valve position are recorded and utilized to guide fu-ture balancing activities.
The above mentioned routine inspections are also conducted to characterize the condition of the closure facilities and the LFG collection network to be more precise.
Personnel of the contractor is responsible for conducting the inspection of a list of items and the suggested frequency of the inspections. Typical problems that might be observed are (Table 5):
Odors: blower inoperable, broken gas well pipes;
High gas readings in monitoring boreholes: failure of impermeable lin-ers/barriers.
DOI: 10.4236/oalib.1104476 20 Open Access Library Journal suggests that none of the vacuum exerted on the well is being transmitted into the waste to draw LFG (i.e., no variance in pressure on either side of the control valve). This condition is often difficult to correct, as it requires an evaluation of the leachate and surface water control systems. In some cases, inserting pumps into LFG extraction wells can reduce liquid levels, but if the liquid is associated with a leachate mound, it is unlikely that single pumps will influence the liquid profile. In addition, biogas shall be measured in the manifolds of the collection - transfer network, placed inside the wastes.
The following measurements are going to be performed on the manifolds: Pressure (suction) measurement;
detection of concentrations of methane, carbon dioxide, and oxygen.
3.2. Limit Levels and Action Plan for LFG Network
[image:20.595.210.540.91.189.2]DOI: 10.4236/oalib.1104476 21 Open Access Library Journal Table 6. Non accepted measurements and how to treat them.
Non accepted measured parameter CH4 < 35%
Checked Values Diagnosis Recommended Actions
Same recorded values of CH4, O2 and suction pressure
for both well and manifold
There is none problem
with the LFG horizontal
network. The problem
is identified on LFG well
●STEP 1: Measurement of the leachate level at the LFG Well and check if the level is high (<15 m).
●STEP 2: Isolation of the well from the LFG system in the case of high leachate level
●STEP 3: Extract the leachate through a portable pump. The pumped leachate is transported to the wastewater treatment plant by a tanker truck.
●STEP 4: This procedure of above step should be repeated until the successful leachate level drop
●STEP 5: Measure the leachate level from the isolated well after three days ●STEP 6: If the leachate level is accepted, the isolated well is connected
again to the LFG system (through the valve at the manifold). We repeat the level measure after three days
●STEP 7a: if the CH4 is lower than 35% and leachate level is rising up again (<15 m) then we repeat the above-mentioned steps as many times as required ●STEP 7b: if the CH4 is lower than 35% and leachate level is
accepted then we isolate again the well from the LFG network and repeat the measure after 15 days
●The CH4 concentration at well is higher than to the manifold ●The O2 concentration at well is lower
than to the manifold
●The suction pressure at manifold is lower than to the well
The horizontal LFG network either is blocked by condensate or is
partly damaged
●STEP 1: Blowing air to the network after wellhead opened
●STEP 2: Repeat the suction pressure measurement after few minutes. If the problem continues to exist then we proceed to the
horizontal LFG network problematic branch repair
●The CH4 concentration at well is higher than to the manifold ●The O2 concentration at
well is lower than to the manifold ●The suction pressure at manifold is
equal with this at the well
The problem is on horizontal
LFG network Repair the problematic branch of the horizontal LFG network
●The CH4 concentration at manifold is equal with this at the well ●The O2 concentration at manifold is
equal with this at the well ●The suction pressure at manifold is
different to this at the well
The problem is on horizontal
LFG network
●STEP 1: Blowing air to the network after wellhead opened
●STEP 2: Repeat the suction pressure measurement after few minutes. If the problem continues to exist then we proceed to the horizontal LFG network problematic branch repair
Non accepted measured parameter O2 > 7%
Checked Values Diagnosis Recommended Actions
Same recorded values of CH4, O2 and suction pressure
for both well and manifold
There is none problem with the LFG horizontal network. The problem is identified on LFG well
●STEP 1: Measurement of the leachate level at the LFG Well and check if the level is high (<15 m).
●STEP 2: Isolation of the well from the LFG system in the case of high leachate level
●STEP 3: Extract the leachate through a portable pump. The pumped leachate is transported to the wastewater treatment plant by a tanker truck.
●STEP 4: This procedure of above step should be repeated until the successful leachate level drop
●STEP 5: Measure the leachate level from the isolated well after three days ●STEP 6: If the leachate level is accepted, the isolated well is connected
again to the LFG system (through the valve at the manifold). We repeat the level measure after three days
●STEP 7a: if the O2 is higher than 7% and leachate level is rising up again (<15 m) then we repeat the above-mentioned steps as many times as required ●STEP 7b: if the O2 is higher than 7% and leachate level is accepted then
DOI: 10.4236/oalib.1104476 22 Open Access Library Journal ●The CH4 concentration at well is
lower than to the manifold ●The suction pressure at manifold
is equal with this at the well
The problem is on horizontal
LFG network Repair the problematic branch of the horizontal LFG network
●The O2 concentration at manifold is equal with this at the well ●The CH4 concentration at manifold
is equal with this at the well ●The suction pressure at manifold is
different to this at the well
The problem is on horizontal LFG network
●STEP 1: Blowing air to the network after wellhead opened
●STEP 2: Repeat the suction pressure measurement after few minutes. If the problem continues to exist then we proceed to the
horizontal LFG network problematic branch repair
Non accepted measured parameter Different measured Suction Pressure
Checked Values Diagnosis Recommended Actions
The suction pressure at manifold is lower than to the well
The horizontal LFG network either is blocked
by condensate or is partly
damaged
●STEP 1: Blowing air to the network after wellhead opened
●STEP 2: Repeat the suction pressure measurement after few minutes. If the problem continues to exist then we proceed to the horizontal LFG network problematic branch repair
below describes some common LFG issues that occur in a landfill and how they can be repaired.
3.3. LFG Migration Assessment and Control
It is expected that the implementation of efficient, well-operated LFG manage-ment systems will in many cases address concerns regarding LFG migration through subsurface soils. Nevertheless, it is important to evaluate potential for migration through completion of a migration assessment and then to provide adequate controls if the LFG management system is not sufficiently protective of on or off-site migration issues. Field activities for migration assessments typical-ly include the installation of gas probes along the perimeter of the landfill. Peri-meter gas probes are used to monitor LFG migration beyond the waste discharge area typically at or near the property line or nearby structures.
DOI: 10.4236/oalib.1104476 23 Open Access Library Journal Table 7. Dangerous gas percentage and actions to prevent consequences.
Parameter Limit Level Action
Methane (CH4)
>0.5% v/v (or >10% LEL)
1) Prohibit smoking, all fires, and naked flames. 2) Post warning signs.
3) Increase ventilation to lower the methane to less than 0.5% v/v.
>1% v/v (or >20% LEL)
1) Stop all the construction activities in the affected area. 2) Evacuate personnel who are working in the affected area. 3) Prohibit entry to the affected area.
4) Increase ventilation to lower the methane level to less than 0.5% v/v
Carbon Dioxide
(CO2)
>0.5% v/v 1) Increase ventilation to lower the CO2 level to less than 0.5% v/v
>1.5%
1) Extinguish all fires and naked flames.
2) Stop all the construction works in the affected are. 3) Evacuate personnel in the affected area
4) Prohibit entry to the affected area
5) Increase ventilation to lower the CO2 level to less than 0.5% v/v
Oxygen
(O2) ≤18% v/v
1) Stop all the construction activities in the affected area. 2) Evacuate personnel in the affected area.
3) Prohibit entry to affected area.
4) Increase ventilation to increase the oxygen level to above 18% v/v
migration assessment should be completed by a Qualified Professional to identi-fy potential risk and pathways of the LFG prior to installation of any monitoring probes. The perimeter gas probes should be monitored for combustible gas con-tent and probe gauge pressure on a regular basis. Water levels within probes in-stalled near the water table or in areas of perched water tables should be moni-tored to determine seasonal fluctuations in the water table at each location. It is expected that correctly installed gas probes should generally remain dry, but a varying water table surrounding the site may cause periodic flooding of some probes. Interpretation of soil gas data from flooded probes must be undertaken with great care, as LFG composition data is generally meaningless if the soil probe screen does not have access to soil gas. Immediately following each moni-toring event, the data collected should be reviewed. The objectives of the review are:
Verify unusual and/or erroneous readings,
Identify problems and, if necessary, initiate remedial action (i.e., repair dam-aged,
Probes, calibrate or repair equipment, etc.),
Bring to the attention of the individuals responsible for detailed assessment and,
Contingency plans, those readings that may indicate gas presence, Identify the occurrence of LFG migration,
Develop any remedial actions that are warranted,
Assess the effectiveness of any actions that may have been taken.
DOI: 10.4236/oalib.1104476 24 Open Access Library Journal the following:
Barometric pressure (may be incorporated into routine LFG collection field monitoring and/or tracked daily),
Frost conditions, Soil stratigraphy, Hydrogeology,
Status of LFG controls (if applicable).
The detection of combustible gas in the soil constitutes evidence of migration; the confluence of combustible gas with high-pressure readings indicates a situa-tion where this combustible gas is migrating with a driving force beyond that of simple diffusion. Gauge pressures that are consistently positive in probes where combustible gas is detected give an indication of the magnitude of the force be-hind the migration. Gradients of combustible gas concentrations may be helpful in indicating the extent, range, and direction of migration. However, interpreta-tion of concentrainterpreta-tion gradients may be complicated by physical and/or chemical processes acting upon the gases as they move through the soil. As indicated pre-viously in this Guideline, such processes may have a preferential effect on some LFG constituents over others; specifically, the carbon dioxide component of LFG may be stripped into soil water over extended migration lengths, resulting in a proportionately-higher concentration of methane per unit volume. Soil gas con-centrations at the property boundary should not exceed the lower explosive limit of methane (5 percent by volume). If greater than 5 percent by volume of me-thane is measured at the property boundary, an additional assessment must be conducted as soon as possible to assess the potential issues that may arise from LFG migration. Additional monitoring of the probes may be warranted, as well as residential monitoring if LFG migration is suspected in residential areas around the landfill.
The measurements of LFG migration are executed one per month and the following table shows the analysis of the measurements and the necessary ac-tions that need to take place.
3.4. Measurement Process and Results
DOI: 10.4236/oalib.1104476 25 Open Access Library Journal manager in order to be analyzed that will reveal what the future actions for the project will be. The forms are seven and are completed for each cell. The mea-surements for each cell indicate whether there is an issue with the wells and the manifolds. The accepted measurements for methane and oxygen percentages have been mentioned Table 5 and Table 6. In case the measurements reveal a problem with the wells/manifolds the engineers will proceed to solve the prob-lem using certain techniques.
Below is a sample of each form (Appendix).
4. Conclusions
Waste to energy facilities has been increasing in number throughout the world as a solution to the problems societies have trying to manage enormous amounts of waste in the most environmentally friendly way possible. Although landfills are not the most effective and environmentally friendly method of waste treat-ment, many landfills exist around the world. These existing landfills give us the opportunity to take advantage of huge amounts of methane gas with high energy potential. The energy utilization of the landfill gas is crucial for the environment and for the society and as a result, the contractors try to ensure that the efficien-cy of the project is the highest possible. This can be achieved through many techniques that target to minimize the existence of leachate. These techniques have various benefits to landfill operations including an increased rate of refuse decomposition and landfill stabilization, reduction of leachate strength and as-sociated leachate treatment cost, as well as increased methane gas production. Maximizing the production of biogas, we increase the potential energy that can be produced to provide the community with electricity and other forms of ener-gy that improve the well-being of the people. In a world that the population keeps increasing along with the energy demands, finding new energy sources that serve the needs of the people and are also environmentally friendly, is something crucial.
It is certain that the more popular the method of producing energy from land-fill gas gets, more research will be conducted on the subject and waste to energy projects will become even more efficient.
Acknowledgements
DOI: 10.4236/oalib.1104476 26 Open Access Library Journal
Ghabawi Landfill, Amman, Jordan. By J/V Constantinidis Helector Design Team. [2] Personal Notes by Project Manager Mr. Christodoulos Hadjidimoulas, Mechanical
Engineer.
[3] “Landfill Design-Guidelines-BC2010.pdf.” Accessed January 9, 2018.
http://www.build-a-biogas-plant.com/PDF/LandfillDesign-guidelines-BC2010.pdf
DOI: 10.4236/oalib.1104476 27 Open Access Library Journal
Appendix
Form 1. Daily report of boosting and flaring system.
Day Time Blower CH4 (%) O2 (%) Operation Wells in (-mbar) Suction (mFlow 3/hr)
1/6 7:00 2 56 0.5 492 10 1341
2/6 7:00 2 55 0.6 492 15 1557
3/6 9:10 2 58 0.3 492 11 1548
4/6 7:00 2 55 0.6 492 13 1569
5/6 7:00 2 55 0.6 492 13 1558
6/6 7:00 2 55 0.6 492 13 1554
7/6 10:00 2 58 0.4 492 11 1534
8/6 7:00 2 55 0.6 492 13 1505
9/6 7:00 2 55 0.6 492 13 1519
10/6 7:00 2 55 0.6 492 13 1497
11/6 7:00 2 55 0.5 492 13 1503
12/6 7:30 2 55 0.6 492 14 1523
13/6 7:00 2 55 0.5 492 14 1503
14/6 7:30 2 55 0.6 492 14 1523
15/6 9:00 2 55 0.6 492 13 1516
16/6 7:30 2 55 0.6 492 14 1528
17/6 8:00 2 55 0.6 492 13 1559
18/6 7:00 2 55 0.7 492 13 1511
19/6 7:30 2 55 0.7 492 13 1508
20/6 7:30 2 54 0.7 492 13 1521
21/6 7:30 2 54 0.7 492 13 1520
22/6 8:30 2 54 0.7 492 14 1546
23/6 7:00 2 55 0.6 492 13 1566
24/6 7:30 2 54 0.7 492 14 1547
25/6 7:00 2 54 0.7 492 14 1546
26/6 7:00 2 54 0.7 492 13 1533
27/6 7:00 2 54 0.7 492 13 1546
28/6 7:00 2 54 0.7 492 14 1531
29/6 7:00 2 54 0.7 492 14 1550
DOI: 10.4236/oalib.1104476 28 Open Access Library Journal
PH2M5 55.0 0.4 −5.4 15 16
PH2M6 45.6 1.8 −5.5 10 14
PH2M7 55.6 0.4 −5.4 16 16
PH2M8 49.2 1.6 −5.2 12 12
PH2M9 54.1 0.3 −5.3 12 12
PH2M10 54.5 0.5 −5.5 16 16
PH2M11 52.9 0.9 −5.6 11 16
PH2M12 53.4 0.8 −5.3 14 14
PH2M13 54.8 0.3 −5.3 13 13
CELL 2
PH1M1 54.2 0.5 −4.6 12 17
PH1M2 57.5 0.2 −4.7 15 16
PH1M3 53.4 0.7 −4.6 11 14
PH1M4 55.1 0.3 −4.7 13 14
PH1M5 55.2 0.4 −4.7 15 16
PH1M6 55.1 0.4 −4.7 12 17
PH1M7 55.5 0.5 −4.5 15 18
PH1M8 58.2 0.3 −4.8 9 10
PH1M9 54.1 0.9 −4.6 12 14
PH1M10 61.2 0.0 −5.1 13 15
PH1M11 58.9 0.0 −4.7 3 12
CELL 3
PH3M1 53.6 0.5 −4.2 13 13
PH3M2 55.3 0.1 −4.0 9 9
PH3M3 54.7 0.2 −4.3 9 9
PH3M4 52.5 1.4 −4.3 11 14
PH3M5 53.4 0.2 −4.7 11 12
PH3M6 56.1 0.8 −4.4 16 16
PH3M7 55.1 0.6 −4.6 8 9
PH3M8 55.6 0.5 −4.5 9 9
PH3M9 55.4 0.5 −4.0 16 16
PH3M10 54.6 0.8 −4.6 13 14
PH3M11 55.6 0.4 −4.5 15 15
PH3M12 55.8 0.2 −4.4 12 13
PH3M13 55.1 0.4 −4.5 14 14
PH3M14 54.2 0.8 −4.4 17 17
PH3M17 53.4 0.7 −4.6 12 12
DOI: 10.4236/oalib.1104476 29 Open Access Library Journal Form 3. Cell 1: Manifold lines gas report.
MANIFOLD: Μ 12 DATE: 21/6/2017
WELL CH4 %(MAN) O2% (MAN) DP FLOW COMMENTS
168 53.2 0.3 0.1 2.5
157 54.8 0.0 1.9 11.0
169 54.5 0.0 0.2 3.6
182 54.6 0.0 0.2 3.6
170 54.5 0.0 0.1 2.5
183 54.3 0.9 0.1 2.5
158 55.1 0.0 1.1 8.4
171 53.1 0.3 0.1 2.5
184 50.6 1.1 0.3 4.4
172 54.8 0.4 0.2 3.6
159 54.6 0.0 1.9 11.0
160 46.4 2.8 4.4 16.8 High O2 to be checked
147 52.8 0.8 0.9 7.6
146 47.8 2.7 4.2 16.4 High O2 to be checked
TOTAL 53.4 0.8 −9.9 96.4
SUMMARISED TABLE CELL 1
MANIFOLD CH4 O2 SUCTION TOTAL OPERATION FLOW
M1 47.6 0.9 −6.4 16 15 121.50
M2 54.9 0.7 −9.1 16 16 133.32
M3 48.7 1.6 −9.3 16 16 91.48
M4 55.0 0.2 −9.1 11 11 50.10
M5 55.0 0.4 −9.8 16 15 77.74
M6 45.6 1.8 −6.7 14 10 62.61
M7 55.6 0.4 −9.6 16 16 162.15
M8 49.2 1.6 −9.9 12 12 89.49
M9 54.1 0.3 −9.9 12 12 57.14
M10 54.5 0.5 −9.8 16 16 56.70
M11 52.9 0.9 −9.9 16 11 50.78
M12 53.4 0.8 −9.9 14 14 96.44
M13 54.8 0.3 −9.9 13 13 43.56
DOI: 10.4236/oalib.1104476 30 Open Access Library Journal 46 58.7 0.5 58.8 0.0 −19.5 −0.5 0.1 2.5
38 56.7 0.5 57.7 0.0 −19.1 −6.0 0.1 2.5 37 61.1 0.0 61.7 0.0 −19.4 −4.0 0.2 3.6 36 56.6 0.3 57.8 0.0 −10.2 −3.4 9.7 24.9
35 56.9 0.3 55.1 0.4 −1.5 0.0 18.9 34.8 A lot of leachate. To be pumped
45 46.1 1.5 51.4 0.8 −19.6 −18.6 0.2 3.6 34 49.7 1.1 52.0 0.7 −19.7 −16.0 0.1 2.5 23 60.8 0.5 59.5 0.3 −19.2 −18.7 0.2 3.6
44 56.7 0.0 56.2 0.0 −6.6 positive 0.0 0.0 horizontal network No flow. Blow
33 32.6 7.5 53.8 0.0 −18.8 positive 0.0 0.0 Damaged pipe. To be repaired
43 60.5 0.0 63.9 0.0 −18.8 0.0 0.0 0.0 A lot of leachate. To be pumped
54 60.7 0.0 60.0 0.0 −18.7 −16.6 0.1 2.5
TOTAL 53.4 0.7 −11.0 88.5
SUMMARIZED TABLE
Manifold Ch4 O2 Suction
Wells
Flow Total Operation
M1 54.2 0.5 −11.1 16 12 101.38
M2 57.5 0.2 −11.9 16 15 68.21
M3 53.4 0.7 −11.0 14 11 88.51
M4 55.1 0.3 −10.5 14 13 128.63
M5 55.2 0.4 −8.1 17 15 98.51
M6 55.1 0.4 −7.9 13 12 142.82
M7 55.5 0.5 −10.7 17 15 219.45
M8 58.2 0.3 −9.3 9 9 29.99
M9 54.1 0.9 −10.7 14 12 67.20
M10 61.2 0.0 −17.0 15 13 63.53
M11 58.9 0.0 −11.3 12 3 15.10
DOI: 10.4236/oalib.1104476 31 Open Access Library Journal Form 5. Cell 2: Leachate level measurements into lfg wells (measures from ground).
DATE: MARCH 2017
Well Final well depth Leachate level (m) Well (w) Final well depth Leachate level (m)
1 15.10 5 81 29.90 11.0
2 13.90 full leachate 82 30.10 11.0
3 13.90 full leachate 83 30.10 12.0
3A 6 84 30.10 11.0
4 15.20 2 85 30.10 10.0
5 17.10 full leachate 86 30.10 4.0
6 18.00 5 86A 30.00 14.0
7 18.00 full leachate 87 30.10 13.0
8 18.00 5(MUD) 88 30.10 13.0
9 17.50 6 89 30.10 9.0
10 16.30 6 90 29.90 13.0
11 16.30 full leachate 91 29.90 12.0
12 17.00 4 92 29.80 12.0
13 21.40 4 93 29.90 6.0
13A 21.00 5 93A 30.00 11.0
14 20.60 7 94 30.10 11.0
15 20.70 3 95 30.10 11.0
16 21.60 6 96 30.10 11.0
17 23.60 9 97 30.00 13.0
18 24.20 9 98 29.90 7.0
19 24.00 9 98A 30.00 15.0
20 23.80 7 99 29.80 13.0
21 22.60 3 100 29.80 13.0
22 22.70 3 101 30.00 11.0
23 28.00 12 102 29.00 11.0
24 26.80 12 103 30.00 11.0
25 26.30 12 104 29.90 11.0
26 26.30 12 105 29.80 11.0
26A 26.00 12 106 29.90 11.0
27 27.70 13 106 29.80 11.0
28 29.30 14 107 30.10 12.0
29 29.20 14 108 30.00 11.0
30 29.30 14 109 29.70 13.0
31 28.90 14 110 29.00 14.0
DOI: 10.4236/oalib.1104476 32 Open Access Library Journal
37 29.20 14 118 30.00 10.0
38 29.30 12 119 29.10 11.0
39 29.50 12 120 29.90 10.0
40 27.50 10 121 29.10 11.0
41 29.20 13 122 23.20 full leachate
42 29.30 12 123 22.80 full leachate
43 29.50 2 124 22.30 full leachate
44 29.20 5 125 22.30 full leachate
44A 29.00 13 126 25.20 full leachate
45 26.90 9 127 26.40 full leachate
46 29.70 9 128 27.00 full leachate
47 29.60 9 129 27.50 full leachate
48 29.70 9 130 27.00 3.0
49 29.40 9 130A 27.00 9.0
50 30.00 9 131 26.80 7.0
51 29.80 10 132 25.50 4.0
52 30.00 16 133 13.10 full leachate
53 30.10 2 134 17.70 full leachate
54 22.50 5 135 16.50 3.0
55 30.10 12 136 17.90 full leachate
56 30.20 6 137 19.00 full leachate
56A 30.00 14 138 20.20 full leachate
57 30.10 6 139 21.00 full leachate
58 30.00 5 140 21.70 full leachate
58A 30.00 13 141 21.40 6.0
59 30.10 10 142 21.10 6.0
60 30.10 10 143 20.50 6.0
61 29.60 10 144 19.00 full leachate
62 30.10 10 145 14.50 full leachate
63 30.10 4 146 12.80 full leachate
DOI: 10.4236/oalib.1104476 33 Open Access Library Journal
Continued
64 30.00 13 148 11.80 full leachate
65 30.10 13 149 12.60 full leachate
66 30.10 13 150 13.50 full leachate
67 30.10 13 151 14.80 full leachate
68 30.10 5 152 14.30 borders 2 & 4
68A 30.00 12 153 14.50 borders 2 & 4
69 30.10 9 154 15.00 borders 2 & 4
70 30.10 8 155 15.60 borders 2 & 4
71 29.40 8 156 16.00 borders 2 & 4
72 29.00 9
73 27.00 8
74 25.60 9
75 29.60 7
76 29.70 13
77 29.40 7
77A 29.00 15
78 29.50 5
79 30.00 5
80 29.90 5
80A 30.00 11
Form 6. Cell 2: Settlement markers coordinates.

![Table 1. Amount of waste received in the landfill each year [2].](https://thumb-us.123doks.com/thumbv2/123dok_us/9270095.418094/6.595.210.538.89.376/table-waste-received-landfill-year.webp)
![Figure 5. Layer of final capping [1].](https://thumb-us.123doks.com/thumbv2/123dok_us/9270095.418094/9.595.60.546.69.312/figure-layer-of-final-capping.webp)
![Figure 9. Typical drawing of manifold [1].](https://thumb-us.123doks.com/thumbv2/123dok_us/9270095.418094/12.595.62.537.72.243/figure-typical-drawing-of-manifold.webp)
![Figure 10. HDPE pipe [1].](https://thumb-us.123doks.com/thumbv2/123dok_us/9270095.418094/13.595.66.536.436.702/figure-hdpe-pipe.webp)
