
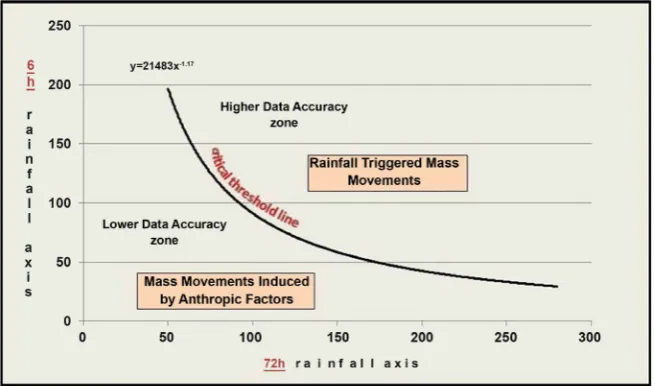
Correlation between Rainfall and Mass Movements in North Coast Region of Sao Paulo State, Brazil for 2014 2018
Full text
Figure
Related documents
Schiavone and Paterno [14] proposed Mauve – a tool for automated usability evaluation capable of evaluating WUI conformance to WCAG accessibility guidelines of all three levels
Additionally, while the specification of the awareness of disclosure of prior business failures in the regulatory environment is an important antecedent to the behavioral responses
A parallel program can be represented by a weighed Directed Acyclic Graph(DAG)[11], in which the vertex/node weights represent task processing time and the edge weights
With OO-H, a traditional business application can be “converted” to a web-compliant application by adding two new views (diagrams) that complement the structure (class diagram)
The most promising directions for electric energy industry development in Latvia and, on this basis, for the creation of energy security potential of the country,
rhini as a reducible set for Primates data set, solving the corresponding reduced and satellite profiles and com- bining the respective majority-rule (+) supertrees one gets exactly
Figure 3a and b are provided to compare the means and standard deviations of Martens hardness and indirect ten- sile strength, respectively, after light-curing, at baseline (1 day
and offering recommendations; directing care into more evidence-based practices, in improving systems, and the improvement of the professional/patient interface; the role of the
