An Energy Efficient Coverage Method for
Clustered
Wireless Sensor Networks
J. Shanbehzadeh, M. Mehrani, A. Sarrafzadeh, and Z. Razaghi
Abstract— an important issue in WSN is the regional covering. A coverage algorithm should be able to solve this issue by considering the power consumption to improve the network lifetime. This requires employing the lowest number of sensors. A solution is just to turn on a subset of nodes. This subset should be chosen in such a way to cover the entire region. This can be achieved by partitioning the network nodes and considering a representative for each part in a time slice to perform the responsibilities of all the partition members for full coverage. This will lead to turn on some of the nodes in a time slice rather than all of them. This paper presents a novel algorithm that employs grouping and time scheduling sensor nodes to turn some of them on to cover the entire area. In this algorithm the sensing range of the nodes depends on their energy. The cluster head denotes the sensing range and also turn on time slice of each node by considering node’s remained energy and position.
Keywords- sensor network; coverage; group; sensing range
I. INTRODUCTION
Wireless Sensor Networks (WSN) consists of a huge number of sensors with energy resource limitation, dispersed in a region. The network nodes sense data from the region and send them to base station. We need a suitable coverage algorithm to get the entire region information. To achieve a suitable coverage scheme, we should select a sub set of nodes to cover the whole network. This action should be able to optimize the overhead. The selection of covering nodes directly affects the network, especially in region covering.
Each node just knows about sensing region of its own. The overlap areas will have negative impact on the energy factor. It is because of the possibility of repeating messages. To avoid overlap areas clustering technique can be utilized. The clustering partitions nods into non-overlapping groups and some of the nodes can act as the representatives of the
Manuscript received January 11, 2010. This work is supported by educational center of the Islamic Azad University Science and Research Branch Tehran, I. R. Iran and Dezfoul Branch I. R. Iran.
Dr. J. Shanbehzadeh is with the Department of Computer Engineering at Islamic Azad University Science and Research Branch- Tehran, I. R. Iran..(e-mail: [email protected]).
M. Mehrani is a postgraduate student in the field of computer in Islamic Azad University, Dezfoul branch, Young Researchers Club. He is interested in wireless sensor networks. (e-mail: [email protected]).
Dr. A. Sarrafzadeh is an Associate Professor and Head of Department of Computing at Unitec, New Zealand. (e-mail: hsarrafzadeh @unitec.ac.nz).
Z. Razaghi is working with Mehralborz IT Department. She is interested in wireless sensor network.
members. In this way, the probability of creating overlapping message will be reduced and consequently energy consumption will be improved. Meanwhile, as any point of the region will be covered by using the minimum number of nodes, connectivity will also be satisfied.
The rest of this paper is as follows. Section 2 reviews related works. Section 3 describes the new algorithm. Section 4 evaluates the performance of the proposed algorithm and, the final section is conclusion and a summary of the contributions of the proposed approach.
II. RELATED WORKS
The node-scheduling scheme proposed in [1] introduces "sponsored coverage" which is about covering the same regions by different nodes. This improves energy consumption and, consequently, network lifetime. The original sensing coverage will be maintained after turning off the redundant nodes. The algorithm mentioned in [2] is based on the probability theory and makes relations between the number of nodes' neighbors and the probability of its full coverage.
The distributed k-fold pivot t-set algorithm [3] selects the smallest set among the network nodes as pivot nodes to cover the whole network to route the messages. This algorithm starts with an empty set D which contains suitable routing nodes in future. For doing this, at the beginning of algorithm each node selects 4 (for example) nearest nodes – in terms of distance – as a set called t-ball. So, for a typical network with n nodes there are n t-balls at the first round of algorithm. Then each node sends a value 1/(n-1) to the nodes that they are in its t-ball and a value 0 to other nodes that they are out of the t-ball. In this round many values are sent and received by all the network nodes. Each node sends n-1 values and also receives n-1 values. Then some node i adds all the values it has received and names this total number
This algorithm finishes when all the network nodes are gray and all of them have at least k nodes from the pivot set D that they are in t-balls, too. Now the algorithm is finished and all the nodes of the pivot set D are selected as covering ones and they can cover the entire network. A disadvantage of this algorithm is energy consumption for communication between nodes to achieve the pivot set D.
The proposed algorithm in [4] lets a node to go to sleep mode if its sensing range is covered by its neighbors. If the complexity of calculations increases there will be some simplifications to solve this problem. Dominating sets are employed in [5] and [6] to cover single points of the region. In [5] the sensing range of nodes is adjustable and nodes are deployed randomly to monitor several targets. To save energy, covering nodes will be organized into some sets and will be activated successively. Each node can be a member of several sets and the targets would be covered by several sets.
Dai and Wu [6] state that a set is dominating if either all the hosts or their neighbors are in the set. The size of the dominating sets and their configurations have direct impact on the efficiency of dominating-set-based routing because of the overhead they make. Using k-connected k-dominating set is mention in [7]. K-coverage and having extensions from point coverage to area coverage are proposed in [8].
III. PROPOSED ALGORITHM
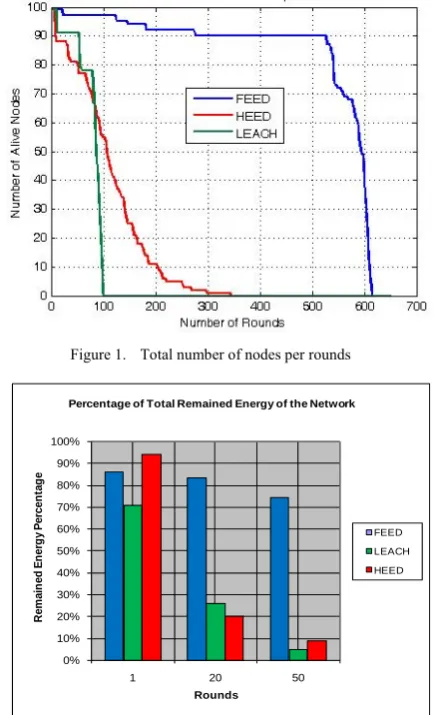
The problem that the proposed algorithm attempts to solve is to cover all the area by the entire network during its lifetime by employing the remained energy of the nodes to recognize their sensing range. First, the network is to be clustered by the FEED algorithm [9] which is presented for WSN. FEED selects the cluster heads based on factors such as: energy, density, centrality and distance between nodes. This algorithm improves the network lifetime in a significant way in comparison with two well known clustering algorithms LEACH [10] and HEED [11]. Furthermore, FEED algorithm leads the network to be fault tolerant. “Fig. 1” shows the improvement of network life time by FEED in comparison to LEACH and HEED algorithms. In FEED when the remained energy of a cluster head falls under a threshold, its supervisor node will replace it and the cluster can continue its activity by the new cluster head. This property leads network to be fault tolerant. “Fig. 1” presents that FEED algorithm improves network lifetime in comparison to two other algorithms. Supervisor node replacement can be a reason for this enhancement.
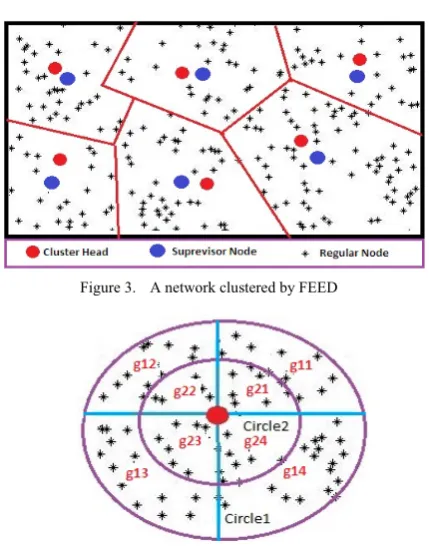
“Fig. 2” shows the percentage of total remaining energy of the network nodes after 1, 20 and 50 rounds. After one round, HEED algorithm outperforms the rest, but in later rounds FEED algorithm performance is the best. After round 300 only FEED algorithm is still executing, but LEACH and HEED algorithms have terminated. “Fig. 2” shows that FEED significantly improves the network energy consumption. “Fig. 3” shows the network clusters made by the FEED algorithm. After clustering there will be some cluster heads and some regular nodes. At the beginning of the proposed algorithm every cluster head divides its
neighboring area into four parts each one as a quarter of an assumed circle that we name it circle1.
The radius of circle1 would be equal to the distance between cluster head and its hindmost member. We assume this amount as r. So r is the radius of circle1. Then cluster head assumes another circle into circle1 that we name it circle2 and its radius is r/2. All the members of this cluster would be in circle1 and some of them that their distance from cluster head is less then r/2 would be also in circle2.
A cluster head should try to cover all the area of the circle1 by using its members. For doing such, cluster head tries to make a strategy for covering each quarter of the circle1 in the network life time. All four quarters of both of circle1 and circle2 should be covered completely during network functioning.
[image:2.595.323.534.311.487.2]There is a group for each circle. Each node whose distance from cluster head is less than r/2 will be put in group2 and if the distance of a node from cluster head is more than r/2 it would be put in group1.
Figure 1. Total number of nodes per rounds
0% 10% 20% 30% 40% 50% 60% 70% 80% 90% 100%
1 20 50
R
e
m
a
in
ed
E
n
er
g
y
P
e
rc
e
n
ta
g
e
Rounds
Percentage of Total Remained Energy of the Network
FEED LEACH HEED
Figure 2. Percentage of total remained energy of the network nodes
[image:2.595.319.537.315.673.2]and group1 includes other nodes that their distance from cluster head is between r/2 and r.
Each of the mentioned groups is divided into four subgroups and each one corresponds to the circle quarters. “Fig. 4” presents the subgroups' location. The g11, g12, g13, g14 and g21, g22, g23 and g24 are belonging to circle1 and circle2 respectively.
Each subgroup has a certain number of nodes. For example subgroupij has nij members with a number of id and
angles. The strategy that cluster head assumes is to use some of the nodes of each subgroup for covering the corresponding part of that subgroup. So, cluster head may use one or more nodes for that part in different time slices. The coverage radius considered by cluster head for each node is based on its remained energy. There is a maximum sensing range which depends on 0.33r, and also there is a minimum sensing range which depends on 0.25r so:
MaxSensingR 0.33*r (1)
MinSensingR 0.25*r (2)
MaxSensingR changes in different rounds. Thus, cluster head assumes the sensing rang of each node as follows:
MinSensingRSensingRange MaxSensingR (3)
[image:3.595.66.281.403.680.2]Figure 3. A network clustered by FEED
Figure 4. A cluster and its assumed circles
This algorithm presents a way by which almost all over the region is to be covered completely. Moreover each node has a sensing range corresponding to its remained energy:
more energy results in a bigger sensing range and vice versa. If the energy of the node is more than a threshold it contributes in covering. Each node of the cluster informs its cluster head about its energy. The threshold amount is based on maximum initial energy. Thus, if the energy of the node is more than this threshold (assume: threshold = 0.05*initial energy), cluster head decides to contribute it in covering by giving a sensing range between MaxSensingR and MinSensingR to that node. Cluster head selects covering range of every one of its member based on (4):
In (4), sr, node.energy, r and MaxSensingR are the sensing range of a node, the percentage of the remained energy of a node, the distance between cluster head and its hindmost member and the maximum sensing range of the node respectively. Based on (4) each node will be aware of its covering range. Furthermore, it gets its turn on time slice from its cluster head. By using this equation if the energy of a node is less than the threshold it will have no contribution in covering and its sensing range is equal to zero, but when a nodes’ energy is more than the threshold, its sensing range will be between 0.25r and 0.33r. When the node has the minimum required energy for contributing in covering, its sensing range would be equal to 0.25r and it will have a sensing range equals to 0.33r when it is full of energy.
The sensing range of each node that the cluster head denotes is between 0.25r and 0.33r. The usual sensing range of each node is about 8 meters in the FEED algorithm, but it can be changed based on the number of clusters. “Fig. 5” shows part of the region covered by a cluster which has eight covering active nodes. There are four active nodes in circle1 (red circles) and four active nodes in circle2 (black circles).
“Fig. 5” shows that in each cluster always 8+1 nodes (8 regular nodes and a cluster head) should be in active mode (black, red and blue circles) and the rest can go to sleep, because their neighbors perform their responsibilities. The green nodes in “Fig. 5” are those that are in charge of covering the holes. The covering region of the cluster head is presented by a blue circle at the center of the cluster. By doing such, all over of each cluster will be covered and consequently all over the network will be covered as well.
Suppose n be the number of network nodes. The desired percentage of clusters is equal to 0.05*n. So, there will be about twenty nodes in each cluster. As we said just 9 nodes should be in active mode in each time and 11 nodes can go to sleep mode.
sr
threshold y
node.energ
,
0
otherwise ,
(0.25r)] , R MaxSensing *
nergy Max[node.e
Figure 5. A part of region covered by a cluster
The problem that can occur is the existence of holes between covering circles. But, “Fig. 5” presents that the probability of having holes is low. However, if such event happens, then cluster head will turn on the nearest node to that hole.
The worst situation that can take place is to have 4 holes between the covering circles. Thus, 7/20 of the cluster nodes will go to sleep and there is at most thirty five percent energy efficiency in a round for a cluster and consequently for the entire network.
In the best condition 11/20 of all the nodes can go to sleep. This means that in each round there is at most about fifty five percent reduction in the network energy consumption. Thus, network lifetime is increased about fifty five percent.
An important point is the percentage of clusters assumed for the network. Usually, this amount is equal to 5%, but it may change to 4% or 6% in some rounds. Changing the percentage of clusters leads to some changes in the functionality of the algorithm as shown in Table. I.
By changing the percentage of clusters, percentage of minimum and maximum number of the slept nodes per round will change. In parallel with these changes, the maximum sensing range changes and leads to denoting different sensing range for active nodes. Let a be the usual sensing range of a node which is equal to 8 meters, but it changes when the percent of clusters changes. We relate MaxSensingR to both of a and r, as follows:
(5) max(0.25r , 1.2a) , a < 0.25r
MaxSensingR = max (0.29r , a) , 0.25r < a < 0.33r
0.33r , a > 0.33r Table I. Average percent of active and slept nodes Percentage
of clusters
Number of nodes in each cluster
Min percent of slept
nodes
Max percent of slept
nodes
Ave percent of slept nodes
4 25 12/25 = %48 16/25 = %6۴ %56
5 20 7/20 = %35 11/20 = %55 %45
6 17 4/17 = %24 8/17 = %47 %35.5
The best situation occurs when the size of the area is 100*100 and the number of nodes is equal to 100, or the size of the area is 200*200 and the number of nodes is equal to 200, or the size of the area is 300*300 and the number of nodes is equal to 300. This models are well known standard models used in several same works. In this models with this condition that the dispersion of the nodes is normal, the usual sensing range (a) is equal to 8 meters. Now, we pay attention to the results of the coverage. Some facts about r, MinSensingR and MaxSensingR are mentioned in “Table. II”. “Table. II” shows that energy reduction can be computed, easily. Note that there is well energy reduction for slept nodes, but active nodes are loosing energy. Based on (5), MaxSensingR changes in different implementations of the network and consequently energy reduction will have different kinds, because r changes as a result of changing the implementation of the network. It is possible sometimes for MaxSensingR to be greater than a. So, active nodes will have at most about twenty percent more energy consumption or at most about twenty percent less energy consumption depending on the percent of the clusters. Thus, average percent of energy reduction (AER) can be computed as follows:
(OEC) * 1) (AAN -ASN
AER (6)
In above equation, AER is average percent of energy reduction, ASN is average percent of slept nodes, AAN is average percent of active nodes and OEC is over energy consumption of the active nodes. Also cluster head is active, so we increment AAN.
AER (worst) = MIPS – (OEC * MAPA) (7) AER (best) = MAPS – (OEC * MIPS) (8)
In (7), AER (worst) is the worst case and the minimum amount of average percent of energy reduction, MIPS is the minimum percent of slept nodes and MAPA is the maximum percent of active nodes.
In (8), AER (best) is the best case and the maximum amount of average percent of energy reduction, MAPS is the maximum percent of slept nodes and MIPS is the minimum percent of active nodes.
IV. PERFORMANCE EVALUATION
This section presents the performance evaluation of the algorithm. By considering indicated facts and (6), the worst case for average percent of energy reduction (AER(worst)) and best case for average percent of energy reduction (AER(best)) can be computed as shown in Table. III. The results of this method are shown in “Fig. 6”. Based on this figure, this method can save energy from %28 to %67 during coverage.
Table II. Maximum and minimum sensing range percentage
of clusters r MinSensingR = 0.25r MaxSensingR=0.33r
4 35 9 12
5 28 7 9
Table III. Average percent of energy reduction percentage
of clusters
OEC AER(worst) AER(best)
4 less than 0.2 48-20=28 64-20=44
5 0 35-0=35 55-0=55
6 less than - 0.2 24+20=44 47+20=67
Energy Reduction
28%
35%
44% 44%
55%
67%
0% 10% 20% 30% 40% 50% 60% 70% 80%
4 5 6
Percentage of Clusters
P
e
rcen
ta
g
e
o
f E
n
er
g
y
R
e
d
u
ct
io
n
AER(Worst) AER(best)
Figure 6. The results of the persented coverage algorithm
By doing such, always every cluster has some nodes to be turning on and other nodes go to sleep mode. The width of circle1 and circle2 is equal to 0.5r, so having a sensing range greater then 0.33r is redundant, and if sensing range of a node is less than 0.25r it will help to make holes.
It is possible for a node to be turning on more that once per a round, because after the last node finishes its duty the first node starts covering again, if the round is still continuing.
By the proposed algorithm all over the region will be covered completely till end of the network life time. By applying (4), sensing range of each node will be chosen by cluster head during every round in a dynamic way. So, network covering will be under control of cluster heads and they work as the managers of coverage algorithm.
This coverage method is at the expansion of a clustering algorithm (FEED) and can be improved, because FEED clustering algorithm selects cluster heads based on important factors like energy, density, centrality and node distances. Furthermore it considers a supervisor node for each cluster to replace the cluster head if it fails.
V. CONCLUSION
This paper presents a novel coverage method for WSN. This method employs clustering and pays attention to energy of nodes to denote the covering range. Cluster heads are in the charge of denoting these ranges for their members. Some groups are to be created for each cluster region and there are two circles in each, circle1 and circle2 with radius r and r/2,
respectively. For covering all over the region all the groups of all the clusters together should cover their corresponding areas to achieve at region full coverage. The nodes of each group are to be scheduled to be turn on by cluster head to cover the area. This method can save energy from %28 to %67 during coverage which can significantly improve the network life time.
REFERENCES
[1] D. Tian and N. Georganas. “A coverage-preserving node scheduling scheme for large wireless sensor networks.”, Proc. WSNA’02, pp. 32–41, September 2002.
[2] H. O. Sanli, H. C¸ am, and X. Cheng. “Eqos: An energy efficient qos protocol for wireless sensor networks.” Proc. WMC’04, Jan. 2004. [3] D. Bein, “Fault-tolerant k-fold Pivot Routing in Wireless Sensor
Networks”, Proceedings of the 41st Hawaii International Conference on System Sciences, 2008.
[4] D. Tian and N. Georganas. “A coverage-preserving node scheduling scheme for large wireless sensor networks.”, Proc. 1st ACM Workshop on Wireless Sensor Networks and Applications, 2002. [5] M. Cardei, J. Wu, M. Lu, and M. O. Pervaiz. “Maximum network
lifetime in wireless sensor networks with adjustable sensing ranges.” Proc. IEEE International Conference on Wireless and mobile computing, Networking and Communications (WiMob), 2005. [6] F. Dai and J. Wu. “An extended localized algorithm for connected
dominating set formation in ad hoc wireless networks.” IEEE Transactions on Parallel and Distributed Systems, 15(10):908–920, 2004.
[7] F. Dai and J. Wu. “constructing k-connected k-dominating set in wireless networks.” Proc. IPDPS, Apr. 2005.
[8] Z. Jiang, R. Kline, J. Wu, and F. Dai. “Energy efficient k- coverage in wireless sensor networks with connected dominating set.”, 2005, unpublished.
[9] M. Mehrani, J. Shanbehzadeh, A. Sarrafzadeh, S. J. Mirabedini and C. Manford, “FEED – Fault tolerant Energy Efficient Distributed Clustering for Wireless Sensor Networks”, The 12th International Conference on Advanced Communication Technology (ICACT2010), Phoenix Park, Korea, submitted for publication.
[10] W. Heinzelman, A. Chandrakasan and H. Balakrishnan, “Energy-efficient communication protocol for wireless microsensor networks,” Proc. the 33rd Annual Hawaii International Conference on System Sciences (HICSS), Maui, HI, Jan. 2000, pp. 3005 – 3014. [11] O. Younis and S. Fahmy, “HEED: A Hybrid, Energy-Efficient,