ISSN: 1680-5593
© Medwell Journals, 2011
Corresponding Author: Zhihui Zhao, Keylab of Animal Embryo Engineering,
Microarray Analysis on the Differences of Gene Expression in Longissimus
Dorsi Muscle Tissue Between 1 and 24 Months Chinese Red Steppes
Lihong Qin, Guoliang Zhang, Yang Cao, Jiabao Zhang,
1 2 2 1
Yumin Zhao and Zhihui Zhao
2 1
Keylab of Animal Embryo Engineering, 1
College of Animal Science and Veterinary Medicine, Jilin University, 130062 Changchun, P.R. China
Branch of Animal Science, Jilin Academy of Agricultural Sciences, 2
136100 Gongzhuling, P.R. China
Abstract: Gene expression in different growth stages showed differences. In order to establish the correlation between gene expression mechanisms and beef traits formation which controlled by polygenes, microarray analysis was performed in Longissimus dorsi muscle tissue between 1 and 24 months Chinese red steppes. About 1,282 (5.6%) probes showed significant differences at the 2 growth stages and 126 genes showing strong correlation with beef traits formation were gained by the GO analysis. With the KEGG analysis, 63 pathways were found to be related to beef traits formation which involved 73 genes. About 28 genes were found in a single pathway while 35 genes were found in 2-16 pathways, respectively. The panel of transcripts and gene pathway analysis in different growth stages may be helpful for the study on beef traits formation and the gene expression profile construction in Longissimus dorsi muscle tissues would also make a model for screening candidate genes which have genetic effect on meat quality in bovine.
Key words: Microarray, gene expression profile, different growth stage, beef traits formation, Chinese red steppe, muscle
INTRODUCTION different traits by analyzing gene expression mechanisms. Beef traits controlled by polygenes are affected by myogenesis are involved by Gene Ontology (GO) and many factors such as genetic factors, nutrition, age, Kyoto Encyclopaedia of Genes and Genomes (KEGG) slaughtering and processing technology but the genetic analysis. In their research, most genes were found in a factors are the most influential. In-depth studies of the single pathway, even some were found in up to seven molecular mechanisms of beef traits formation are pathways. Combining the pathways and the microarray expected to develop. Kee et al. (2008) analyzed the information, about 21 pathways showed sufficient correlation between beef transcriptome and 4 different information content for further analysis. These pathways beef traits: Shear Force (SF), Water Holding Capacity were related to the regulation of several steps in (WHC), Cooking Loss (CL) and Loin Eye Area (LEA) in myogenesis and energy metabolism. The experiment Korean native cattle. The results showed that SF was indicates that combining microarray results and biological mainly related to energy metabolism, LEA to rRNA pathway information will give insight into biological trait processing, WHC to protein metabolism. Thus energy, formation.
protein metabolism and meat quality establishes a causal The present study try to relate gene expression relationship after the aging process. In Ponsuksili et al. changes to beef traits formation at two stages (1 and 24 (2008), the resarcher showed that in 1,279 transcripts with months of age) by the GO and the KEGG analysis. trait correlated expression to WHC, 897 expressions QTL Knowing these relationships may provide a better (eQTL) with 104 eQTL coinciding with QTL regions understanding of gene expression in beef traits controlled for WHC, 96 transcripts had trans acting and 8 transcripts by polygenes. It was necessary to develop method to had cis acting regulation. These results showed that select candidate genes of beef traits by searching Gene the differences of traits may eventually be linked to Ontology (GO) and biochemical pathways databases genes expressions. Thus, we may predict the (KEGG).
MATERIALS AND METHODS genechip sample cleanup module (Affymetrix) at 94°C for Animals and muscle samples: A total of 18 bulls of the cRNA per replicate in hybridization mixture then was same breed (Chinese red steppe) were included in the hybridized to Bovine Genome Array from Affymetrix study; 9 were 1 month old while remaining 9 were GeneChips and incubated overnight at 45°C in Affymetrix 24 months old and all provided by Jilin Academy of GeneChip Hybridization Oven 640, all according to the Agricultural Sciences. They were maintained in standard manufacturer’s instructions. The mixture was removed 16 conditions and fed with standard diets. The bulls were h after hybridization in several cycles; the chips were humanly killed at the slaughter house of the academy and washed with nonstringent buffer and stained with fresh longissimus dorsi muscle tissues were obtained streptavidin-phycocrythrin antibody solution (Affymetrix) during the process which were immediately frozen in on an automated Affymetrix GeneChip Fluidic Station 450 liquid nitrogen and stored at -80°C for microarray analysis. station. The data were collected by using affymetrix Total RNA isolation and validation: Total RNA from using Affymetrix GeneChip Operating Software muscle samples was extracted using Trizol reagent (GCOS1.4).
(Invitrogen, USA) and purified using QIAGEN RNeasy
Total RNA Isolation kit (QIAGEN, USA). The RNA Quantitative real-time RT-PCR: To validate the results of quantity was assessed by measure the optical density at the microarrays, 6 genes (IGF2 (down-regulated), PSPH 260/280 nm using Nanodrop ND-1000 (Nano-Drop (down-regulated), IGFBP2 (no significant change), IGFBP5 Technology, Wilmington, DE) and the integrity of total (no significant change), GPAM (up-regulated), CAPN3 RNA samples were assessed qualitatively on an agilent (up-regulated)) showing differential expression were bio analyzer by inspection of 18 and 28S rRNA bands selected and analyzed by real-time RT-PCR. Genes were after gel electrophoresis. chosen in different pathways. Primers were designed Microarray target preparations and hybridization: The expression levels were determined by using the cDNA for microarray analysis (probe labeling, hybridization and quantitative real-time PCR amplification with SYBR scanning) was performed using Affymetrix GeneChip Green I kit (Biotechs, China). Specificity of all individual Bovine Genome Array (Affymetrix, Santa Clara, CA, USA) amplification reactions was confirmed by melting curve following the manufacturer’s instruction in the CapitalBio analysis. Real-time expression values were calculated by Corporation, Beijing, China. Total RNA (10 µg) or mRNA using the relative standard curve method. Standard (0.2 µg) was first reverse transcribed using a T7-Oligo curves were generated for each mRNA by using 10-fold (dT) promoter primer in the first-strand cDNA synthesis serial dilutions. The reactions were denatured at 95°C for reaction. Following RNase H-mediated second-strand 5 min followed by 45 cycles at 95°C for 10 sec and 60°C for cDNA synthesis, the double-stranded cDNA was purified 30 sec in the ABI PRISM 7500 Sequence detection system and served as a template in the subsequent In vitro (Applied biosystems, USA). Data are reported as values Transcription (IVT) reaction. The IVT reaction was carried normalized to the housekeeping gene GAPDH. One way out in the presence of T7 RNA Polymerase and a ANOVA analysis was performed using SPSS (13.0) biotinylated nucleotide analog/ribonucleotide mix for software. The significance of differences between the complementary RNA (cRNA) amplification and biotin means for each gene was evaluated using LSD or labeling. The biotinylated cRNA targets were fragmented Tamhane’s T2 test (for significance levels of p<0.05). All in 1 x fragmentation buffer solution provided with the the values are presented as means±SEM.
35 min. A total of 10 µg of fragmented biotin-labeled
genechip scanner 3000. Microarray images quantified
[image:2.612.75.535.602.726.2]using Primer Premier5 software (Table 1). Relative mRNA
Table 1: Primer pairs used for real-time PCR
Gene symbols GenBank accession number Sequence (5'-3') Product size (bp)
IGF2 NM_174087 F-CCTTCGCCTCGTGCTGCTATG 135
R-GTCGGTTTATGCGGCTGGATG
PSPH NM_001046355 F-TGAGACGCAGCCAACAG 150
R-CCGAATCCAATGAAAGC
IGFBP2 NM_174555 F-ACTCCCTACACATCCCCAACTG 123
R-GGATCAGCTTCCCGGTGTTAG
IGFBP5 S52657 F-GGTTTGCCTGAACGAAAAGA 111
R-CTTGGGCGAGTAGGTCTCC
GPAM CK977603 F-GATGCCAAGTCTCAAGTTCCT 244
R-CCCTCAATGTGTCTGGGTTTT
CAPN3 NM_174260 F-ATGGAGACTGGGTGGACG 87
Microarray data analysis: The 6 chips rectified were made Quantitative real-time RT-PCR: To confirm the by normalization processing using dChip (Affymetrix)
software (Li and Wong, 2001a, b). False discovery rates for the genes were calculated by using t-test and p-values. Fold changes were calculated based on unadjusted data’s means.
Genes were annotated with NetAffx (Liu et al., 2003) and differentially expressed genes were identified using Significance Analysis of Microarrays (SAM). Using the criterion of cutoff limitation as a fold change >2 or <0.5 and q-value <5%, differential expression genes were screened and clustered with the Cluster 3.0 software. The selected genes were further analyzed in the context of Gene Ontology (GO) biological process and KEGG biological pathway using the molecule annotation system 2.0 (MAS 2.0, http://bioinfo.capitalbio.com/mas3/) software (CapitalBio, Beijing, China).
RESULTS AND DISUSSION
Microarray analysis: The Affymetrix GeneChip Bovine Genome Array which contains 24,128 probe sets representing >23,000 transcripts and 19,000 UniGene clusters was used to profile gene expression in the longissimus dorsi muscle of 1 and 24 months old Chinese red steppes.
The microarray hybridization results showed that 22,810 probe sets were used to detect which accounts 94.5% of the total number of probes and 16,321 (71.6% of the total number) probe sets were detected. At the cutoff criteria of the signed fold change >2 or <0.5 and q<Q5%, a total of 1,282 transcripts (5.6% of total probe sets on the array) were differentially expressed at the two stages, 959 (4.2%) of which were up-regulated while 323 (1.4%) were down-regulated (GEO number: GSE21782). About 1,008 differential gene annotations obtained using the molecule annotation system 2.0 (CapitalBio, Beijing, China) among of which 4 gene transcripts are unknown proteins in the functions (0.4%) while 274 of which show no homology to any known sequence.
BLAST analysis revealed that 1,001probe genes (745 up-regulated and 256 down-regulated) share significant similarity in amino acid sequence with other functional genes accounting for 78.1% of the total number of probe sets. However, 281 (21.9%) probe genes (214 up-regulated and 67 down up-regulated) did not show similarity with other functional genes (June 2009).
microarray data, 6 genes (2 down-regulated genes (IGF2 and PSPH), 2 up-regulated genes (GPAM and CAPN3) and 2 genes with no significant change (IGFBP2 and IGFBP5)) with differentially expressed were selected for quantitative real-time PCR. Absolute quantification method was chosen for each of the 6 genes in the experiment (Tichopad et al., 2003). Linearized plasmid DNA was used to plot a standard curve to quantify absolute gene expression changes and the R for each2 standard curves was >0.99. The values were presented as means±SEM (Table 2). SPSS analysis showed that the expression of IGF2 (Sig., 0.008) and PSPH (Sig., 0.032) are down-regulated, GPAM (Sig., 6.919e-008) and CAPN3 (Sig., 0.004) are up-regulated, IGFBP2 (Sig., 0.808) and IGFBP5 (Sig., 0.748) with no significant change (Fig. 1). These results were exactly consistent with the microarray experiment.
Gene Ontology (GO) analysis: The selected genes with significant expression difference at the 2 stages were analyzed in the context of GO biological process. The GO analysis dynamically assigns different genes to different GO biological process categories and provides a z score for each category.
The z score represents a statistical measurement of relative gene expression dynamic in a given GO term. This approach revealed very interesting phenomena. When we choose GO class of level 0, gene expression fall in 4 Gene ontology categories including molecular functions (464), biological processes (747) ontology categories and cellular components (201) but when it comes to the GO class of level 1,282 categories were obtained (Fig. 2).
Analysis of the genes may affect beef traits: About 585 genes in 1,282 genes of significant expression difference were provided with gene annotations in relation to cellular component. About 126 genes related to cellular component and metabolism out of 457 genes with definite biological process showed correlation with meat quality trails.
Based on the functional analysis of 126 genes showing correlation with beef traits, we identified a few common biological metabolism categories including glucose (16 genes, 10 up-regulated and 6 regulated), lipid (19 genes, 17 up-regulated and 2 down-regulated), protein and amino acid (40 genes, 32
up-Table 2: Number of copies of mRNA in different genes (copies µLG1)
Periods IGF2 PSPH IGFBP2 IGFBP5 GPAM CAPN3
1 month old bull 86676±11028 747797±56197 1289908±141173 1413683±179104 736994±27502 58866±5967
24 months old bull 46014±5765 518622±76179 1351482±217665 1492156±160146 2246000±99830 209489±37816
regulated and 8 down-regulated), DNA and RNA (4 genes, 1 up-regulated and 3 down-regulated), energy (9 genes, 6 up-regulated and 3 down-regulated) and others (38 genes, 30 up-regulated and 8 down-regulated) (Table 3). KEGG analysis showed 63 pathways related to metabolism. About 73 genes expressed with significant difference. We also find 28 genes in a single pathway, 35 genes in 2-16 pathways (Table 4).
[image:4.612.320.542.99.245.2]Meat quality traits were quantitative traits controlled by polygenes. Due to the special characteristic, many of genes could not be clearly established links with traits, although they played an important role. Some of them regulating the expression of other genes could not simply be correlated with in the way of measuring traits and gene expression. Therefore, measurement seemed to be pointless in this case. Thus, new methods were expected to develop.
Fig. 1: The gene expression of IGF2, PSPH, IGFBP2, IGFBP5, GPAM, CAPN3 of 1 and 24 months Chinese red steppes longissimus dorsi muscle in quantitative real-time RT-PCR
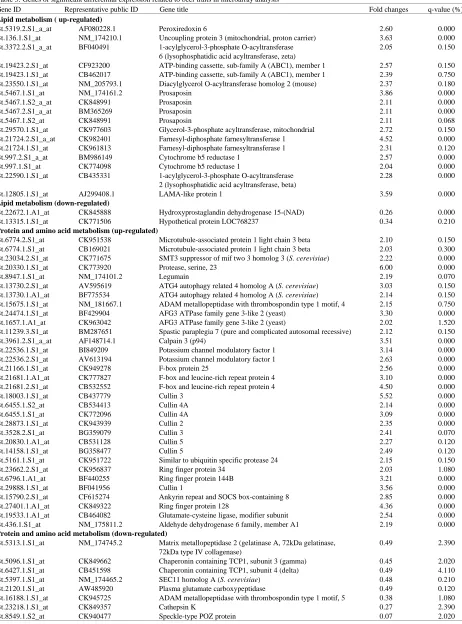
[image:4.612.93.529.307.699.2]Table 3: Genes of significant differential expression related to beef traits in microarray analysis
Gene ID Representative public ID Gene title Fold changes q-value (%)
Lipid metabolism ( up-regulated)
Bt.5319.2.S1_a_at AF080228.1 Peroxiredoxin 6 2.60 0.000
Bt.136.1.S1_at NM_174210.1 Uncoupling protein 3 (mitochondrial, proton carrier) 3.63 0.000
Bt.3372.2.S1_a_at BF040491 1-acylglycerol-3-phosphate O-acyltransferase 2.05 0.150
6 (lysophosphatidic acid acyltransferase, zeta)
Bt.19423.2.S1_at CF923200 ATP-binding cassette, sub-family A (ABC1), member 1 2.57 0.150
Bt.19423.1.S1_at CB462017 ATP-binding cassette, sub-family A (ABC1), member 1 2.39 0.750
Bt.23550.1.S1_at NM_205793.1 Diacylglycerol O-acyltransferase homolog 2 (mouse) 2.37 0.180
Bt.5467.1.S1_at NM_174161.2 Prosaposin 3.86 0.000
Bt.5467.1.S2_a_at CK848991 Prosaposin 2.11 0.000
Bt.5467.2.S1_a_at BM365269 Prosaposin 2.11 0.000
Bt.5467.1.S2_at CK848991 Prosaposin 2.11 0.068
Bt.29570.1.S1_at CK977603 Glycerol-3-phosphate acyltransferase, mitochondrial 2.72 0.150
Bt.21724.2.S1_a_at CK982401 Farnesyl-diphosphate farnesyltransferase 1 4.52 0.000
Bt.21724.1.S1_at CK961813 Farnesyl-diphosphate farnesyltransferase 1 2.31 0.120
Bt.997.2.S1_a_at BM986149 Cytochrome b5 reductase 1 2.57 0.000
Bt.997.1.S1_at CK774098 Cytochrome b5 reductase 1 2.04 0.000
Bt.22590.1.S1_at CB435331 1-acylglycerol-3-phosphate O-acyltransferase 2.28 0.000
2 (lysophosphatidic acid acyltransferase, beta)
Bt.12805.1.S1_at AJ299408.1 LAMA-like protein 1 3.59 0.000
Lipid metabolism (down-regulated)
Bt.22672.1.A1_at CK845888 Hydroxyprostaglandin dehydrogenase 15-(NAD) 0.26 0.000
Bt.13315.1.S1_at CK771506 Hypothetical protein LOC768237 0.34 0.210
Protein and amino acid metabolism (up-regulated)
Bt.6774.2.S1_at CK951538 Microtubule-associated protein 1 light chain 3 beta 2.10 0.150
Bt.6774.1.S1_at CB169021 Microtubule-associated protein 1 light chain 3 beta 2.03 0.300
Bt.23034.2.S1_at CK771675 SMT3 suppressor of mif two 3 homolog 3 (S. cerevisiae) 2.22 0.000
Bt.20330.1.S1_at CK773920 Protease, serine, 23 6.00 0.000
Bt.8947.1.S1_at NM_174101.2 Legumain 2.19 0.070
Bt.13730.2.S1_at AV595619 ATG4 autophagy related 4 homolog A (S. cerevisiae) 3.03 0.150
Bt.13730.1.A1_at BF775534 ATG4 autophagy related 4 homolog A (S. cerevisiae) 2.14 0.150
Bt.15675.1.S1_at NM_181667.1 ADAM metallopeptidase with thrombospondin type 1 motif, 4 2.15 0.750
Bt.24474.1.S1_at BF429904 AFG3 ATPase family gene 3-like 2 (yeast) 3.30 0.000
Bt.1657.1.A1_at CK963042 AFG3 ATPase family gene 3-like 2 (yeast) 2.02 1.520
Bt.11239.3.S1_at BM287651 Spastic paraplegia 7 (pure and complicated autosomal recessive) 2.12 0.150
Bt.3961.2.S1_a_at AF148714.1 Calpain 3 (p94) 3.51 0.000
Bt.22536.1.S1_at BI849209 Potassium channel modulatory factor 1 3.14 0.000
Bt.22536.2.S1_at AV613194 Potassium channel modulatory factor 1 2.63 0.000
Bt.21166.1.S1_at CK949278 F-box protein 25 2.56 0.000
Bt.21681.1.A1_at CK777827 F-box and leucine-rich repeat protein 4 3.10 0.000
Bt.21681.2.S1_at CB532552 F-box and leucine-rich repeat protein 4 4.50 0.000
Bt.18003.1.S1_at CB437779 Cullin 3 5.52 0.000
Bt.6455.1.S2_at CB534413 Cullin 4A 2.14 0.000
Bt.6455.1.S1_at CK772096 Cullin 4A 3.09 0.000
Bt.28873.1.S1_at CK943939 Cullin 2 2.35 0.000
Bt.3528.2.S1_at BG359079 Cullin 3 2.41 0.070
Bt.20830.1.A1_at CB531128 Cullin 5 2.27 0.120
Bt.14158.1.S1_at BG358477 Cullin 5 2.49 0.120
Bt.5161.1.S1_at CK951722 Similar to ubiquitin specific protease 24 2.15 0.150
Bt.23662.2.S1_at CK956837 Ring finger protein 34 2.03 1.080
Bt.6796.1.A1_at BF440255 Ring finger protein 144B 3.21 0.000
Bt.29888.1.S1_at BF041956 Cullin 1 3.56 0.000
Bt.15790.2.S1_at CF615274 Ankyrin repeat and SOCS box-containing 8 2.85 0.000
Bt.27401.1.A1_at CK849322 Ring finger protein 128 4.36 0.000
Bt.19533.1.A1_at CB464082 Glutamate-cysteine ligase, modifier subunit 2.54 0.000
Bt.436.1.S1_at NM_175811.2 Aldehyde dehydrogenase 6 family, member A1 2.19 0.000
Protein and amino acid metabolism (down-regulated)
Bt.5313.1.S1_at NM_174745.2 Matrix metallopeptidase 2 (gelatinase A, 72kDa gelatinase, 0.49 2.390
72kDa type IV collagenase)
Bt.5096.1.S1_at CK849662 Chaperonin containing TCP1, subunit 3 (gamma) 0.45 2.020
Bt.6427.1.S1_at CB451598 Chaperonin containing TCP1, subunit 4 (delta) 0.49 4.110
Bt.5397.1.S1_at NM_174465.2 SEC11 homolog A (S. cerevisiae) 0.48 0.210
Bt.2120.1.S1_at AW485920 Plasma glutamate carboxypeptidase 0.49 0.120
Bt.16188.1.S1_at CK945725 ADAM metallopeptidase with thrombospondin type 1 motif, 5 0.38 1.080
Bt.23218.1.S1_at CK849357 Cathepsin K 0.27 2.390
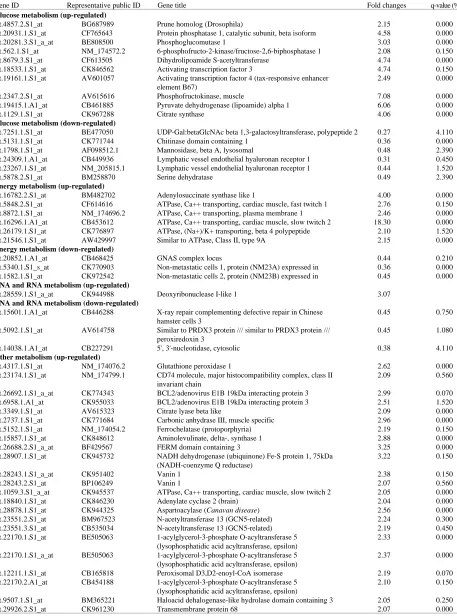
Table 3: Continued
Gene ID Representative public ID Gene title Fold changes q-value (%)
Glucose metabolism (up-regulated)
Bt.4857.2.S1_at BG687989 Prune homolog (Drosophila) 2.15 0.000
Bt.20931.1.S1_at CF765643 Protein phosphatase 1, catalytic subunit, beta isoform 4.58 0.000
Bt.20281.3.S1_a_at BE808500 Phosphoglucomutase 1 3.03 0.000
Bt.562.1.S1_at NM_174572.2 6-phosphofructo-2-kinase/fructose-2,6-biphosphatase 1 2.08 0.150
Bt.8679.3.S1_at CF613505 Dihydrolipoamide S-acetyltransferase 4.74 0.000
Bt.18533.1.S1_at CK846562 Activating transcription factor 3 4.74 0.150
Bt.19161.1.S1_at AV601057 Activating transcription factor 4 (tax-responsive enhancer 2.49 0.000
element B67)
Bt.2347.2.S1_at AV615616 Phosphofructokinase, muscle 7.08 0.000
Bt.19415.1.A1_at CB461885 Pyruvate dehydrogenase (lipoamide) alpha 1 6.06 0.000
Bt.1129.1.S1_at CK967288 Citrate synthase 4.06 0.000
Glucose metabolism (down-regulated)
Bt.7251.1.S1_at BE477050 UDP-Gal:betaGlcNAc beta 1,3-galactosyltransferase, polypeptide 2 0.27 4.110
Bt.5131.1.S1_at CK771744 Chitinase domain containing 1 0.36 0.000
Bt.1798.1.S1_at AF098512.1 Mannosidase, beta A, lysosomal 0.48 2.390
Bt.24309.1.A1_at CB449936 Lymphatic vessel endothelial hyaluronan receptor 1 0.31 0.450
Bt.23267.1.S1_at NM_205815.1 Lymphatic vessel endothelial hyaluronan receptor 1 0.44 1.520
Bt.5878.2.S1_at BM258870 Serine dehydratase 0.49 2.390
Energy metabolism (up-regulated)
Bt.16782.2.S1_at BM482702 Adenylosuccinate synthase like 1 4.00 0.000
Bt.5848.2.S1_at CF614616 ATPase, Ca++ transporting, cardiac muscle, fast twitch 1 2.76 0.150
Bt.8872.1.S1_at NM_174696.2 ATPase, Ca++ transporting, plasma membrane 1 2.46 0.000
Bt.16296.1.A1_at CB453612 ATPase, Ca++ transporting, cardiac muscle, slow twitch 2 18.30 0.000
Bt.26179.1.S1_at CK776897 ATPase, (Na+)/K+ transporting, beta 4 polypeptide 2.10 1.520
Bt.21546.1.S1_at AW429997 Similar to ATPase, Class II, type 9A 2.15 0.000
Energy metabolism (down-regulated)
Bt.20852.1.A1_at CB468425 GNAS complex locus 0.44 0.210
Bt.5340.1.S1_s_at CK770903 Non-metastatic cells 1, protein (NM23A) expressed in 0.36 0.000
Bt.1582.1.S1_at CK972542 Non-metastatic cells 2, protein (NM23B) expressed in 0.45 0.000
DNA and RNA metabolism (up-regulated)
Bt.28559.1.S1_a_at CK944988 Deoxyribonuclease I-like 1 3.07
DNA and RNA metabolism (down-regulated)
Bt.15601.1.A1_at CB446288 X-ray repair complementing defective repair in Chinese 0.45 0.750
hamster cells 3
Bt.5092.1.S1_at AV614758 Similar to PRDX3 protein /// similar to PRDX3 protein /// 0.45 1.080
peroxiredoxin 3
Bt.14038.1.A1_at CB227291 5', 3'-nucleotidase, cytosolic 0.38 4.110
Other metabolism (up-regulated)
Bt.4317.1.S1_at NM_174076.2 Glutathione peroxidase 1 2.62 0.000
Bt.23174.1.S1_at NM_174799.1 CD74 molecule, major histocompatibility complex, class II 2.09 0.560
invariant chain
Bt.26692.1.S1_a_at CK774343 BCL2/adenovirus E1B 19kDa interacting protein 3 2.99 0.070
Bt.6958.1.A1_at CK955033 BCL2/adenovirus E1B 19kDa interacting protein 3 2.51 1.520
Bt.3349.1.S1_at AV615323 Citrate lyase beta like 2.09 0.000
Bt.2737.1.S1_at CK771684 Carbonic anhydrase III, muscle specific 2.96 0.000
Bt.5152.1.S1_at NM_174054.2 Ferrochelatase (protoporphyria) 2.19 0.150
Bt.15857.1.S1_at CK848612 Aminolevulinate, delta-, synthase 1 2.88 0.000
Bt.26688.2.S1_a_at BF429567 FERM domain containing 3 3.25 0.000
Bt.28907.1.S1_at CK945732 NADH dehydrogenase (ubiquinone) Fe-S protein 1, 75kDa 3.22 0.150
(NADH-coenzyme Q reductase)
Bt.28243.1.S1_a_at CK951402 Vanin 1 2.38 0.150
Bt.28243.2.S1_at BP106249 Vanin 1 2.07 0.560
Bt.1059.3.S1_a_at CK945537 ATPase, Ca++ transporting, cardiac muscle, slow twitch 2 2.05 0.000
Bt.18840.1.S1_at CK846230 Adenylate cyclase 2 (brain) 2.04 0.000
Bt.28878.1.S1_at CK944325 Aspartoacylase (Canavan disease) 2.56 0.000
Bt.23551.2.S1_at BM967523 N-acetyltransferase 13 (GCN5-related) 2.24 0.300
Bt.23551.3.S1_at CB535034 N-acetyltransferase 13 (GCN5-related) 2.19 0.450
Bt.22170.1.S1_at BE505063 1-acylglycerol-3-phosphate O-acyltransferase 5 2.33 0.000
. (lysophosphatidic acid acyltransferase, epsilon)
Bt.22170.1.S1_a_at BE505063 1-acylglycerol-3-phosphate O-acyltransferase 5 2.37 0.000
(lysophosphatidic acid acyltransferase, epsilon)
Bt.12211.1.S1_at CB165818 Peroxisomal D3,D2-enoyl-CoA isomerase 2.19 0.070
Bt.22170.2.A1_at CB454188 1-acylglycerol-3-phosphate O-acyltransferase 5 2.10 0.150
(lysophosphatidic acid acyltransferase, epsilon)
Bt.9507.1.S1_at BM365221 Haloacid dehalogenase-like hydrolase domain containing 3 2.05 0.250
Table 3: Continued
Gene ID Representative public ID Gene title Fold changes q-value (%)
Bt.4732.1.S1_at NM_174239.2 Aldehyde dehydrogenase 1 family, member A1 2.01 0.750
Bt.16325.1.A1_at CK847813 Glutaryl-Coenzyme A dehydrogenase 2.02 0.000
Bt.9777.1.S1_at CB172625 3-hydroxybutyrate dehydrogenase, type 1 2.02 1.080
Bt.4659.1.S1_at CK953255 Aldehyde dehydrogenase 2 family (mitochondrial) 2.78 0.000
Bt.5530.1.S1_at NM_174180.2 Dehydrogenase/reductase (SDR family) member 3 2.49 0.000
Bt.14570.1.A1_at CB165420 4-aminobutyrate aminotransferase 5.14 0.000
Bt.14570.2.S1_at AW307709 4-aminobutyrate aminotransferase 3.75 0.000
Other metabolism (down-regulated)
Bt.546.1.S1_at NM_174680.2 Potassium large conductance calcium-activated channel, 0.26 2.020
subfamily M, alpha member 1
Bt.9047.1.S1_at CK847263 D-dopachrome tautomerase 0.47 0.170
Bt.3890.1.S1_at NM_174674.2 Tumor necrosis factor receptor superfamily, member 1A 0.48 1.520
Bt.23171.2.S1_at CK774607 Pterin-4 alpha-carbinolamine dehydratase/dimerization cofactor 0.23 3.100 of hepatocyte nuclear factor 1 alpha
Bt.7490.1.A1_at CK778231 Methylenetetrahydrofolate dehydrogenase (NADP+ dependent) 1-like 0.19 0.000
Bt.4897.1.S1_at NM_174094.2 inhibin, alpha 0.09 0.080
Bt.11069.1.S1_at CK771476 Adenylate cyclase 6 0.48 0.750
Bt.18945.1.A1_at CB454235 Pleckstrin homology domain containing, family G 0.39 0.080
(with RhoGef domain) member 1
Table 4: The KEGG analysis on genes of significant differential expression related to beef traits in microarray analysis N* Pathways with N gene(s) of significant differential expression(representative public ID)
1 Methane metabolism (AF080228.1), Alkaloid biosynthesis II (AF080228.1), Inositol metabolism (NM_175811.2), 3-Chloroacrylic acid degradation (CK953255), Ascorbate and aldarate metabolism (CK953255), Limonene and pinene degradation (CK953255), Synthesis and degradation of ketone bodies (CB172625), Glyoxylate and dicarboxylate metabolism (CK967288), Glycosphingolipid biosynthesis – lactoseries (BE477050), Benzoate degradation via CoA ligation (CK847813), N-Glycan degradation (AF098512.1), Glycosphingolipid biosynthesis – ganglioseries (BP102248), Bile acid biosynthesis (CK953255), Glycosylphosphatidylinositol(GPI)-anchor biosynthesis (CK729543), Nicotinate and nicotinamide metabolism (CB227291), Galactose metabolism (AV615616), Glycan structures – degradation (AF098512.1), Pentose phosphate pathway (AV615616), Carbon fixation (CK770445), Starch and sucrose metabolism (CK846492), Ether lipid metabolism (BF040491), Proteasome (CK957649), Citrate cycle (TCA cycle) (CK967288), O-Glycan biosynthesis (NM_177519.2), Arginine and proline metabolism (NM_173892.2), Arachidonic acid metabolism (NM_174076.2), N-Glycan biosynthesis (CK972901), Glycan structures - biosynthesis 1 (NM_177519.2)
2 Valine, leucine and isoleucine biosynthesis (CK775511, CB461885), Lysine degradation (CK847813, CK953255), Terpenoid biosynthesis (CK961813, CK982401), Vitamin B6 metabolism (CB166901, CF763176), Pantothenate and CoA biosynthesis (CK951402, BP106249), Glycerophospholipid metabolism (BF040491, CK977603), Glutathione metabolism (NM_174076.2, CB464082), Fatty acid metabolism (CK847813, CK953255), Aminoacyl-tRNA biosynthesis (CK775511, CB534569), Tyrosine metabolism (NM_177944.1, CK775534), Drug metabolism-cytochrome P450 (NM_177944.1, CK775534)
3 Phenylalanine metabolism (AF080228.1, NM_177944.1, CK775534), Porphyrin and chlorophyll metabolism (CK770847, CK848612, NM_174054.2), beta-Alanine metabolism (CB165420, AW307709, CK953255), Glutamate metabolism (CB165420, AW307709, CB464082), Pyruvate metabolism (CK953255, CB461885, CK770445), Biosynthesis of steroids (CK969564, CK961813, CK982401), Retinol metabolism (NM_205793.1, NM_174239.2, NM_174180.2), Glycolysis / Gluconeogenesis (AV615616, CK953255, CB461885), Glycan structures - biosynthesis 2 (CK729543, BE477050, BP102248)
4 Histidine metabolism (NM_177944.1, CK775534, CK944325, CK953255), Propanoate metabolism (CB165420, AW307709, CK953255, NM_175811.2), Glycerolipid metabolism (NM_205793.1, BF040491, CK953255, CK977603), Urea cycle and metabolism of amino groups (NM_177944.1, CK775534, CK953255, NM_173892.2), Fructose and mannose metabolism (AV615616, NM_174812.2, NM_174434.2, NM_174572.2), Aminosugars metabolism (CK774098, BM986149, CK982168, BM967525)
5 Alanine and aspartate metabolism(CB165420, AW307709, CK944325, CB461885, NM_173892.2), Butanoate metabolism (CB172625, CB165420, AW307709, CK953255, CB461885), Valine, leucine and isoleucine degradation (CB165420, AW307709, CK982441, CK953255, NM_175811.2), Pyrimidine metabolism (CK770903, NM_174428.2, CK730171, BM435937, CB227291)
6 Tryptophan metabolism (CK847813, NM_177944.1, CK775534, CB534569, CK953255, CK849867), Oxidative phosphorylation (NM_176676.1, NM_175807.1, CK945732, CK775109, CB538935, M38520.1)
8 Glycine, serine and threonine metabolism (CK772398, AW478353, CB166901, CF763176, CK848612, CK771294, NM_177944.1, CK775534) 10 Purine metabolism (CB439779, CK770903, NM_174428.2, CB167755, CK983189, CK846230, BM435937, CK773933, CB227291, CK771476) 134 Ubiquitin mediated proteolysis (BG358233, BM251234, CK974661, BF041956, CK943939, CB437779, BG359079, BG358477, CB531128,
CB534413, CK772096, CB419023, CB530307, BF039092) *N = The number of genes with significant differential expression
We also analyzed several genes which thought to be CaMKs. Thus, the differences in beef traits may be important and influential beef traits such as those encode related to the regulations of CaMK IId or CaMK IIg. Ca /calmodulin-dependent protein Kinases (CaMKs),2+ The MyoD gene family members encoding basic myogenic regulatory factors (MRFs), Fatty Acid-binding helixloop-helix (bHLH) transcription factors (MyoD, Proteins (FABPs) and Peroxisome Prolifemtor-activated myogenin, Myf5 and MRF4) contain one or two Receptors (PPARs). Calpains are a family of calcium transactivation domains (at the N- and C-terminus). They activated cystein proteases that are widely distributed in are able to make nonmuscle cells to have muscle cell cytoplasm and sub-organelles. phenotype in culture (Wei and Paterson, 2001). It is They go along with their endogenous inhibitor, reported that MRFs have relation to tenderness, Loin calpastatin. In calpain families, calpain l-10 are in relation Eye Area (LEA) and other beef traits (Kimet al., 2009; to tenderization of meat (Karet al., 2010). In this study, Liuet al., 2008; Zhu and Li, 2005), however the experiment calpain 1 (fold change = 0.97, q-value = 46.28%) has no showed that MyoD, MyoG, Myf6 and Myf5 have significant changes. This indicates that calpain 1 may be no significant changes. For MyoD (fold change = 1.33, unresponsible to the differences of beef traits in the q-value = 5.31%), although the q-value (5.31%) was in experiment. Meanwhile, the experiment shows that accordance with the criterion of cutoff limitation, the fold Calpastatin (fold change = 2.13, q-value = 0.07%) was change (1.33) was not within the scope of screening. significantly up-regulated which indicates that the So, it showed that the result of gene expression differences may be due to Calpastatin. The experiment comparison has no significant difference even if the also shows that calpain 3 was significantly up-regulated relaxation of screening criteria to fold change is relaxed to but in literature there are controversies on whether >R1.5 or <Q0.67 and q-value <Q5%. So, the MyoD gene calpain3 has any effect on tenderization of meat. expression showed that differences in beef traits may be Correlation analysis between the relative rate of unrelated to regulation of MRFs.
tenderization and mRNA expression of calpains revealed Intramuscular fat content (IMF) was correlated a strong relationship with calpain 3 in both species, with meat quality trails and showed significant effects bovine and ovine [r (bovine) = 0.522, r (ovine) = 0.706] on three aspects of meat: tenderness, flavor and juicy (Ilianet al., 2001). In contrast, Parret al.(1999) did not (De Volet al., 1988). Fatty Acid-binding Proteins (FABPs) find a link between calpain 3 and postmortem are small intracellular proteins involved in fatty acid tenderization in the porcine Longissimus Thoracis et transport from the plasma membrane to the sites of
lumborum (LT). $ oxidation and/or triacylglycerol or phospholipid
The discrepancy between them may be due to the synthesis (Veerkamp and Maatman, 1995). The experiment methodology or animal species. In addition in this showed that FABPs have no significant changes even the research, the calpain 10 also show no significant changes. relaxation of screening criteria to fold change is relaxed as Evidence is mounting that the Ca /calmodulin-dependent2+ above. So, the IMF expression results showed that the Kinases (CaMK) II and IV play important role in differences in beef traits may be unrelated to the regulating oxidative enzyme expression, mitochondrial regulation of FABPs.
biogenesis and expression of fibre-type specific The Peroxisome Proliferator-activated Receptors myofibrillar proteins. (PPARs) are members of the nuclear receptor superfamily Examination of Ca -dependent and Ca -independent2+ 2+ and play an important regulatory role in lipid metabolism CaMK II activity in chicken anterior latissimus dorsi (Latruffe and Vamecq, 1997). The PPAR gamma (PPARG) muscle sample after 7 days of stretch overload and subtype is a key transcription factor that controls 2 weeks of voluntary wheel running have shown that adipocyte differentiation and fat deposition in mammals stretch overload and wheel running result in a 122% but in this experiment PPARG (fold change = 0.96, increase in muscle protein content and are associated with q-value = 46.28%) as well as other members of this family 47% increase in Ca -independent CaMKII activity2+ have no significant changes. The PPAR expression (Flucket al., 2000). results showed that the differences in beef traits may be
Results indicate that CaMK IIg not CaMK IIa or -b is unrelated to the regulation of PPARs. up-regulated in aged and denervated soleus muscle and
CaMK IV is absent in skeletal but not cardiac muscle CONCLUSION (Chin, 2004). Similarly this study showed that CaMK
encoding MRFs, FABPs and PPARs do not have Kim, J.M., B.D. Choi, B.C. Kim, S.S. Park and K.C. Hong, influential impact on beef traits’formation. We also found,
it was an effective way to exclude invalid genetic pathways when the subject (beef traits in the model) was controlled by various genes. It is no doubt that we need to improve the efficiency of searching for candidate genes. At the same time, we also see the interaction of gene pathways and analyze the mechanisms of gene expression may provide some new insight in regulatory network characters of quantitative traits controlled by polygenes and the result will provided in due course.
ACKNOWLEDGEMENTS
We thank Melvin Korkor (Jilin University, P.R. China) and Naizhong Cui (Dalian University of Technology, P.R. China) for critical reading the manuscript, Yonghe Ma (Jilin University, P.R. China) for technical help and Supertech (Enuo Technology, P.R. China) for revision. This research was supported by the 863 hightech project (2008AA101010) and the National Scientific and Technological Supporting Project (2007BAD55B01).
REFERENCES
Chin, E.R., 2004. The role of calcium and calcium/calmodulin-dependent kinases in skeletal muscle plasticity and mitochondrial biogenesis. Proc. Nutr. Soc., 63: 279-286.
De Vol, D.L., F.K. McKeith, P.J. Bechtel, J. Novakofski, R.D. Shanks and T.R. Carr, 1988. Variation in composition and palatibility traits and relationships between muscle characteristics and palatibility in a random sample of pork carcasses. J. Anim. Sci., 66: 385-395.
Fluck, M., M.N. Waxham, M.T. Hamilton and F.W. Booth, 2000. Skeletal muscle Ca(2+)-independent kinase activity increases during either hypertrophy or running. J. Applied Physiol., 88: 352-358.
Ilian, M.A., J.D. Morton, M.P. Kent, C.E. le Couteur, J. Hickford, R. Cowley and R. Bickerstaffe, 2001. Intermuscular variation in tenderness: association with the ubiquitous and muscle-specific calpains. J. Anim. Sci., 79: 122-132.
Kar, P., K. Samanta, S. Shaikh, A. Chowdhury, T. Chakraborti and S. Chakraborti, 2010. Mitochondrial calpain system: An overview. Arch. Biochem. Biophys., 495: 1-7.
Kee, H.J., E.W. Park and C.K. Lee, 2008. Characterization of beef transcripts correlated with tenderness and
moisture. Mol. Cells, 25: 428-437. Yi Chuan, 27: 887-892.
2009. Associations of the variation in the porcine myogenin gene with muscle fibre characteristics, lean meat production and meat quality traits. J. Anim. Breed. Genet., 126: 134-141.
Latruffe, N. and J. Vamecq, 1997. Peroxisome proliferators and peroxisome proliferator activated receptors (PPARs) as regulators for lipid metabolism. Biochimie, 79: 81-94.
Li, C. and W.H. Wong, 2001a. Model-based analysis of oligonucleotide arrays: Model validation, design issues and standard error application. Genome. Biol., Vol. 2, No. 8.
Li, C. and W.H. Wong, 2001b. Model-based analysis of oligonucleotide arrays: Expression index computation and outlier detection. Proc. Natl. Acad. Sci. USA., 98: 31-36.
Liu, G., A.E. Loraine, R. Shigeta, M. Cline and J. Chenget al., 2003. NetAffx: Affymetrix probesets and annotations. Nucleic Acids Res., 31: 82-86.
Liu, M., J. Peng, D.Q. Xu, R. Zheng and F.E. Liet al., 2008. Association of MYF5 and MYOD1 gene polymorphisms and meat quality traits in Large White x Meishan F2 pig populations. Biochem. Genet., 46: 720-732.
Parr, T., P.L. Sensky, G.P. Scothern, R.G. Bardsley, P.J. Buttery, J.D. Wood and C. Warkup, 1999. Relationship between skeletal muscle-specific calpain and tenderness of conditioned porcine longissimus muscle. J. Anim. Sci., 77: 661-668.
Ponsuksili, S., E. Jonas, E. Murani, C. Phatsara and T. Srikanchaiet al., 2008. Trait correlated expression combined with expression QTL analysis reveals biological pathways and candidate genes affecting water holding capacity of muscle. BMC Genomics., 9: 367-367.
Te Pas, M.F., I. Hulsegge, A. Coster, M.H. Pool, H.H. Heuven and L.L. Janss, 2007. Biochemical pathways analysis of microarray results: Regulation of myogenesis in pigs. BMC Dev. Biol., 7: 66-66. Tichopad, A., M.W. Pfaffl and A. Didier, 2003.
Tissue-specific expression pattern of bovine prion gene: Quantification using real-time RT-PCR. Mol. Cell Probes, 17: 5-10.
Veerkamp, J.H. and R.G. Maatman, 1995. Cytoplasmic fatty acid-binding proteins: Their structure and genes. Prog. Lipid. Res., 34: 17-52.
Wei, Q. and B.M. Paterson, 2001. Regulation of MyoD function in the dividing myoblast. FEBS Lett., 490: 171-178.