Available Online atwww.ijcsmc.com
International Journal of Computer Science and Mobile Computing
A Monthly Journal of Computer Science and Information Technology
ISSN 2320–088X
IMPACT FACTOR: 6.017
IJCSMC, Vol. 6, Issue. 6, June 2017, pg.8 – 13
A Review Study on Big Data
Analysis Using R Studio
Anshul Jatain
1, Amit Ranjan
2Research Scholar1, Assistant Professor2
1,2
Department of Computer Science & Engineering, Om Group of Institutions (Hisar, Haryana)
Abstract:- Over the past decade, big data analysis has seen an exponential growth and will certainly continue to witness spectacular developments due to the emergence of new interactive multimedia applications and highly integrated systems driven by the rapid growth in information services and microelectronic devices. So far, most of the current mobile systems are mainly targeted to voice communications with low transmission rates. In the near future, however, big data access at high transmission rates will be. This is a review on accessible big-data systems that include a set of tools and technique to load, extract, and improve dissimilar data while leveraging the immensely parallel processing power to perform complex transformations and analysis. “Big-Data” system faces a series of technical challenges.
Keywords: - Big Data
I. INTRODUCTION
The emerging Big Data Science term, showing its broader impact on our society and in our business life cycle, has insightful transformed our society and will continue to attract diverse attentions from technical experts and as well as public in general [1] [2]. It is obvious that we are living in Big Data era, shown by the sheer volume of data from a variety of sources and its rising rate of generation. For instance, an IDC report predicts that, from 2005 to 2020, the global data dimensions will grow by a factor of 300, from 130 Exabyte‟s to 40,000 Exabyte‟s, representing a double growth every two years. This is focuses on accessible big-data systems that include a set of tools and technique to load, extract, and improve dissimilar data while leveraging the immensely parallel processing power to perform complex transformations and analysis. “Big-Data” system faces a series of technical challenges, including:
First, due to the large variety of different data sources and the huge volume, it is too difficult to collect, integrate and analysis of “Big Data” with scalability from scattered locations.
Third “Big Data” analytics must effectively excavation large datasets at different levels in real time or near real time - including modeling, visualization [2], prediction and optimization - such that inherent potentials can be revealed to improve decision making and acquire further advantages.
To address these challenges, the researcher IT industry and community has given various solutions for “Big Data” science systems in an ad-hoc manner. Cloud computing can be called as the substructure layer for “Big Data” systems to meet certain substructure requirements, such as cost-effectiveness, resistance[2], and the ability to scale up or down. Distributed file systems and No SQL databases are suitable for persistent storage and the management of massive scheme free datasets [1]. Map Reduce, R is a programming framework, has achieved great success in processing “Big Data” group-aggregation tasks, such as website ranking [10].
Hadoop integrates data storage, data processing, system management, and other modules to form a powerful system-level solution, which is becoming the mainstay in handling “Big Data” challenges. We can build various “Big Data” application system based on these innovative technologies and platforms. In light of the of big-data technologies, a systematic frame work should be in order to capture the fast evolution of big-data research.
II. ABRIEF HISTORY OF BIG DATA
Considering the growth and intricacy of “Big Data” science systems, previous descriptions are based on a one-sided view point, such as chronology or milepost technologies. The history of “Big Data” is presented in terms of the data size of interest. Under this framework, the history of “Big Data” is tied closely to the capability of efficiently storing and managing larger datasets, with size boundaries expanding by orders of degree.
FIGURE 1:GROWTH OF BIG DATA.
1) Megabyte to Gigabyte: In the 1970s and 1980s, historical business data introduced the earliest “Big Data” challenge in moving from megabyte to gigabyte sizes. [18]
2) Gigabyte to Terabyte: In the late 1980s, the popularization of digital technology caused data volumes to expand to several gigabytes or even a terabyte, which is beyond the storage and/or processing capabilities of a single large computer system [2]. Data parallelization was proposed to extend storage capabilities and to improve performance by distributing data and related tasks, such as building indexes and evaluating queries, into disparate hardware.
3) Terabyte to Petabyte: During the late 1990s, when the database community was admiring its „„finished‟‟ work on the parallel database, the rapid development of Web 1.0 led the whole world into the Internet era[2], along with massive semi-structured or unstructured web pages holding terabytes or peta bytes (PBs) of data.
III. BIG DATA PROBLEM AND CHALLENGES
However, considering variety of data sets in “Big Data” problems, it is still a big challenge for us to purpose efficient representation, access, and analysis of shapeless or semi-structured data in the further researches [12]. How can the data be preprocessed in order to improve the quality of data and analysis results before we begin data analysis [1] [2]? As the sizes of dataset are often very large, sometimes several gigabytes or more, and their origin from varied sources, current real-world databases are pitilessly susceptible to inconsistent, incomplete, and noisy data. Therefore, a number of data preprocessing techniques, including data cleaning [11], data integration, data transformation and date reduction, can be applied to remove noise and correct irregularities. Different challenges arise in each sub-process when it comes to data-driven applications.
IV. PRINCIPLES FOR DESIGNING BIG DATA SYSTEM
In designing “Big Data” analytics systems, we summarize seven necessary principles to guide the development of this kind of burning issues [3]. “Big Data” analytics in a highly distributed system cannot be achievable without the following principles [13]:
1) Good architectures and frameworks are necessary and on the top priority. 2) Support a variety of analytical methods
3) No size fits all
4) Bring the analysis to data
5) Processing must be distributable for in-memory computation. 6) Data storage must be distributable for in-memory storage. 7) Coordination is needed between processing and data units.
BIG DATA OPPORTUNITIES
The bonds between “Big Data” and knowledge hidden in it are highly crucial in all areas of national priority. This initiative will also lay the groundwork for complementary “Big Data” activities, such as “Big Data "substructure projects, platforms development, and techniques in settling complex, data-driven problems in sciences and engineering. Researchers, policy and decision makers have to recognize the potential of harnessing “Big Data” to uncover the next wave of growth in their fields. There are many advantages in business section that can be obtained through harnessing “Big Data” increasing operational efficiency, informing strategic direction, developing better customer service, identifying and developing new products and services, identifying new customers and markets, etc.
V. BIG DATA ANALYSIS
The last and most important stage of the “Big Data” value chain is data analysis, the goal of which is to get useful values, suggest best conclusions and support decision-making system of an organization to stay in competition market. [1]
Descriptive Analytics: exploits historical data to describe what occurred in past. For instance, a regression technique may be used to find simple trends in the datasets, visualization presents data in a meaningful fashion, and data modeling is used to collect, store and cut the data in an efficient way. Descriptive analytics is typically associated with business intelligence or visibility systems [2].
Predictive Analytics: focuses on predicting future probabilities and trends. For example, predictive modeling uses statistical techniques [6] such as linear and logistic regression to understand trends and predict future out-comes, and data mining extracts patterns to provide insight and forecasts [4].
Prescriptive Analytics: addresses decision making and efficiency. For example, simulation is used to analyze complex systems to gain insight into system performance and identify issues and optimization techniques are used to find best solutions under given constraints.
VI. BIG DATA CLASSIFICATION ALGORITHM
1) Decision Tree 2) Random Forest
3) Support Vector Machine
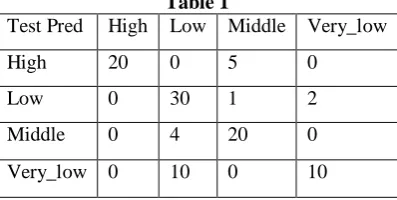
Confusion matrix - Decision Tree (Predict on Test Data)
Table 1
Test Pred High Low Middle Very_low
High 20 0 5 0
Low 0 30 1 2
Middle 0 4 20 0
Very_low 0 10 0 10
Random Forests is an ensemble learning method also thought of as a form of nearest neighbor predictor for classification and regression that construct a number of decision trees at training time and outputting the class that is the mode of the classes output by individual trees. Random Forests is a combination of tree predictors where each tree depends on thevalues of a random vector sampled independently with the same distribution for all trees in the forest. The basic principle is that a group of “weak learners” can come together to form a “strong learner”. Random Forests are a wonderful tool for making predictions considering they do not overfit because of the law of large numbers. Introducing the right kind of randomness makes them accurate classifiers and repressors[24].
Support Vector Machines (SVMs) is supervised learning methods used for classification and regression tasks that originated from statistical learning theory. As a classification method, SVM is a global classification model that generates non-overlapping partitions and usually employs all attributes. The entity space is partitioned in a single pass, so that flat and linear partitions are generated. SVMs are based on maximum margin linear discriminates, and are similar to probabilistic approaches, but do not consider the dependencies among attributes.
Traditional Neural Network approaches have suffered difficulties with generalization, producing models which overfit the data as a consequence of the optimization algorithms used for parameter selection and the statistical measures used to select the best model. SVMs have been gaining popularity due to many attractive features and promising empirical performance. They are based on the Structural Risk Minimization (SRM) principle have shown to be superior to the traditional principle of Empirical Risk Minimization (ERM) employed by conventional Neural Networks. ERM minimizes the error on the training data, while SRM minimizes an upper bound on the expected risk. This gives SRM greater generalization ability, which is the goal in statistical learning. According to, SVMs rely on preprocessing the data to represent patterns in a high dimension, typically much higher than the original feature space. Data from two categories can always be separated by a hyperplane when an appropriate nonlinear mapping to a sufficiently high dimension is used.[25]
Confusion matrix - Support Vector Machine(Predict on Test Data)
BIG DATA TOOLS:TECHNIQUES AND TECHNOLOGIES
To capture the value from “Big Data”, we need to develop new techniques and technologies for analyzing it. Until now, scientists have developed a wide variety of techniques and technologies to capture, curate, analyze and visualize Big Data.
We need tools (platforms) to make sense of “Big Data”. Current tools concentrate on three classes, namely, batch processing tools, stream processing tools, and interactive analysis tools. Most batch processing tools are based on the Apache Hadoop infrastructure, such as Mapreduce [4], R Programming and Dryad. The interactive analysis processes the data in an interactive environment, allowing users to undertake their own analysis of information.
VII. RPROGRAMMING
The R language is well established as the language for doing statistics, data analysis, data-mining algorithm development, stock trading, credit risk scoring, market basket analysis and all [9] manner of predictive analytics. However, given the deluge of data that must be processed and analyzed today, many organizations have been reticent about deploying R beyond research into production applications. [16]
VIII. LITERATURE SURVEY
Map Reduce in comparison of other design model which makes it popular tool for processing large scale data. Analysis of performance factors of Map Reduce shows that elimination of their inverse effect by optimization improves the performance of Map Reduce [3].
Authors present a literature survey and system tutorial for big data analytics platforms, aiming to provide an overall picture for non-expert readers and instill a do-it-yourself spirit for advanced audiences to customize their own big-data solutions. First, we present the definition of big data and discuss big data challenges. Next, we present a systematic framework to decompose big data systems into four sequential modules, namely data generation, data acquisition, data storage, and data analytics. These four modules form a big data value chain. Following that, we present a detailed survey of numerous approaches and mechanisms from research and industry communities. The main objective of this paper is purposed a model scalable system for Big Data analysis [2].
In the Big Data community, Map Reduce has been seen as one of the key enabling approaches for meeting the continuously increasing demands on computing resources imposed by massive data sets. At the same time, Map Reduce faces a number of obstacles when dealing with Big Data including the lack of a high-level language such as SQL, challenges in implementing iterative algorithms, support for iterative ad-hoc data exploration, and stream processing. The identified Map Reduce challenges are grouped into four main categories corresponding to Big Data tasks types: data storage, analytics, online processing, security and privacy. The main objective of this paper is identifies Map Reduce issues and challenges in handling Big Data with the objective of providing an overview of the field, facilitating better planning and management of Big Data projects, and identifying opportunities for future research in this field [4].
Micro architectural characteristics of data analysis workloads, also finding that they exhibit different characteristics from traditional workloads. Performance and power consumption using hybrid big data workloads. Continuing the work in group releases the multi-tenancy version of Big Data Bench, which support the scenarios of multiple tenants running heterogeneous applications in the same data center. The multi-tenancy version of Big Data Bench is publicly available from, which is helpful for the research of datacenter resource management and other interesting issues. Much work focuses on comparing the performance of different data management systems. For OLTP or database systems evaluation, TPC-C is often used to evaluate transaction-processing system performance in terms of transactions per minute. Cooper define a core set of benchmarks and report throughput and latency results for five widely used data management systems [5].
A large number of fields and sectors, ranging from economic and business activities to public administration, from national security to scientific researches in many areas, involve with Big Data problems. On the one hand, Big Data is extremely valuable to produce productivity in businesses and evolutionary breakthroughs in scientific disciplines, which give us a lot of opportunities to make great progresses in many fields. There is no doubt that the future competitions in business productivity and technologies will surely converge into the Big Data explorations. On the other hand, Big Data also arises with many challenges, such as difficulties in data capture, data storage, and data analysis and data visualization. The main objective of this paper is emphasizing the significance and relevance of Big Data in our business system, society administration and scientific research. They have purposed potential techniques to solve the problem, including cloud computing, quantum computing and biological computing [1].
IX. CONCLUSION
Big Data problems, are still a big challenge for us to purpose efficient representation, access, and analysis of shapeless or semi-structured data in the further researches. For this, to apply different classification technique, chosen a real dataset about the student‟s knowledge status about the subject of Electrical DC Machines. Distribution of every numeric variable can be checked with function summary (), which returns the minimum, maximum, mean, median, and the first (25%) and third (75%) quartiles. For factors (or categorical variables), it shows the frequency of every level.
REFERENCES
[1] C.L. Philip Chen, Chun-Yang Zhang, “Data intensive applications, challenges, techniques and technologies: A survey on Big Data” Information Science 0020-0255 (2014), PP 341-347, elsevier
[2] Han hu1At. Al. (Fellow, IEEE),” Toward Scalable Systems for Big Data Analytics: A Technology Tutorial”, IEEE 2169-3536(2014),PP 652-687
[3] Shweta Pandey, Dr.VrindaTokekar,” Prominence of MapReduce in BIG DATA Processing”, IEEE (Fourth International Conference on Communication Systems and Network Technologies)978-1-4799-3070-8/14, PP 555-560
[4] Katarina Grolinger At. Al.“Challenges for MapReduce in Big Data”, IEEE (10th World Congress on Services)978-1-4799-5069-0/14,PP 182-189
978-1-4799-0192-0/13,PP 404-409
[7] Du Zhang,” Inconsistencies in Big Data”, IEEE 978-1-4799-0783-0/13, PP 61-67
[8] ZibinZheng, Jieming Zhu, and Michael R. Lyu, “Service-generated Big Data and Big Data-as-a-Service: An Overview”, IEEE (International Congress on Big Data) 978-0-7695-5006-0/13, PP 403-410
[9] VigneshPrajapati, Big Data Analytics with R and HadoopPackt Publishing
[10] Lei Wang At. Al., “BigDataBench: aBigDataBenchmarkSuitefromInternetServices”,IEEE 978-1-4799-3097-5/14. [11] AnirudhKadadi At. Al., “Challenges of Data Integration and Interoperability in Big Data”, IEEE (International
Conference on Big Data)978-1-4799-5666-1/14, PP 38-40
[12] SAS, Five big data challenges and how to overcome them with visual analytics
[13] HajarMousanif At. Al., “From Big Data to Big Projects: a Step-by-step Roadmap”, IEEE (International Conference on Future Internet of Things and Cloud) 978-1-4799-4357-9/14, PP 373-378
[14] Tianbo Lu At. Al., “Next Big Thing in Big Data: The Security of the ICT Supply Chain”, IEEE (SocialCom/PASSAT/BigData/EconCom/BioMedCom) 978-0-7695-5137-1/13, PP 1066-1073
[15] Ganapathy Mani, NimaBarit, Duoduo Liao, Simon Berkovich, “Organization of Knowledge Extraction from Big Data Systems”, IEEE (4 Fifth International Conference on Computing for Geospatial Research and Application) 978-1-4799-4321-0/14, PP 63-69
[16] Joseph Rickert, “Big Data Analysis with Revolution R Enterprise”, 2011
[17] Carson Kai-Sang Leung, Richard Kyle MacKinnon, Fan Jiang, “Reducing the Search Space for Big Data Mining for Interesting Patterns from Uncertain Data”, IEEE 2014, PP 315-322
[18]Ajith Abraham1, Swagatam Das2, and Sandip Roy3, “Swarm Intelligence Algorithms for Data Clustering”, PP 280-313
[19] Swagatam Das, Ajith Abraham, Senior Member, IEEE, and Amit Konar, “Automatic Clustering Using an Improved Differential Evolution Algorithm”, IEEE 2008, PP 218-237
[20] KarthikKambatla, GiorgosKollias, Vipin Kumar, AnanthGrama, “J. Parallel Distrib. Comput”, Elsevier 2014, PP 2561-2573
[21] Yanchang Zhao, “R and Data Mining: Examples and Case Studies”, www.RDataMining.com,2014
[22] H. T. Kahraman, Sagiroglu, S., Colak,“User Knowledge Modeling Data Set”, UCI, vol. 37, pp. 283-295, 2013 [23] Mrigank Mridul, Akashdeep Khajuria, Snehasish Dutta, Kumar N, “Analysis of Bidgata using Apache Hadoop and
Map” , Volume 4, Issue 5, May 2014 Reduce, PP. 555-560.
[24] Sonja Pravilovic,” R language in data mining techniques and statistics”, 20130201.12,2013
[25] Vrushali Y Kulkarni,” Random Forest Classifiers :A Survey and Future Research Directions”, International Journal of Advanced Computing, ISSN:2051-0845, Vol.36, Issue.1, April 2013