Abstract
Estimates of forage use are often the basis for important management decisions (e.g., determining carrying capacity and setting stocking rates). Using both hypothetical and field data, we examine the impacts of rangeland spatial hetero- geneity and various analysis protocols on estimates of forage use. When using the paired-subplot method, we recommend that the size of caged and uncaged subplots accomodate local heterogeneity to ensure accurate forage use estimates. We further recommend that the type of analysis procedure be determined by the context of the question; phytomass differ- ences when an investigation is herbivore-focused, and relative utilization for plant community studies. All investigations of forage use should employ (field original, or untransformed) data to assess natural variability in forage production and to minimize the degree of confoundment between forage use and spatial heterogeneity. When analyzing these data, non-direc- tional, 2-tailed statistical tests are recommended, particularly in arid (and thus, spatially variable) environments, to avoid bias in the estimate and to facilitate reliable interpretation of the data.
Key Words: annual net primary productivity, grazing, her- bivory, utilization
Forage use estimates have been used to quantify the defo- liation of vegetation by domestic and wild herbivores. One popular method to assess forage removal is the paired-sub- plot method (Bonham 1989), in which above-ground net primary production (ANPP) on an area exposed to defolia- tion throughout the growing season (i.e., an uncaged sub- plot) is compared to a nearby area whereon grazing has been excluded (i.e., a caged subplot). Using this method, ANPP from the uncaged area is subtracted from that within the caged area to determine forage use. Average use data collected from several randomly-placed subplot-pairs are ultimately extrapolated to the coarser spatial scales at which management occurs (e.g., the grazing paddock or range allotment). Implicit to the paired-subplot method are
a number of important assumptions: (1) ANPP in caged and uncaged subplots is equal prior to herbivory; (2) any difference in ANPP between caged and uncaged subplots is due exclusively to the target herbivore; (3) plant growth is unaffected by herbivory or caging; and (4) the effect of spatial variability is either negligible, or compensated for via an adequate number, size, and shape of subplots.
The dangers of basing management decisions on esti- mates of forage use (e.g., Caldwell 1984, Menke 1987, Frost et al. 1994, Sharp et al. 1994) include the confound- ing role of species composition and environmental variabil- ity between caged and uncaged subplots, and temporal variation in both forage use and subsequent plant response.
As a result, field conditions may limit the validity of the aforementioned assumptions. For example, grazing of uncaged plots has been found to affect the growth rate of plants (Cook and Stoddart 1953). Cages may also accumu- late snow, provide roosts for birds that add nutrient via defecation, and alter the microclimate and microbial
J. Range Manage.
52:151–156 March 1999
Viewpoint: Implications of spatial variability for estimating forage use
EDWARD W. BORK AND SCOTT J. WERNER
At the time of manuscript preparation the authors were range science graduate students, Department of Rangeland Resources, Utah State University, Logan, Utah 84322-5230. Current address for Bork is assit. professor, Dept. of Agriculture, Food, and Nutritional Science, University of Alberta, Edmonton, Alberta, CANADA, T6G 2P5.
This research was supported by the Utah Agricultural Experiment Station, Utah State University, Logan, Utah 84322-4810. Approved as journal paper no. 5090.
Manuscript accepted 24 May 1998.
Resumen
Las estimaciones del uso de forraje a menudo son la base de importantes decisiones de manejo (por ejemplo, determi- nar la capacidad de carga y fijar la carga animal). Mediante el uso de datos de campo e hipotéticos determinamos los impactos de la heterogeneidad espacial del pastizal y de var- ios protocolos de análisis en las estimaciones del uso de forra- je. Cuando se utiliza el método de subparcelas apareadas recomendamos que el tamaño de las parcelas protegidas y sin proteger cubran la heterogeneidad local para asegurar esti- maciones precisas del uso de forraje. Además, recomendamos que el tipo de análisis sea determinado por el contexto del la pregunta: diferencias de fitomasa cuando la investigación es enfocada a herbivoría y utilización relativa para estudios de comunidades de plantas.Todas las investigaciones del uso de fiorraje deben emplear datos de campo (originales o sin transformar) para evaluar la variabilidad natural en la pro- ducción de forraje y la heterogeneidad espacial. Cuando se analicen estos datos se recomienda las pruebas estadísticas no direccionales y de dos colas, particularmente en ambientes áridos (especialmente variables) para evitar sesgo en la esti- mación y proveer una interpretación confiable de los datos.
growth forms present, thus altering plant growth.
The problem of environmental het- erogeneity is of particular concern because plant communities are natu- rally variable in space (Greig-Smith 1979, Legendre and Fortin 1989), pri- marily due to differences in physical site characteristics and/or disturbance history (Collins 1987, 1989). This het- erogeneity is exacerbated by competi- tive interactions among plants and subsequent plant-environment feed- back over time (Greig-Smith 1979).
Moreover, treatment effects associated with field studies within spatially-het- erogeneous areas are frequently obscured by spatial variation among treatment replicates (Gurevitch and Collins 1994).
The arid and semiard rangelands common throughout the western United States may be particularly sus- ceptible to spatial variability in ANPP because soil and water are highly lim- iting and susceptible to local redistrib- ution. Furthermore, the level of forage removed by herbivores is typically great relative to overall levels of ANPP. As a result, forage use in these areas can be reliably determined only if the effects of spatial variability are ojbectively incorporated into the esti- mate. Thus, we recommend that the size of caged and uncaged subplots accomodate local heterogeneity when using the paired-subplot method to estimate forage use.
Our objective is to discuss the effects of spatial variability on forage use, particularly when assuming that caged ANPP will exceed uncaged ANPP. We first illustrate how spatial variability affects estimates of forage use by using a simplified, hypothetical data set. We then examine these effects on empiricial data from a study in central Utah intended to evaluate forage use by elk (Cervus elaphus) within units rested from cattle grazing. Using this study, we identify the potential prob- lems that spatial variability and various analysis procedures may have on esti- mates of forage use and subsequent management decisions.
Forage use data are usually analyzed and presented either as the difference between caged and uncaged ANPP, or
in a form relativized to available for- age (e.g., [{caged-uncaged}/caged] x 100). The applicability and value of each calculation technique are objec- tive-dependent. Therefore, we also present the advantages and disadvan- tages of using either technique to esti- mate forage use, as well as the range- land management contexts wherein each is relevant.
The Hypothetical Data Set
Statistical variance associated with any sampling procedure has 2 sources:
the inherent variability of the popula- tion (σ) and the variability associated with the sampling distribution (σn).
“Adequate” sampling techniques theo- retically align known sampling vari- ability with unknown population vari- ability. With reference to the paired- subplot method of evaluating forage use, among-plot and within-plot (i.e., between-subplot) sampling variability (σn) is affected by the number of plots and size of subplots, respectively.
Establishment of a statistically “appro- priate” plot number and subplot size is contingent on knowledge of local vari- ability (σ among plots and between subplots) prior to data collection.
Unfortunately, this is rarely the case when pursuing original research or management-driven vegetation analy- ses. To compensate, subplots are typi- cally established within an area that
“appears to be” locally homogeneous.
Subplot placement is thus assumed to overcome local, between-subplot vari- ability. This assumption is critical to the robustness of the data set, as well as inferences regarding forage use on the entire sampling area (e.g., pasture or allotment).
Perhaps the easiest way to fully understand how the above assumption can distort estimates of forage use is to work through a series of calcula- tions using hypothetical data. This procedure enables the isolation and magnification of the effects of spatial variability (e.g., σ between subplots) on forage use estimates. Moreover, perception of these hypothetical data as a census enables control of the con- founding factors associated with sam- pling (e.g., σn), thus elucidating eco- logical (e.g., σ) and anthropogenic
(e.g., estimation technique) effects on such estimates.
Suppose we are interested in deter- mining forage use in 2 hypothetical areas. The first area is spatially homo- geneous (e.g., montane vegetation with relatively uniform moisture for plant growth), whereas the second area represents a more spatially het- erogeneous environment (e.g., sage- brush steppe). To determine the amount of forage removed during the growing season, 20 plots are (hypo- thetically) established within each area. Each plot consists of 2 paired subplots, 1 caged and 1 uncaged.
Forage use per plot can be estimated by the difference in ANPP between the caged and uncaged subplot repli- cates within each of the 20 plots.
Ultimately, these data provide the average level of forage removed with- in both the homogeneous and hetero- geneous areas.
If these hypothetical data are viewed as a census, no concern arises over the number of plots. What is of concern is the assumption regarding the elimina- tion of within-plot (i.e., between-sub- plot) variability via subplot placement.
To allow for a more concise evalua- tion of localized spatial variability, 2 additional assumptions were made in deducing our hypothetical data: (1) the actual amount of forage removed (i.e., degree of herbivory) is equivalent within the homogeneous and heteroge- neous areas; and (2) overall (popula- tion) ANPP (and subsequent ANPP differences) is equivalent in both hypothetical areas. To facilitate the ensuing discussion, the variability of ANPP differences within the homoge- neous area has been adjusted so that it is approximately one-half as variable as that within the heterogeneous area.
Variability of ANPP differences in the heterogeneous area was empirically developed to closely reflect actual field data discussed later in this paper (Werner and Urness 1998).
How Spatial Variability Affects Forage Use Estimates
Accepting the assumption that the paired subplots accurately represent the larger area around them (i.e., the population), the impact of herbivory
appears to be similar in both areas.
Subsequent management-related activ- ities such as the allocation of ANPP for soil protection or consumption by other herbivores (e.g., wildlife) may be similarly applied to each area. This would be inappropriate, however, because both the amount of ANPP and its variability must be considered to properly assess the ecological and bio- logical impacts of herbivory.
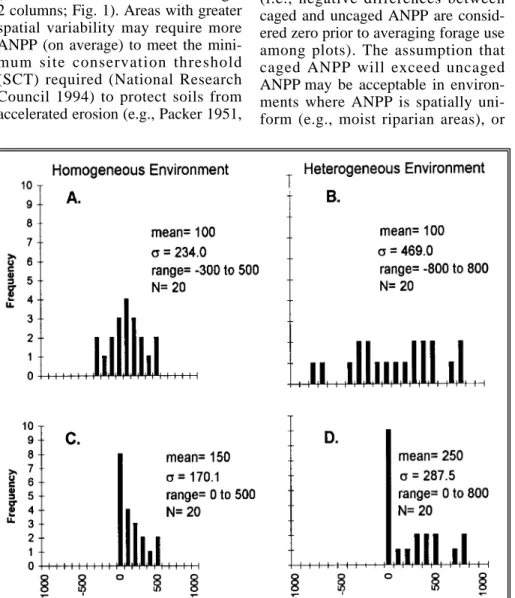
Although the average amount of ANPP removed within both areas may be the same, the spatial variability in available forage is not, as the homoge- neous area is more uniform in average caged and uncaged ANPP, as well as subsequent phytomass differences (i.e., note lower σ in left-versus-right 2 columns; Fig. 1). Areas with greater spatial variability may require more ANPP (on average) to meet the mini- mum site conservation threshold (SCT) required (National Research Council 1994) to protect soils from accelerated erosion (e.g., Packer 1951,
Marston 1952). Conversely, uniform areas may require substantially less ANPP to meet the same minimum SCT. Thus, the variability of ANPP may be equally or more important than the amount of ANPP for the reli- able estimation of forage use.
When Caged ANPP is Assumed to Exceed Uncaged ANPP
Estimates of forage use via paired subplots are frequently based on the assumption that caged ANPP must be greater than uncaged ANPP when sub- plot-pairs are placed in areas that are environmentally uniform. As a result, the minimum potential difference between subplot pairs is set to zero (i.e., negative differences between caged and uncaged ANPP are consid- ered zero prior to averaging forage use among plots). The assumption that caged ANPP will exceed uncaged ANPP may be acceptable in environ- ments where ANPP is spatially uni- form (e.g., moist riparian areas), or
where herbivory is high relative to for- age availability. Both of these condi- tions minimize the undesirabe impact of spatial variability on forage use estimates.
When we re-evaluate the hypotheti- cal data set, after setting the minimum allowable difference in ANPP between caged and uncaged subplots to zero (Fig. 1; C and D, respectively), the variation in ANPP decreases among subplot-pairs and average for- age utilization increases by 45 and 130% for the homogeneous and het- erogeneous areas, respectively (right 2 columns; Fig. 1). Clearly, zeroing has the effect of inflating estimates of for- age use, especially within the hetero- geneous environment.
When the paired-subplot method is used to estimate forage use, caged and uncaged replicates (i.e., subplot pairs) are generally placed in a uniform or
“homogeneous” location using subjec- tive (i.e., ocular) methods (Bonham 1989). However, because some het- erogeneity is inevitable prior to decid- ing which of the subplots will be caged, each subplot has an equal, a- priori probability of yielding more ANPP than the other. Thus, even with- out herbivory in the area, ANPP dif- ferences among plots (i.e., paired sub- plots) follow a normal distribution, centered at mean zero. When her- bivory is introduced, raw differences (i.e., non-zeroed distributions; Fig. 1;
A and B) continue to follow an approximate normal curve. Because the possibility clearly exists that caged ANPP may be lower than uncaged ANPP (particularly in arid environ- ments), a no a-priori assumption should be made regarding which sub- plot will yield more forage.
Moreoever, the a-priori statistical test employed to detect a difference between caged and uncaged ANPP should be unbiased (i.e., a 2-tailed or directionally-neutral test; see the fol- lowing Case Study).
When paired-subplot data are zeroed prior to the analysis, this procedure positively skews ANPP differences (see Fig. 1). As a result, mean forage use increases (i.e., shifts to the right), thereby overestimating the degree of herbivory. Heterogeneous environ-
Fig. 1. Distribution of hypothetical ANPP difference data in a homogeneous (left) and hetero- geneous (right) environment, using original (top) and zeroed (bottom) data.
ments are more prone to confound- ment when assuming that caged ANPP exceeds uncaged ANPP, because there is a greater potential for negative differences in ANPP between subplot-pairs (i.e., when uncaged exceeds caged phytomass). Conse- quently, when heterogeneity between subplots increases, the degree of con- foundment of forage-use estimates also increases (Fig. 1). When non-zeroed data are properly used, the paired-sub- plot method can be used to simultane- ously analyze the degree of herbivory and spatial heterogeneity.
Elk Forage Use on the Fishlake National Forest: A Case Study
We now examine the implications of estimating forage use with different protocols applied to an actual field data set. A study was conducted to quantify the degree of elk herbivory within paddocks rested from cattle grazing. Forage use by elk was esti- mated 2 times in each of 2 summers (June and August of 1994 and 1995) within 2 grazing units in each of 3 rest-rotation grazing allotments (N = 6 units) in south-central Utah’s Fishlake National Forest. The size of grazing units ranged from 1,300 to 2,600 ha • unit-1. The soils, plant communites, and land type associations for all 3 allotments have been described in detail by Werner (1996). Forage use was estimated using cages and the paired-subplot method (n = 20 plots per grazing unit). Averages of caged- minus-uncaged ANPP and these dif- fernces relative to forage availability (i.e., percent untilization = [{caged- uncaged}/caged] ✕ 100) were used to quantify the degree of elk herbivory within rested grazing units. Forage use sampling and estimation methodology have been described by Werner and Urness (1998).
Data Analysis
We estimated forage use via the ANPP difference and relative utiliza- tion methods using both non-zeroed and zeroed data. Zeroing was justified using the assumption that high local- ized herbivory relative to the size and shape of subplots must reduce uncaged ANPP to levels below caged ANPP. We examined the impacts of
each procedure using the data present- ed by Werner and Urness (1998).
Two-sample (i.e., caged and uncaged), unequal variance (het- eroscedastic) t-tests were used to test for differences between average ANPP inside and outside areas pro- tected from elk herbivory. These tests were used to reveal both the effects of zeroing ANPP differences and the effect of using 1-tailed versus 2-tailed (non-directional) statistical tests.
Results
Average, non-zeroed ANPP differ- ences in June ranged from –80 to 1 kg
• ha-1in 1994 and from 141 to 609 kg
• ha-1in 1995 (Table 1). August ANPP differences ranged from –128 to 68 kg
• ha-1in 1994 and from 188 to 1,074 kg • ha-1in 1995. Average, non-zeroed ANPP within caged subplots was greater (P < 0.10) than that within subplots subjected to elk herbivory in 4 of 12 comparisons using a 1-tailed test, and in 3 of 12 comparisons using a 2-tailed test (Table 2), with all sig- nificant comparisons occurring in 1995.
Average, zeroed ANPP differences in June ranged from 36 to 81 kg ha-1in 1994 and from 161 to 656 kg ha-1in 1995 (Table 1). August ANPP differ- ences ranged from 48 to 96 kg • ha-1in 1994 and from 206 to 1,075 kg • ha-1
in 1995. Average, zeroed ANPP with- in caged subplots was greater (P <
0.10) than that within subplots sub- jected to elk use in 5 of 12 compar- isons (again, all in 1995) using a 1- tailed test, and in 4 of 12 comparisons using a 2–tailed test (Table 2). Thus, zeroing increased average ANPP dif- ferences and decreased their associat- ed variability, thereby increasing the likelihood of detecting significant dif- ferences in the degree of herbivory.
When ANPP differences were rela- tivized to forage availability, average, non-zeroed utilization in June ranged from –28 to –5% in 1994 and from 3 to 36% in 1995 (Table 1). In August, non-zeroed utilization ranged from –27 to –1% in 1994 and from 16 to 42% in 1995 (Table 1). In contrast, average zeroed utilization in June ranged from 7 to 14% in 1994 and from 21 to 41% in 1995. August uti- lization of zeroed data ranged from 5 to 12% in 1994 and from 19 to 42% in 1995. Once again, zeroing increased average utilization and decreased its variability.
Discussion and Management Implications
Different analysis procedures affect- ed subsequent data interpretation.
Averages for the non-zeroed data, across all 12 grazing unit by time peri-
Table 1. ANPP differences (kg ha-1) and elk forage utilization (%) estimates using zeroed (ie., adjusted such that caged ANPP ≥uncaged ANPP) and nonzeroed data from the Beaver Creek (BC), Cove (C), Koosharem Canyon (KC), Burnt Flat (BF), Ranger Pasture (RP), and Skumpah (S) grazing units on the Fishlake National Forest, Utah (from Werner and Urness 1998).
Year Grazing Unit Month ANPP Diff. ANPP Diff. Utilization Utilization Non-zeroed Zeroed Non-zeroed Zeroed - - - (kg ha-1) - - - - - - -(%) - - - -
1994 BC June –80.0 36.3 –28.4 6.5
August –61.3 47.5 –27.4 8.4
C June 1.3 81.3 –5.1 8.5
August –127.5 50.0 –5.1 8.5
KC June –47.5 78.8 –21.2 14.2
August 67.5 96.3 –0.7 12.0
1995 BF June 141.3 161.3 14.1 21.3
August 187.5 206.3 16.0 18.6
RP June 608.8 656.3 35.6 40.6
August 518.8 527.5 34.7 35.8
S June 401.3 592.5 2.5 22.2
August 1073.8 1075.0 42.0 42.2
Average 223.7 300.8 3.4 19.6
(±σn) (±467.96) (±431.70) (±32.70) (±17.22)
od combinations, were 224 kg • ha-1 and 3%, respectively (Table 1). Raw (i.e., non-zeroed) ANPP differences are representative of actual forage removal and are therefore more infor- mative in the context of managing cohabitant herbivores (i.e., elk and cattle). In contrast, relative utilization reveals nothing about the amount of forage removed, and therefore, the
‘opportunity cost’ of lost forage to 1 herbivore or the other. Rather, utiliza- tion estimates provide an indication of the relative intensity of defoliation impacts on the plant community.
Thus, the method used to estimate for- age use should be determined by the context of the question. As a result, researchers and land managers can benefit by establishing clear objec- tives, using the appropriate type of analysis, and fully reporting the sam- pling and analysis protocol employed.
The assumption that ANPP within caged subplots must exceed that with- in uncaged subplots was not valid in this case study. Variation within the non-zeroed ANPP differences and non-zeroed utilization data (Table 1) are indicative of spatially-variable growth patterns within plots (i.e., between subplots). “Negative use”
typically resulted due to spatial het-
erogeneity within seemingly ‘homoge- nous’ sampling areas.
Spatial variability caused an overes- timation of ANPP differences and rela- tive utilization (Table 1). Average ANPP differences increased 26%
(from 224 to 301 kg • ha-1), while aver- age utilization increased nearly 5-fold (from 3 to 20%; Table 1). The use of zeroed data also affected ANPP differ- ences (Table 2). In general, the signifi- cance of caged-minus-uncaged ANPP increases when zeroed data are used, i.e., an additional comparison was found to be significant (P < 0.10).
Zeroing of data reduces among-plot variance and magnifies ANPP differ- ences between caged and uncaged sub- plots. Overestimates of forage use attributable to data zeroing could exac- erbate the ‘ecological significance’ of herbivory within the sampled area.
Compared to the montane vegetation within the Fishlake study area, many rangelands in the western U.S. (i.e., semiarid and arid regions) receive rel- atively less annual precipitation. We expect greater confoundment of forage use estimates in these lower elevation, dryer, more spatially-heterogeneous environments (e.g., sagebrush steppe) when assuming that caged ANPP always exceeds uncaged ANPP.
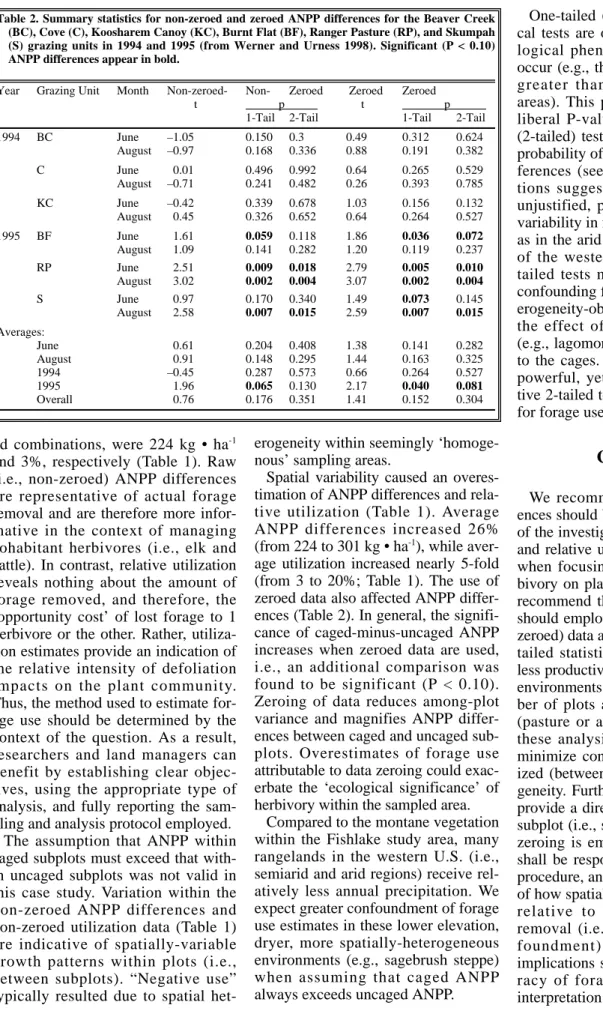
One-tailed (i.e., directional) statisti- cal tests are often used when an eco- logical phenomenon is expected to occur (e.g., that caged ANPP must be greater than that within uncaged areas). This procedure yields a more liberal P-value than non-directional (2-tailed) tests, thereby increasing the probability of detecting significant dif- ferences (see Table 2). Our observa- tions suggest that this procedure is unjustified, particularly when spatial variability in field studies is high, such as in the arid and semiarid rangelands of the western United States. Two- tailed tests may account for several confounding factors, including (1) het- erogeneity-obscured herbivory and (2) the effect of non-target herbivores (e.g., lagomorphs or rodents) attracted to the cages. Thus, a statistically less powerful, yet ecologically conserva- tive 2-tailed test may be more suitable for forage use analyses.
Conclusion
We recommend that ANPP differ- ences should be used when the context of the investigation is herbivore-based, and relative utilization should be used when focusing on the impact of her- bivory on plant communities. We also recommend that studies of forage use should employ (1) raw field (i.e., non- zeroed) data and (2) non-directional, 2- tailed statistical tests, particularly in less productive, spatialy heterogeneous environments. Assuming that the num- ber of plots accomodates large-scale (pasture or allotment) heterogeneity, these analysis procedures may help minimize confoundment due to local- ized (between subplot) spatial hetero- geneity. Furthermore, non-zeroed data provide a direct indication of between subplot (i.e., spatial) variability. When zeroing is employed, the investigator shall be responsible for reporting this procedure, and providing an indication of how spatially variable the data were relative to the degree of forage removal (i.e., the potential for con- foundment). These methods and implications should increase the accu- racy of forage use estimation and interpretation.
Table 2. Summary statistics for non-zeroed and zeroed ANPP differences for the Beaver Creek (BC), Cove (C), Koosharem Canoy (KC), Burnt Flat (BF), Ranger Pasture (RP), and Skumpah (S) grazing units in 1994 and 1995 (from Werner and Urness 1998). Significant (P < 0.10) ANPP differences appear in bold.
Year Grazing Unit Month Non-zeroed- Non- Zeroed Zeroed Zeroed t p t p
1-Tail 2-Tail 1-Tail 2-Tail
1994 BC June –1.05 0.150 0.3 0.49 0.312 0.624
August –0.97 0.168 0.336 0.88 0.191 0.382
C June 0.01 0.496 0.992 0.64 0.265 0.529
August –0.71 0.241 0.482 0.26 0.393 0.785
KC June –0.42 0.339 0.678 1.03 0.156 0.132
August 0.45 0.326 0.652 0.64 0.264 0.527
1995 BF June 1.61 0.059 0.118 1.86 0.036 0.072
August 1.09 0.141 0.282 1.20 0.119 0.237
RP June 2.51 0.009 0.018 2.79 0.005 0.010
August 3.02 0.002 0.004 3.07 0.002 0.004
S June 0.97 0.170 0.340 1.49 0.073 0.145
August 2.58 0.007 0.015 2.59 0.007 0.015
Averages:
June 0.61 0.204 0.408 1.38 0.141 0.282
August 0.91 0.148 0.295 1.44 0.163 0.325
1994 –0.45 0.287 0.573 0.66 0.264 0.527
1995 1.96 0.065 0.130 2.17 0.040 0.081
Overall 0.76 0.176 0.351 1.41 0.152 0.304
Literature Cited
Bonham, C.D. 1989. Measurements of Terrestrial Vegetation. John Wiley &
Sons, N.Y.
Caldwell, M.M. 1984. Plant requirements for prudent grazing. pp. 117–152. In:
Development Strategies for Rangeland Management, Westview Press, Boulder, Colo.
Collins, S.L. 1987. Fire frequency and community heterogeneity in tallgrass prairie vegetation. Ecol. 73:2001–2006.
Collins, S.L. 1989. Experimental analysis of patch dynamics and community het- erogeneity in tallgrass prairie. Vegetatio 85:57–66.
Cook, C.W. and L.A. Stoddart. 1953.
The quandary of utilization and prefer- ence. J. Range Manage. 6:329–335.
Frost, W.E., E.L. Smith, and P.R.
Ogden. 1994. Utilization guidelines.
Rangelands, 16:256–259.
Greig-Smith, P. 1979. Pattern in vegeta- tion. J. Ecol. 67:755–779.
Gurevitch, J. and S.L. Collins. 1994.
Experimental manipulation of natural plant communites. Trends Res. Ecol.
Evol. 9:94–98.
Legendre, P. and M.J. Fortin. 1989.
Spatial pattern and ecological analysis.
Vegetatio 80:107–138.
Marston, R.B. 1952. Ground cover requirements for storm runoff control on aspen sites in northern Utah. J. Forestry 50:303–307.
Menke, J.W. 1987. Indicators for produc- tion changes. pp. 12–16. In: Jameson, D.A. and J. Holechek (eds), Monitoring animal performance and production.
Soc. Range Manage. Symp. Proc., Boise, Ida., Feb. 12.
National Research Council. 1994.
Rangeland Health: New Methods to Classify Inventory, and Monitor Rangelands. National Acad. Press, Washington, D.C. 180 pp.
Packer, P.E. 1951. An approach to water- shed protection criteria. J. Forstry 49:639–644.
Sharp, L., K. Sanders, and N. Rimbey.
1994. Management decisions based on utilization—Is it really management.
Rangelands 16:38–40.
Werner, S.J. 1996. Elk herbivory within rested units of rest-rotation grazing sys- tems in southcentral Utah. M.S. Thesis, Dept. of Rangeland Resources, Utah State Univ., Logan, Ut.
Werner, S.J. and P.J. Urness 1998. Elk forage utilization within rested units of rest-rotation grazing systems. J. Range Manage. 51(1):14–18.