Paddock Size and Stocking Density Affect Spatial Heterogeneity of Grazing
Matthew K. Barnes, 1 Brien E. Norton, 2 Motoko Maeno, 3 and John C. Malechek 4
Authors are
1Rangeland Management Specialist, USDA Natural Resources Conservation Service, Kremmling, CO 80459, USA;
2Director, Centre for the Management of Arid Environments, PMB 22, Kalgoorlie, WA 6433, Australia, and Emeritus Associate Professor, Department of Wildland Resources,
Utah State University, Logan, UT 84322, USA;
3deceased; and
4Professor, Department of Wildland Resources, Utah State University, Logan, UT 84322, USA.
Abstract
The claim that intensive rotational grazing (IRG) can sustain higher stocking rates can be partially explained by more even spatial distribution of grazing such that livestock consume forage from a greater proportion of a pasture. To test the hypothesis that utilization is more even at the higher stocking densities of smaller paddocks, mean absolute deviation (heterogeneity) of utilization estimates by plot was compared in paddocks of sizes and stocking densities representing increasing subdivision from two-paddock deferred rotation grazing (DRG) to 16-, 32-, and 64-paddock, two-cycle IRG. These 70-, 4-, 2-, and 1-ha paddocks were grazed for 7 wk, 4 d, 2 d, and 1 d, respectively, at 32 animal unit days (AUD) ? ha 21 during 2000 and 34 AUD ? ha 21 during 2001. Within IRG there was no response to the treatment gradient. After one cycle in the IRG paddocks, heterogeneity of use was generally lower than in the DRG paddocks, in both 2000 (3–11% [outlier 18%] vs. 14–19%) and 2001 (9–17% vs. 24–28%). After a second cycle in 2001, heterogeneity in half of the IRG paddocks (17–21%) was nearly as high as the early-grazed (24%), but not the late-grazed (28%), of the DRG paddocks. This lack of a stronger difference between systems was probably due to the fixed two-cycle IRG schedule and lack of plant growth during the nongrazing interval. Across both systems heterogeneity of utilization was strongly positively correlated with paddock size. Because utilization was not severely patchy in the largest treatment, the difference between systems would likely be greater in commercial-scale paddocks. Thus grazing distribution can be more even under intensive than extensive management, but this depends on how adaptively the system, particularly the aspects of timing and frequency, is managed.
Resumen
La afirmacio´n de que el pastoreo rotacional intensivo (PRI) logra mantener una mayor carga animal se puede explicar parcialmente a que existe una distribucio´n ma´s uniforme del pastoreo de tal manera de que el ganado consume forraje de la mayorı´a del potrero. Para probar la hipo´tesis que la utilizacio´n es ma´s homoge´nea en potreros pequen˜os con una mayor densidad animal, la absoluta desviacio´n de la media (heterogeneidad) de la utilizacio´n estimada, se comparo´ en potreros de diferentes taman˜os y densidades de cargas representando un incremento en las sub-divisiones utilizando un sistema de pastoreo de rotacio´n diferida (PRD). Se utilizaron 2 potreros en el PRD y 16, 32 y 64 potreros, en el pastoreo rotacional intensivo (PRI) de 2 ciclos. Estos potreros de 70, 4, 2, y 1 hecta´rea fueron pastoreados durante 7 semanas, 4 dı´as, 2 dı´as y 1 dı´a respectivamente con 23 unidades animal-dı´as (UAD) ? ha 21 durante 2000 y 34 UAD ? ha 21 durante 2001. Dentro del PRI no se encontro´ respuesta entre tratamientos. Despue´s de un ciclo en los potreros de PRI, la heterogeneidad de uso fue generalmente menor que en los potreros del PRD, tanto en 2000 (3–11% [afuera 18%] vs. 14–19%) y en 2001 (9–17% vs. 24–28%). Despue´s del segundo ciclo en 2001, la heterogeneidad (17–21%) en la mitad de los potreros de PRI fue muy similar a la presentada al inicio del pastoreo (24%), pero diferente al final del pastoreo (28%), de los potreros del PRD. El que no se hayan encontrado diferencias entre sistemas de pastoreo fue posiblemente debido a los 2 ciclos fijos programados del PRI y a la falta de crecimiento de las plantas durante el intervalo de descanso. A trave´s de ambos sistemas, la heterogeneidad de la utilizacio´n mantuvo una estrecha y positiva correlacio´n con el taman˜o del potrero. Debido a que la utilizacio´n no fue totalmente heteroge´nea en el tratamiento con el potrero ma´s grande, las diferencias entre sistemas posiblemente podrı´an ser mayores en sistemas a escala comercial. Por lo tanto, la distribucio´n del pastoreo puede ser ma´s uniforme bajo condiciones intensivas que la que pueda darse en condiciones extensivas, pero esto depende de la adaptabilidad del sistema, en particular si los aspectos de tiempo y frecuencia se manejan adecuadamente.
Key Words: deferred rotation grazing, grazing management systems, intensive rotational grazing, livestock distribution, short duration grazing, time control grazing
INTRODUCTION
Intensive rotational grazing (IRG) has been advocated as widely applicable for restoring rangeland productivity, but some in the rangeland science community have denounced it (Holechek et al. 2000). The approach is designed to control frequency of defoliation and prevent forage from becoming overmature (Savory with Butterfield 1999), such that livestock nutrition and therefore performance presumably are not
In memory of Motoko Maeno.
This research was supported by the Utah Agricultural Experiment Station, Utah State University, Logan, UT 84322, USA. Approved as journal paper 7806.
At the time of the research, Barnes and Maeno were graduate research assistants and Norton was Associate Professor, Dept of Forest, Range, and Wildlife Sciences, Utah State University, Logan, UT, USA.
Correspondence: Matthew K. Barnes, PO Box 552, Kremmling, CO 80459, USA. Email:
[email protected]
Manuscript received 15 November 2006; manuscript accepted 29 February 2008.
Rangeland Ecol Manage 61:380–388 | July 2008
diminished (Kothmann 1980, 1984). In this paper the term IRG is used to cover all variations, whether the length of grazing and nongrazing periods is controlled by plant growth rates (time control or short duration grazing [SDG]) or is calendar-based, but does not include high-intensity–low-frequency grazing (which entails significantly heavier use and longer grazing and nongrazing periods).
Practitioners of IRG have claimed dramatic increases in livestock carrying capacity, often on the order of double the stocking rate used with continuous grazing (CG), with simultaneous improvement in rangeland resources (Savory and Parsons 1980; Cumming 1989; Earl and Jones 1996;
Bradford 1998; Savory with Butterfield 1999; Sayre 2000;
Gordon 2002). However, most reviews of grazing studies have concluded that IRG is no better than traditional extensive grazing management, and sometimes worse for livestock production (Gammon 1978; Pieper 1980; Heitschmidt and Taylor 1991; Holechek et al. 2000; Vallentine 2001; Briske et al. 2008). A few researchers have concluded that a slightly higher long-term stocking rate can be sustained under IRG than extensive management (Gammon 1984; Wilson 1986; Heit- schmidt et al. 1987; Bryant et al. 1989; Joseph et al. 2002), but probably not enough of an increase to justify costs. Currently, some in the research community see little benefit from more complex approaches than CG and conservative stocking (Holechek et al. 1999, 2000; Galt et al. 2000). The evidence in favor of IRG is largely anecdotal, and the opposing perspective is well established in the research literature and textbooks.
Norton (1998, 2003) hypothesized that the paradigm of rotational grazing to control the frequency of defoliation is limited, and that a broader framework emphasizing spatial distribution is necessary. Grazing distribution is heterogeneous, especially in large paddocks on extensively managed arid, semiarid, and mountainous rangelands (Coughenour 1991;
Bailey et al. 1996). Previously grazed plants are likely to be grazed again as the growing season progresses (O’Connor 1992), and areas grazed in previous years are more heavily grazed in subsequent years (Ganskopp and Bohnert 2006); this patch or spot grazing in large, extensively grazed paddocks has been identified as a mechanism of rangeland degradation even at low stocking rates (Ring et al. 1985; Willms et al. 1988; Fuls 1992). This phenomenon has been minimized in grazing studies involving unrealistically small paddocks, where no advantage to IRG was observed (Norton 1998). As evidence that paddock size influences grazing capacity, Norton’s table 1 lists nine examples from around the world where stocking rates on research stations have been sustained at 50–100% greater than the recommended rates for the localities for many years without degradation, even in CG paddocks (p. 21).
Most studies on research stations that explicitly addressed grazing distribution have reported little or no advantage to IRG over more extensive management (Kirby et al. 1986; Hacker et al. 1988; Walker et al. 1989; Burboa-Cabrera et al. 2003). Hart et al. (1989, 1993a) found that distribution was more even in 24-ha paddocks, with CG or SDG, than a 207-ha CG paddock;
and there was little difference in frequency or intensity of tiller defoliation between CG and SDG in 9- and 12-ha paddocks (Hart et al. 1993b). However, at the Jornada Experimental Range in the Chihuahuan Desert, grazing was more uniform in
a 34.7-ha, 10-paddock cell when the rotation was flexible according to growth rate and light utilization than when it was calendar-based, or than in a 33.6-ha paddock grazed season-long at lower stocking density (Anderson 1988). Bryant et al. (1989) stated that in a study near Plains, Texas, distribution was improved with IRG in relatively large paddocks (180- and 260- ha cells, each with six paddocks) such that higher stocking rates could be maintained, but noted that standing crop increased with distance from water in another SDG cell (Soltero et al. 1989) and concluded that ‘‘doubt has been cast on the theory that [SDG]
improves animal distribution’’ (p. 296).
In contrast to the above studies, Teague and Dowhower (2003) examined the ability of rotational grazing to reduce degradation caused by patch-selective grazing in large (1 800–
2 100 ha) paddocks in the rolling plains of Texas. The eight- paddock rotation increased herbaceous basal cover and decreased bare ground relative to CG. Both treatments exhibited improvement during favorable growing conditions, but the improvements were significantly greater in the rotational grazing treatment, where there was also less deterioration during drought (Teague et al. 2004). A ranch- scale study in New South Wales, Australia, found increased basal cover and improved species composition in SDG cells relative to adjacent CG paddocks after only 2 yr (Earl and Jones 1996); and in the Flooding Pampas of Argentina operations that changed from CG to SDG had increased litter, decreased bare ground, and improved species composition relative to adjacent operations still using CG (Jacobo et al.
2006).
If animal distribution can be made more even with high- density grazing, such that more forage is encountered and thus made available to livestock, patch grazing is minimized or eliminated, and selectivity is reduced, then the sustainable stocking rate will be higher under IRG management. This would explain much of the debate between researchers and practitioners. Thus, the specific objective of this study was to test the null hypothesis that the spatial distribution of utilization, as indexed by heterogeneity of variance, would be unaffected by a gradient of paddock size and stocking density, representing increasing landscape subdivision under IRG relative to more extensive grazing management.
METHODS
Study Site
The field research was done at the Utah Agricultural Experiment Station site southeast of Miner’s Peak on Cedar Mountain, at the boundary of Washington and Iron Counties, Utah, USA (lat 37u309N, long 113uW). The site is at a mean elevation of about 2 600 m, on the Kolob Terrace above the Grey Cliffs formation. Soils are classified as fine-loamy, mixed, superactive, frigid Pachic Haplustolls, 4–15% slopes (Sheckle series); and fine, smectitic, frigid Pachic Argiustolls, 0–65%
slopes (Fughes series). Precipitation averages about 760 mm, in a bimodal pattern with peaks as winter snow and late summer thunderstorms.
The vegetation is a mosaic of mountain meadows with
woodlands of quaking aspen (Populus tremuloides Michx.) and
Gambel oak (Quercus gambelii Nutt.) and patches of mountain
snowberry (Symphoricarpos oreophilus var. oreophilus Gray).
The herbaceous layer is dominated by Kentucky bluegrass (Poa pratensis L.), Letterman needlegrass (Achnatherum lettermanii [Vasey] Barkworth), slender wheatgrass (Elymus trachycaulus subsp. trachycaulus [Link] Gould ex Shinners), mountain brome (Bromus marginatus Nees ex Steud.), Arizona mulesear (Wyethia arizonica Gray), and tarweed (Madia glomerata Hook.). The vegetation was apparently converted from tall forb dominance to grass, mulesear, and tarweed dominance by a history of heavy CG by sheep (Bowns and Bagley 1986).
Native herbivores that use the area include grasshoppers (order Orthoptera), pocket gophers (Thomomys bottae Eydoux and Gervais), mule deer (Odocoileus hemionus hemionus Rafin- esque), and Rocky Mountain elk (Cervus elaphus nelsoni Bailey). The site is fenced into paddocks of about 70 ha each, which are grazed in two-paddock deferred rotations from late June through early October.
Grazing Treatments
Treatments imposed a gradient of decreasing paddock size and increasing stocking density, representing increasing landscape subdivision (Table 1). Treatments represented stocking densi- ties that would occur in 16-, 32-, and 64-paddock rotations
with two 64-d grazing cycles per 4-mo grazing season. The IRG paddock sizes were 4 ha, 2 ha, and 1 ha; these were grazed for 4 d, 2 d, and 1 d, respectively. The study was conducted during 2 yr: in 2000 each IRG paddock was grazed only once because the grazing periods were too late in the season (between 17 July and 18 August) to be followed by the second cycle, and in 2001 each was grazed twice with a 2-mo interval between grazing periods (between 29 June and 11 July, and between 30 August and 8 September). There were two paddocks of each treatment, with the exception that there were three 1-ha paddocks during the first grazing cycle in 2001. Stocking rate was held constant across all treatments within each year and was the same rate used on the rest of the site, as determined by the site manager (based on winter snowpack and a 50% utilization target): 32 animal unit days (AUD) ? ha 21 during 2000, and 34 AUD ? ha 21 during 2001. During 2000 one herd of 16 cow- calf pairs grazed each IRG paddock; thus the actual stocking densities in these treatments were 4, 8, and 16 AU ? ha 21 . During 2001 two herds of 16 cow-calf pairs and one bull were used simultaneously for IRG, with each herd grazing one paddock of each of the three treatments in both grazing periods (except when there were three 1-ha paddocks during the first cycle of 2001); stocking densities were 4.25, 8.5, and 17 AU ? ha 21 . Utilization in a pair of deferred rotation grazing Table 1. Amount and heterogeneity of forage and utilization in paddocks representing a gradient of two-cycle intensive rotational grazing (IRG) intensity and in deferred rotation grazing (DRG) paddocks during two grazing seasons. Data for IRG in 2000 and the first cycle in 2001 are for half of a season, while data for the second cycle in 2001 and DRG are for a full season of use.
Grazing system
Size (ha)
Stocking density ratio
1Paddock
identifier Start date End date
Available forage Utilization
n Mean
2Heterogeneity
2,3n Mean
2Heterogeneity
2,3Summer 2000 --- (g ? m
22)--- --- (%) ---
IRG (cycle 1) 1 64 A 17 July 18 July 18 160 a 61 ab 97 13 de 8 d
B 17 Aug. 18 Aug. 25 99 bc 21 b 89 23 b 18 a
2 32 A 18 July 20 July 25 110 ab 23 b 189 12 e 5 e
B 15 Aug. 17 Aug. 25 73 d 28 b 189 17 bcd 11 c
4 16 A 28 July 1 Aug. 25 77 cd 100 a 375 11 e 3 e
B 1 Aug. 5 Aug. 25 82 cd 28 b 384 16 cd 10 cd
DRG 70 2 A 12 June 9 Aug. — — — 276 21 bc 19 a
B 9 Aug. 12 Oct. — — — 256 56 a 14 b
Summer 2001
IRG (cycle 1) 1 64 B 29 June 30 June 20 110 ab 46 ab 89 17 cd 14 c
C 3 July 4 July 20 73 b 35 ab 90 20 cd 17 c
A 6 July 7 July 20 130 a 8 c 96 16 cd 13 cd
2 32 B 27 June 29 June 20 130 a 7 c 185 20 c 15 c
A 9 July 11 July 20 110 ab 24 bc 186 14 d 9 d
4 16 B 29 June 3 July 20 110 ab 50 a 387 20 c 17 c
A 2 July 6 July 20 100 ab 46 ab 375 17 cd 14 c
DRG 70 2 B 15 June 9 Aug. — — — 248 30 bC 24 bB
A 9 Aug. 14 Oct. — — — 199 41 aAB 28 aA
IRG (cycle 2) 1 64 C 5 Sep. 6 Sep. 20 47 b 13 b 90 42 A 19 CD
A 5 Sep. 6 Sep. 20 100 a 55 a 96 31 BC 21 BC
2 32 B 30 Aug. 1 Sep. 20 65 ab 14 b 185 34 ABC 17 D
A 6 Sep. 8 Sep. 20 85 ab 69 a 186 36 ABC 21 BC
4 16 B 1 Sep. 5 Sep. 20 67 ab 25 b 386 40 AB 20 CD
A 1 Sep. 5 Sep. 20 51 ab 23 b 375 38 AB 21 BC
1
Stocking density ? stocking rate
21, or the number of paddocks in the rotation if paddock sizes are equal.
2
Within columns and grazing cycles, including DRG, means followed by the same letter are not significantly different (P , 0.05); uppercase letters compare DRG and cycle 2 IRG.
3
Mean absolute value of deviations of quadrat estimates from their paddock means.
(DRG) paddocks (each grazed for half of each season) was also sampled each year. The number of animals in these paddocks was double that of the IRG paddocks to maintain the same stocking rate; the stocking density was 0.46 AU ? ha 21 in 2000 and 0.49 AU ? ha 21 in 2001.
IRG paddocks were constructed with steel corner posts and temporary electric fencing (8 kV tape). Layout and initial construction of six paddocks were done in 2000, and corner posts were left in place so that the same paddocks could be used in 2001. However, one of the 1-ha paddocks (B) could not be used during the second cycle in 2001 (because of conflict with other uses of the site), so another 1-ha paddock (C) was established and then used in both cycles. The IRG paddocks were located so as to contain as similar vegetation as possible, in rolling topography, and to avoid deep gullies or large patches of Arizona mulesear that contained little or no grass. A water trough and trace mineralized salt block were located together near the fence on one side of each IRG paddock. Deferred rotation paddocks necessarily contained more topographic variation due to their size, and had stock ponds in drainage bottoms and salt blocks placed on uplands.
The cows had grazed the area during previous years and thus were familiar with the study area. Most of the cows used in 2000 remained in the herd in 2001. The cattle used in the IRG trials were acclimated to the study area for about 1 wk and were kept in a 2-ha training area where they were familiarized with small paddock size, high stocking density, and the electric fence for 2 d prior to the first trial in each year. Cattle spent the rest of the year on Great Basin desert rangeland or farmland;
calves were born off-site in the spring, and weaned and sold in the fall. Breeds included Hereford and crosses of Hereford, Angus, Charolais, and Simmental.
Data Collection
All aboveground herbaceous plant biomass and shrub foliage below 50 cm from ground level was considered available and was measured in each IRG paddock, , 24 h prior to each grazing period, by the weight-estimate method (Pechanec and Pickford 1937b) using 0.25-m 2 quadrats at 18–25 points on randomly located line transects. Growth during the short grazing periods of IRG was negligible and very unlikely to affect grazing distribution, in contrast to the much longer grazing periods of DRG.
Distribution of grazing, as the response variable of interest, was measured more intensively than available forage (which was measured only in IRG paddocks). It was assessed after each grazing period by systematic sampling of forage utilization on a 10 3 10 m grid covering each IRG paddock, and a 60 3 60 m grid covering each DRG paddock. Grids were anchored to a paddock corner, with gridlines perpendicular to the longest fence line. Distances between gridlines were measured and marked along fenced perimeters, while distances between gridpoints in the interiors of paddocks were paced; thus paddock coverage of samples was similar for each assessment, but relocation of quadrats in successive periods was approx- imate. Utilization was assessed by ocular estimate in a 0.25-m 2 quadrat at each gridpoint in the IRG paddocks and in a 1-m 2 quadrat at each gridpoint in the DRG paddocks, the larger quadrat intended to offset the reduction of sampling intensity
due to the coarser grid. Use was assigned to one of five classes:
unused, , 20%, 20–40%, 40–60%, and 60–80%. During 2001 the method was refined by correcting utilization estimates for observer bias with estimates of clipped and weighed plots (Pechanec and Pickford 1937a).
Data Analysis
Because of differences in initial species composition (Maeno 2002), time of season when grazed, and forage availability, paddocks of the same size and stocking density were unsuitable as replicates and thus were analyzed separately. Quadrats served as the experimental units; that is, means were calculated for each paddock, rather than across paddocks of the same grazing treatment, increasing the sample sizes and degrees of freedom. Consequently the inference space is limited to the paddocks in this study.
The mean absolute deviation (the mean of the absolute values of the deviations of the quadrat estimates from their paddock means, and the variance metric in Levene’s test for homogeneity of variance) is an index of spatial heterogeneity.
To assess relative initial uniformity within paddocks, hetero- geneity of variance in available forage was analyzed for each grazing cycle with Levene’s test; Tukey’s studentized range test was used for pairwise comparisons of paddock variances using PROC GLM of SAS (1999). Available forage means were analyzed for differences among the IRG paddocks using an analysis of variance of a one-way factorial in a completely randomized design, with a heterogeneous variances model, such that a separate variance was estimated for each paddock.
Computations were done using PROC MIXED of SAS (1999) and pairwise mean comparisons were Tukey–Kramer adjusted.
All utilization estimates were converted to the midpoint of the recorded class (0, 0.1, 0.3, 0.5, or 0.7) for analysis.
Correction factors for observer bias in 2001 were small (0.90–
1.16). Intensity and heterogeneity of utilization were analyzed with the same statistical methods as used for available forage.
Because quadrat estimates were the experimental units, and there were 89–387 in each paddock, the degrees of freedom were 1 757–1 846 for each grazing cycle.
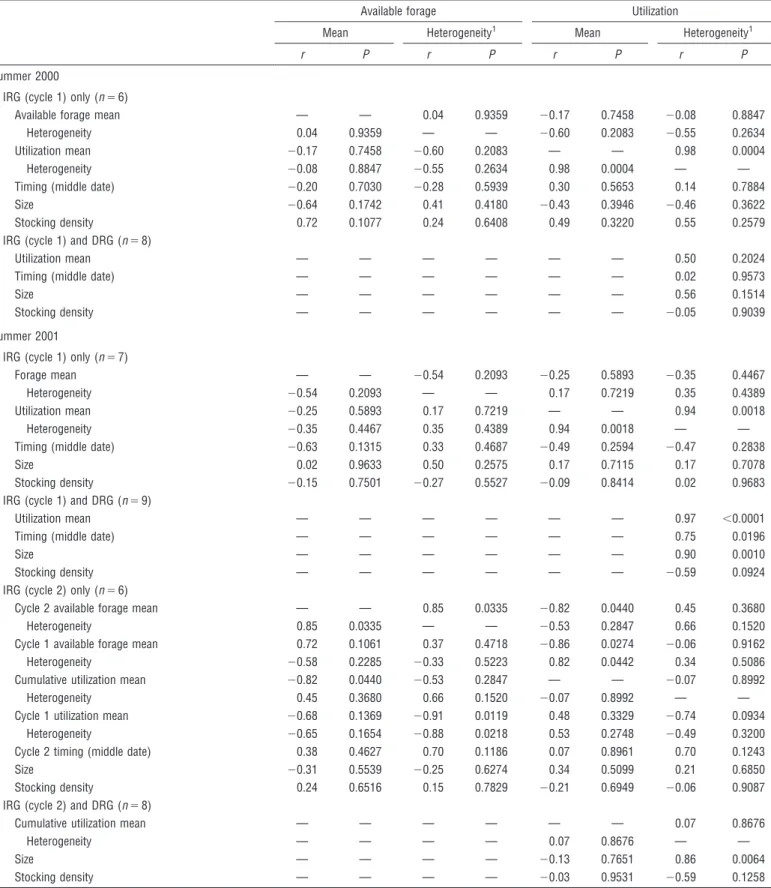
Pearson’s correlation coefficients were calculated to assess relative importance of potential explanatory variables for amount and heterogeneity of available forage and utilization (Table 2). For IRG paddocks, means and mean absolute deviations of available forage and utilization were analyzed for correlation with each other and with timing (the middle day of each grazing period, counted from the first day of the grazing season), as well as paddock size and stocking density. The same correlations were done including both IRG and DRG, only without the forage availability variables or first cycle IRG mean utilization, because it was not comparable to that in the DRG paddocks.
RESULTS
Summer 2000
There were significant differences between the six IRG paddocks in amounts of initial forage available (Table 1; F 5,137
5 3.50, P 5 0.0052) and heterogeneity thereof (F 5,137 5 7.86,
P , 0.0001). There were also significant differences between
Table 2. Correlation coefficients and probability levels for amount and heterogeneity of forage and utilization in paddocks representing a gradient of two-cycle intensive rotational grazing (IRG) intensity and for heterogeneity of utilization including deferred rotation grazing (DRG) paddocks during two grazing seasons. Data for IRG in 2000 and the first cycle in 2001 are for half of a season, while data for the second cycle in 2001 and DRG are for a full season of use.
Available forage Utilization
Mean Heterogeneity
1Mean Heterogeneity
1r P r P r P r P
Summer 2000
IRG (cycle 1) only (n 5 6)
Available forage mean — — 0.04 0.9359 20.17 0.7458 20.08 0.8847
Heterogeneity 0.04 0.9359 — — 20.60 0.2083 20.55 0.2634
Utilization mean 20.17 0.7458 20.60 0.2083 — — 0.98 0.0004
Heterogeneity 20.08 0.8847 20.55 0.2634 0.98 0.0004 — —
Timing (middle date) 20.20 0.7030 20.28 0.5939 0.30 0.5653 0.14 0.7884
Size 20.64 0.1742 0.41 0.4180 20.43 0.3946 20.46 0.3622
Stocking density 0.72 0.1077 0.24 0.6408 0.49 0.3220 0.55 0.2579
IRG (cycle 1) and DRG (n 5 8)
Utilization mean — — — — — — 0.50 0.2024
Timing (middle date) — — — — — — 0.02 0.9573
Size — — — — — — 0.56 0.1514
Stocking density — — — — — — 20.05 0.9039
Summer 2001
IRG (cycle 1) only (n 5 7)
Forage mean — — 20.54 0.2093 20.25 0.5893 20.35 0.4467
Heterogeneity 20.54 0.2093 — — 0.17 0.7219 0.35 0.4389
Utilization mean 20.25 0.5893 0.17 0.7219 — — 0.94 0.0018
Heterogeneity 20.35 0.4467 0.35 0.4389 0.94 0.0018 — —
Timing (middle date) 20.63 0.1315 0.33 0.4687 20.49 0.2594 20.47 0.2838
Size 0.02 0.9633 0.50 0.2575 0.17 0.7115 0.17 0.7078
Stocking density 20.15 0.7501 20.27 0.5527 20.09 0.8414 0.02 0.9683
IRG (cycle 1) and DRG (n 5 9)
Utilization mean — — — — — — 0.97 ,0.0001
Timing (middle date) — — — — — — 0.75 0.0196
Size — — — — — — 0.90 0.0010
Stocking density — — — — — — 20.59 0.0924
IRG (cycle 2) only (n 5 6)
Cycle 2 available forage mean — — 0.85 0.0335 20.82 0.0440 0.45 0.3680
Heterogeneity 0.85 0.0335 — — 20.53 0.2847 0.66 0.1520
Cycle 1 available forage mean 0.72 0.1061 0.37 0.4718 20.86 0.0274 20.06 0.9162
Heterogeneity 20.58 0.2285 20.33 0.5223 0.82 0.0442 0.34 0.5086
Cumulative utilization mean 20.82 0.0440 20.53 0.2847 — — 20.07 0.8992
Heterogeneity 0.45 0.3680 0.66 0.1520 20.07 0.8992 — —
Cycle 1 utilization mean 20.68 0.1369 20.91 0.0119 0.48 0.3329 20.74 0.0934
Heterogeneity 20.65 0.1654 20.88 0.0218 0.53 0.2748 20.49 0.3200
Cycle 2 timing (middle date) 0.38 0.4627 0.70 0.1186 0.07 0.8961 0.70 0.1243
Size 20.31 0.5539 20.25 0.6274 0.34 0.5099 0.21 0.6850
Stocking density 0.24 0.6516 0.15 0.7829 20.21 0.6949 20.06 0.9087
IRG (cycle 2) and DRG (n 5 8)
Cumulative utilization mean — — — — — — 0.07 0.8676
Heterogeneity — — — — 0.07 0.8676 — —
Size — — — — 20.13 0.7651 0.86 0.0064
Stocking density — — — — 20.03 0.9531 20.59 0.1258
1