warwick.ac.uk/lib-publications
Original citation:
Rajan, Ashwin T., McGordon, Andrew and Jennings, P. A. (Paul A.). (2017) Electrochemical
modelling of Li-ion battery pack with constant voltage cycling. Journal of Power Sources,
341. pp. 327-339.
Permanent WRAP URL:
http://wrap.warwick.ac.uk/84426
Copyright and reuse:
The Warwick Research Archive Portal (WRAP) makes this work of researchers of the
University of Warwick available open access under the following conditions.
This article is made available under the Creative Commons Attribution 4.0 International
license (CC BY 4.0) and may be reused according to the conditions of the license. For more
details see: http://creativecommons.org/licenses/by/4.0/
A note on versions:
The version presented in WRAP is the published version, or, version of record, and may be
cited as it appears here.
Electrochemical modelling of Li-ion battery pack with constant
voltage cycling
T.R. Ashwin
a,b, A. McGordon
a, P.A. Jennings
a,*aWMG, University of Warwick, UK
bCentre for Scientific Computing, University of Warwick, Coventry, CV4 7AL, UK
h i g h l i g h t s
P2D model is extended to a battery pack and demonstrated with four cells.
The model integrates ageing, thermal and variable porosity prediction.
Differential ageing of the cells and resulting current imbalance can be predicted.
Thermal variations in the pack and thermally accelerated SEI growth is modelled.
Differential porousfilling can lead to current imbalance in the pack.
a r t i c l e i n f o
Article history:
Received 29 September 2016 Received in revised form 21 November 2016 Accepted 25 November 2016
Keywords:
Battery pack
Electro-chemical model Ageing analysis Variable porosity
a b s t r a c t
In a battery pack, cell-to-cell chemical variation, or the variation in operating conditions, can possibly lead to current imbalance which can accelerate pack ageing. In this paper, the Pseudo-Two-Dimensional(P2D) porous electrode model is extended to a battery pack layout, to predict the overall behaviour and the cell-to-cell variation under constant voltage charging and discharging. The algorithm used in this model offers theflexibility in extending the layout to any number of cells in a pack, which can be of different capacities, chemical characteristics and physical dimensions. The coupled electro-thermal effects such as differential cell ageing, temperature variation, porosity change and their ef-fects on the performance of the pack, can be predicted using this modelling algorithm. The pack charging voltage is found to have an impact on the performance as well as the SEI layer growth. Numerical studies are conducted by keeping the cells at different thermal conditions and the results show the necessity to increase the heat transfer coefficient to cool the pack, compared to single cell. The results show that the thermal imbalance has more impact than the change in inter-connecting resistance on the split current distribution, which accelerates the irreversible porousfilling and ageing.
©2016 The Authors. Published by Elsevier B.V. This is an open access article under the CC BY license (http://creativecommons.org/licenses/by/4.0/).
1. Introduction
The increasing popularity of portable devices and automobiles has accelerated research on energy storage devices, in particular lithium-ion batteries. The single cells can be easily assembled to a pack layout such as series, parallel or a combination of both, depending on the usage. Thus battery packs offer a clean, envi-ronmentally friendly option to store and deliver energy to meet the increasing demand; however it poses numerous problems, for
example, each cell can be affected by the behaviour of its neighbour. The behaviour of a battery pack is found to be more technically challenging than a single cell since the neighbouring cell behaviour can affect each cell.
Single cell battery modelling has been the focus for much research and a substantial improvement has been made in pre-dicting basic cell characteristics under various operating conditions
[1,2]. The capacity fade of a battery can be predicted by introducing
a continuous solvent reduction reaction[3,4]. Another important
parameter is the operating temperature of the battery. Details of an accurate distributed thermal model can be found in Cai and White
[5]and Ye et al.[6].
There are different methods of extending the single cell model to pack layout. Researchers use Equivalent Circuit Models (ECM) or
*Corresponding author.
E-mail addresses: [email protected] (T.R. Ashwin), A.McGordon@ warwick.ac.uk(A. McGordon),[email protected](P.A. Jennings).
Contents lists available atScienceDirect
Journal of Power Sources
j o u r n a l h o m e p a g e : w w w . e l s e v i e r . c o m/ l o ca t e / j p o w s o u r
http://dx.doi.org/10.1016/j.jpowsour.2016.11.092
Electro-Chemical based Models (EChM) to simulate a pack behav-iour from a single cell. Again, the modelling approach is divided
into two categories. Thefirst approach in battery pack modelling is
to build a single battery pack model for the entire circuit therefore neglecting the internal current distribution under the assumption of homogeneity. A pack modelling approach based on this method assumes that all cells are perfectly balanced and uniformly cooled so that an isotropic assumption can be applied to all cells which may not be the case in reality. Important examples can be found in
Dubarry et al.[7]and Kim et al.[8]. All the above reported
exper-iments and modelling were heavily dominated by the assumption of homogeneity which neglects the real world variation.
The second widely accepted method, and also used in this paper, is to solve each cell independently and integrate the cell responses for a particular layout. This modelling approach offers a high degree
of fidelity and flexibility in choosing the layout. Moreover the
model can easily capture cell-to-cell variation in a pack imposed due to the build-up of internal resistances and property variations. The widely accepted method is to assemble ECM based models due to their simplicity and faster computing power. A Battery Man-agement System (BMS) perspective of this modelling approach can
be seen in Sen and Kar[9]and Kroeze and Krein[10]. However the
ECM based models do not inherently represent the capacity fade and thermal variation as a result of chemical (side) reactions; this can be included based on experimental data-driven results.
The electro-chemical extension of the single cell model to a pack layout is considered to be highly accurate because these models can capture the complex non-linear chemical reactions inside the anode and cathode and therefore accurately calculate the ageing and temperature variation inside a battery pack. High computing power requirement was one of the main reasons preventing re-searchers from using electro-chemical-based pack models.
How-ever in recent years there have been significant improvements in
computing resources and the computational methods, especially in
reduced order models[11,12]which can be possibly extended to a
battery pack model.
The simplest electro-chemical model is the Single Particle model (SP) which has only a single particle in the anode and
cathode. The work by Kenney et al.[13]extended the SP
electro-chemical model for a pack of batteries connected in series.
Though this model was thefirst attempt in extending the EChM
model for a battery pack, the numerical accuracy was questioned
due to the single particle approximation[14]. Important thermal
models for a battery pack can be found in Sun et al.[15], Severino
et al. [16], and Mills and Hallaj [17]. However these models are
either without the important factors such as ageing and porosity variation, or the cells are considered as a heat generating object without any electro-chemistry. The Pseudo Two Dimensional (P2D) model is an extension of the SP model over a rigorous porous
layout. P2D model assumes that the electrodes arefilled with
ho-mogeneous solid particles of uniform dimension. The solid con-centration is solved over the radial coordinates at a particular cartesian location over time, giving a pseudo two dimensional de-pendency for the model; thus the name Pseudo Two Dimensional
Model. One of the more significant and recent work is by Wu et al.
[18]who extended the P2D model for a battery pack with
inter-connected resistance with a lumped thermal model, however the impact of differential cell heating and internal resistance on the capacity fading was not modelled.
From the literature, and also to the best of author's knowledge, there are no investigations on extending a rigorous P2D model for a pack layout, with any of coupled ageing, distributed thermal and porosity variation. The model described here achieves all three of
the above. Though not addressed in this paper; the porousfilling
can be correlated to the possible stress development in the cells in a
battery pack leading to the expansion of cells in use[19]. Unlike the single cell operation, cell-to-cell variation always exists in a pack due to manufacturing differences. Operating conditions can also change the internal resistance of the individual cells in the pack. The manufacturing variation and the Solid Electrolyte Interphase (SEI) growth can cause an imbalance in the cell-to-cell split current, depending on the pack layout. Thus, an ideal pack model should be capable of accounting for the manufacturing variations and oper-ating conditions. This can also cause differential thermal heoper-ating
which can accelerate the differential porousfilling and possibly
lead to differential internal stress development and hence differ-ential cell behaviour. A distributed thermal model is needed to analyse thermal variations precisely. Coupling of the electro-chemical-thermal model with an ageing model is found to be important in capturing the impact of operating conditions on pack
life[20]. The present paper proposes a solution for all the above
mentioned problems and incorporates the required capabilities under a strong and fast numerical scheme.
A P2D model combining ageing, distributed thermal and vari-able porosity and solved using an implicit scheme is presented in
Ashwin et al.[21]. The work presented in this paper is an extension
of the single cellfinite volume based model developed for LiCoO2
chemistry. The electrochemical parameters for this model are taken
from Smith and Wang[2], ageing parameters from Ramadass et al.
[3], thermal model from Cai and White[5]and the variable porosity
from Sikha[22]. A general pack configuration and the cell balancing
equations have been adapted from Wu et al.[18]to calculate the
currentflow to each individual cell by solving Kirchhoff's law.
The model integrates for the first time; the capacity fading
solvent reduction reaction, thermal heat generation and the porosity change due to intercalation reaction for a pack layout with
a constant voltage charging configuration. The pack is cycled
be-tween two voltage limits, upper pack voltage and lower pack voltage, with a constant voltage input. Unlike constant current charging, the constant voltage charging results in a time varying
current profile. The modelling is done with diverse operating
conditions and conclusions are made on the individual cell char-acteristics including the ageing and thermal signature of each cell in the pack.
A novel approach has been adopted for modelling the cell resistance, which is a key parameter in deciding the split current distribution, where the total cell resistance has a contribution from the internal resistance and also the internal resistance due to the SEI. The internal resistance of the cell is taken as a function of State of Charge (SoC) and temperature. Kirchoff's current and voltage
balance is modified to include the additional internal resistance
due to SEI growth. The formulation adopted in this paper can be extended to any number of cells in the same layout, making it easier to analyse a bigger pack. The chemical variables in this model are temperature corrected using an Arrhenius equation. The convective heat transfer coefficient can be set to different values to replicate different thermal operating conditions with forced convection and natural convection. The model is also able to investigate the effect
of irreversible porous filling due to the solvent reduction side
reaction.
The paper is structured as follows: Section2presents the
bat-tery pack layout. Governing equations for the pack layout are listed
in Section3while the solution methodology and the algorithm is
listed in Section4. Modelling results are presented in Section5,
followed by a detailed discussion in Section6and conclusion in
Section7.
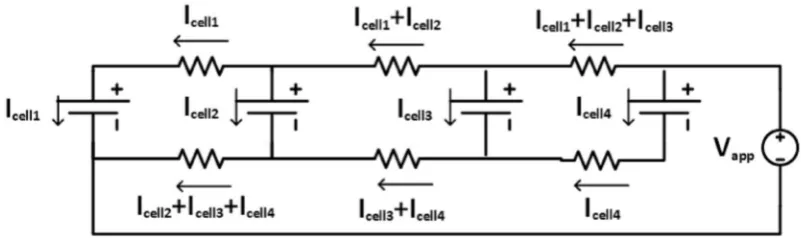
2. Battery pack layout
neither series nor parallel. This layout is adapted from Wu et al.[18]
and reformulated for a 4 cell pack configuration with LiyCoO2
chemistry. The particular configuration is selected to distribute the charging and discharging voltage equally in all branches which in-turn can control the split current. This same modelling layout can be extended to any number of cells, however the cell number is limited to four for simplicity in this manuscript. This layout is with equal inter-connecting resistance but it can be varied depending on
the usage with minor modification in the Kirchoff's current balance.
With zero inter-connecting resistance, the pack reduces to a par-allel configuration with equal distribution of split current. The safe upper cut off voltage and lower cut off voltage of the individual cells assembled in this pack is chosen as 3.89 V and 3.32 V respectively
[2]. The charging and discharging voltage of the pack is different
from the individual cell voltages. Thus the Pack Charging Voltage (PCV) and the Pack Discharging Voltage (PDV) are kept at 4.2 V and 3.3 V to completely charge or discharge individual batteries. The applied pack voltage is changed from PCV to PDV, once any of the individual cells reaches the cell cut-off limit, i.e. 3.89 V. Similarly, the cut off voltage will be reversed from PDV to PCV if any one of the cells in the pack reaches the lower cut-off limit of that cell, i.e. 3.32 V. The pack is thus cycled between the voltage limits depending on the individual cells reaching the cut off limits. Section
5.1in this work describes a sensitivity study conducted to study the
variation of charging current with pack upper cut off voltage. The voltage difference between the cells and the pack is necessary to push energy into and out of the cell. Results show that keeping the pack charging voltage equal to the upper limit of Open Circuit
Voltage (OCV) of the cell can result in infinite time for charging.
Similarly keeping the pack discharge voltage equal to the lower
limit of OCV can result in infinite time for discharging. Thus the
threshold voltage selection is critical in charging or discharging of individual cells connected in the pack.
3. Governing equations
The governing equations for a Newman model are already listed
in the previous publication by Ashwin et al.[21]. The capacity
fading and variable porosity can be included as follows: The solvent reduction reaction is given by:
Js¼ aniose
ac Fhs RT
(1)
The rate of SEI layer increase over a particular cycle is propor-tional to the solvent reduction reaction current density.
v
vt
d
film¼ JsMSEI anr
SEIF(2)
The battery is assumed to start with the initial
U
SEIresistance.Thus,
U
SEIis considered only in thefirst cycle. The total resistance ofthe SEI layer is calculated by dividing the thickness of SEI layer with conductivity[3].
The SEI layer resistance can be calculated as:
GfilmN¼
U
SEIN¼0þd
filmNk
SEI(3)
For each cycle the thickness and resistance keep increasing over time according to
d
filmN¼d
filmN1þd
filmðtÞ (4)The porosity variation can be taken proportional to the partial
molar concentration of the electrolyte[22].
vεe
vt ¼an;pðJ1VLiþþJsVLacÞ (5)
The interfacial surface area is given by Refs.[2,5].
an;p¼3εsðn;pÞ .
Lsðn;pÞ (6)
The energy balance for the battery heat generation is given by:
r
CpvvTt¼l
v2T
vx2þQreactþQrevþQohm (7)
whereQreactis the heat generation due to reaction inside the
bat-tery,Qrevis the reversible heat generation andQohmis the Ohmic
heat generation rate. Each term in the above equation is defined as
follows:
Qreact¼JðfsfeUÞ;
Qrev¼TJvU vT;
Qohm¼
s
effvfs
vx
þ
k
effvfe
vx
2
þ2
k
effRTF
1tþ0vlnce
vx
vfe
vx :
The total heat generated inside the battery is convected to the ambient by the Newton law of cooling.
l
vvTxx¼0¼hðTambTÞandl
vvTxx¼L¼hðTTambÞ [image:4.595.101.502.608.727.2]The applied external voltage remains the same for all closed loops (Ref.Fig. 1) considered in this pack. Kirchhoff's voltage bal-ance equation can be applied to the closed loop to relate the indi-vidual cell voltage to the pack voltage (PCV or PDV). Within the
closed loop, the voltage is summed to zero and four such loops can be identified in this pack. At steady state, the individual cell voltage can be related to the pack applied voltage and closed loop will give
four different equations which govern the currentflow through the
system.
Vapp¼OCVcell1þ
h
cell1þRcð3Icell1þ2Icell2þIcell3þ0Icell4Þ (8)Vapp¼OCVcell2þ
h
cell2þRcð2Icell1þ3Icell2þ2Icell3þIcell4Þ (9)Vapp¼OCVcell3þ
h
cell3þRcðIcell1þ2Icell2þ3Icell3þ2Icell4Þ (10)Vapp¼OCVcell4þ
h
cell4þRcð0Icell1þIcell2þ2Icell3þ3Icell4Þ (11)The above system of equations for 4 cells can be extended to a
circuit withNnumber of cells as follows
Whereiandjare the row and column number of the matrix with
NNcells.
The over potential of the battery is the product of the split current of the cell and the overall cell resistance. In this formula-tion, the cell resistance is divided into two components, the resis-tance increase of the cell due to the solvent reduction side reaction (SEI formation) and the contribution from cell internal resistance which is taken as a function of SoC and operating temperature. Applying the above approximation to the system of equations:
The internal resistance of each cell is averaged and taken as the resistance of the pack at a particular time step. Thus over a time step, the resistance of a cellRcellcan be approximated to a constant
value. The resistance of each cell due to build-up of SEI layer
thickness is calculated from Equation(3).
Rearranging the contribution from SEI layer:
Rcell 2 4Icell«1
IcellN
3 5þ
2
4N1 j« ijj /1 N1 j« iNj
N1 jNjj / N1 jNNj
3 5 2 4Icell1
«
IcellN
3 5Rc
¼
2
4VappOCVcell1Icell1RSEI1
«
VappOCVcellNIcellNRSEIN
3 5
(15)
Rearranging the system of equations:
2 6 6 4
Icell1 «
IcellN
3 7 7 5 2 6 6 6 6 6 6 6 4
ðN1 jijjÞ Rc
Rcellþ1 / ðN1 jiNjÞ
« 1 «
ðN1 jNjjÞ / ðN1 jNNjÞ Rc Rcellþ1
3 7 7 7 7 7 7 7 5 ¼ 1 Rcell 2 6 6 4
VappOCVcell1Icell1RSEI1
«
VappOCVcellNIcellNRSEIN
3 7 7 5
(16)
Thus the governing equations can be concised into the matrix form [X]¼[B] [A]1where A is the operator matrix, X is the current vector and B is the applied voltage matrix.
2 4Icell«1
IcellN
3 5¼ 1
Rcell 2
4VappOCVcell1Icell1RSEI1
«
VappOCVcellNIcellNRSEIN
3 5 2
4
b
1«;1 /1b
1«;Nb
N;1 /b
N;N3 5 (17) 2 6 4 Vapp « Vapp 3 7 5¼ 2 6 4
OCVcell1þ
h
cell1 «OCVcellNþ
h
cellN3 7 5þ 2 6 4
N1 jijj / N1 jiNj
« 1 «
N1 jNjj / N1 jNNj
3 7 5 2 6 4
Icell1
«
IcellN
3 7
5Rc (12)
2 6 4
OCVcell1þIcell1
RSEI1þRcell1
«
OCVcellNþIcellN
RSEINþRcellN
3 7 5þ 2 6 4
N1 jijj / N1 jiNj
« 1 «
N1 jNjj / N1 jNNj
3 7 5 2 6 4
Icell1 «
IcellN
3 7 5Rc¼
2 6 4 Vapp « Vapp 3 7 5 (13) Rcell 2 6 4
Icell1
«
IcellN
3 7 5þ 2 6 4
Icell1RSEI1
«
IcellNRSEIN
3 7 5þ 2 6 4
N1 jijj / N1 jiNj
« 1 «
N1 jNjj / N1 jNNj
3 7 5 2 6 4
Icell1
«
IcellN
3 7 5Rc¼
2 6 4
VappOCVcell1
«
VappOCVcellN
3 7
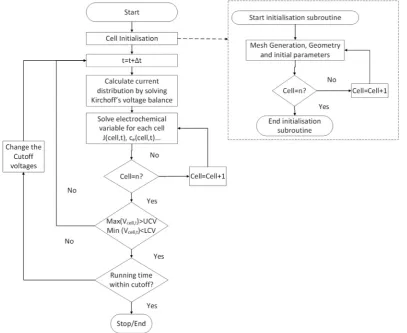
4. Algorithmflow chart
The governing equations for electrolyte concentration, solid potential and electrolyte potential are solved at the nodal point corresponding to the centre of the control volume; the solid con-centration is solved at radial nodes at each cartesian nodal point. The equations are solved in sequence, coupled with Butler-Volmer kinetics. The equations are iterated in a coupled way until the
re-sidual error reduces below a threshold value. Details of thefinite
volume method can be seen in Patankar[23]and its application in
Ashwin et al.[24]. An in-house Fortran program was developed to
solve the coupled governing equations using a finite volume
method. The program has been validated against the publications
of Smith and Wang[2], Ramadass et al.[3]and Cai and White[5];
more details of the validation study can be found in Ashwin et al.
[21]. The individual cell behaviour is again validated with a similar
pack layout proposed by Wu et al.[18]to ensure the accuracy of the
prediction. The split current variation is following the trend while the thermal behaviour cannot be compared directly since Wu et al.
[18]was using a lumped thermal model whereas the present model
uses a discrete thermal model for better accuracy. The properties of
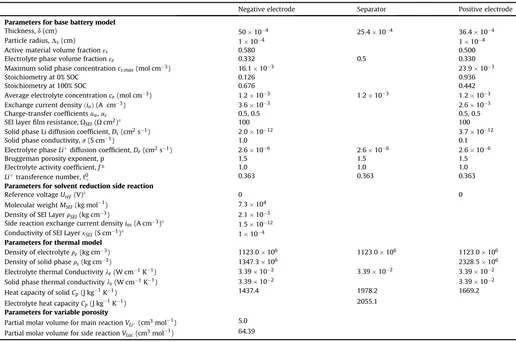
the battery used are listed inTable 1. The same formulation is
adopted in this pack layout using the algorithm presented inFig. 2.
The cell initialisation subroutine defines the grid generation and initialises the chemical parameters of each individual cell in the pack. The difference in cell chemistry, solvent reduction side
reaction parameters and the initial SEI thickness can be included in this subroutine. Many of the practical issues, for example pre-lithiation can be captured by increasing the initial solid concen-tration. Differentially aged cells can be modelled by setting different initial SEI resistances which increases the internal resis-tance of the relevant cells in the pack. The grid generation sub-routine has theflexibility to vary the size and capacity of each cell. Also this grid layout allows the mesh density to be varied at loca-tions where the gradient of chemical change is large allowing a non-uniform mesh. The current distribution to each cell at a particular time step is calculated by solving Kirchoff's network law
for the circuit shown inFig. 1. The governing equations applied to
the closed loop are solved to calculate the split current to each cell in the pack. Fortran in-built matrices operation can be used to invert and solve the system of matrix. The split current for each cell is calculated at the beginning of each time step and used as the charging or discharging current for each cell at a particular time step. Each individual cell in the battery is started with 0% SoC condition and the pack is cycled according to the guidelines pre-sented in the previous section. The cut off condition ensures the safe operation of the individual cells by reversing the voltage if any one of the cell reaches the cut off limit thereby avoiding overcharge or over discharge. The running time of the model is monitored, or
theflux imbalance is checked, for the exit condition. An accuracy of
[image:6.595.44.560.83.425.2]0.001 V (A) for both current and voltage is enough to give accurate results for the calculations presented in this work.
Table 1
Electro-chemical modelling parameters of 6 Ah single cell assembled in the pack.
Negative electrode Separator Positive electrode
Parameters for base battery model
Thickness,d(cm) 50104 25:4104 36:4104
Particle radius,Ls(cm) 1104 1104
Active material volume fractionεs 0.580 0.500
Electrolyte phase volume fractionεe 0.332 0.5 0.330
Maximum solid phase concentrationcs;max(mol cm3) 16:1103 23:9103
Stoichiometry at 0% SOC 0.126 0.936
Stoichiometry at 100% SOC 0.676 0.442
Average electrolyte concentrationce(mol cm3) 1:2103 1:2103 1:2103
Exchange current densityðioÞ(A cm3) 3:6103 2:6103
Charge-transfer coefficientsaa,ac 0.5, 0.5 0.5, 0.5
SEI layerfilm resistance,USEI(Ucm2)a 100 100
Solid phase Li diffusion coefficient,Ds(cm2s1) 2:01012 3:71012
Solid phase conductivity,s(S cm1) 1.0 0.1
Electrolyte phaseLiþdiffusion coefficient,De(cm2s1) 2:6106 2:6106 2:6106
Bruggeman porosity exponent, p 1.5 1.5 1.5
Electrolyte activity coefficient,f± 1.0 1.0 1.0
Liþtransference number, t0
þ 0.363 0.363 0.363
Parameters for solvent reduction side reaction
Reference voltageUref(V)a 0 0
Molecular weightMSEI(kg mol1) 7:3104
Density of SEI LayerrSEI(kg cm3) 2:1103
Side reaction exchange current densityios(A cm3)a 1:51012
Conductivity of SEI LayerkSEI(S cm1)a 1104
Parameters for thermal model
Density of electrolytere(kg cm3) 1123:0106 1123:0106 1123:0106
Density of solid phasers(kg cm3) 1347:3106 2328:5106
Electrolyte thermal Conductivityle(W cm1K1) 3:39102 3:39102 3:39102
Solid phase thermal conductivityls(W cm1K1) 3:39102 3:39102
Heat capacity of solidCp(J kg1K1) 1437.4 1978.2 1669.2
Electrolyte heat capacityCp(J kg1K1) 2055.1
Parameters for variable porosity
Partial molar volume for main reactionVLiþ(cm3mol1) 5.0
Partial molar volume for side reactionVLac(cm3mol1) 64.39
5. Results
The results are broadly divided into four sections which discuss the battery pack performance under different operating conditions. Proper care has been given to include diverse operating conditions and to analyse the effect on the battery performance. Though most of the results are coupled and interlinked; the impact of different chemical and operating conditions are studied by turning off or
turning on the corresponding governing equations. Section 5.1
discusses the variation of current and voltage in individual cells
with the change of pack charging voltage. Section5.2discusses the
porosity variation on the battery performance. Section5.3analyses
the SEI growth on individual cells in the pack and the impact on
overall pack performance. Section5.4shows the thermal influence
on the performance of the battery and the results are presented for a battery pack operating at an elevated temperature. The temper-ature variations are simulated based on the practical situations which may be encountered during operation of any pack.
5.1. Voltage and current distribution in the pack
The current distribution to the individual cells in the pack can be
altered by changing the inter-connecting resistance (Rc) connected
to the circuit. SettingRcto zero results in a parallel combination of
cells connected to a voltage source or sink thereby equally distributing the charging and discharging current in all branches.
Similarly, a non zeroRccan cause unequal current distribution to
individual cells. A parallel configuration results in equal SEI growth
and thermal characteristics as long as the chemical configuration of
the cells is identical. Thus Fig. 3 presents results for a parallel
identical pack layout and Cell1is taken as the sampling cell to plot
the results.
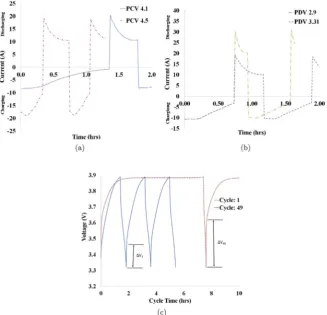
Fig. 3a shows the current distribution for thefirst few charging and discharging cycles with different PCV. The charging and dis-charging procedure used in this paper is Constant Voltage (CV)
charging and discharging by changing the Vappto PCV or PDV if any
one of the cell in the pack reaches individual cut off limit. As already mentioned, the individual cell cut off limits are 3.89 V and 3.32 V at
100% and 0% SoC respectively[2]. The individual cell discharge
profiles remain unaffected by the change in PCV whereas the
charging profile changes. Charging the pack with 4.1 V PCV takes
more than one hour while charging with 4.5 V PCV takes less than 30 min. The controlling parameter is the difference in pack charging voltage and the OCV of the individual cells. In this case, the OCVs are equal since the cells have same chemistry and are started with the same SoC. The pack charging voltage should be decided based on the upper limit of OCV (at 100% SoC) of the individual cells connected in the pack. At the limit where the PCV equals the upper
limit of OCV, the cell takes infinite time for charging. This is
otherwise represented in battery pack Equation (17) where
Iapp1Nf VappOCV1N.
SimilarlyFig. 3b shows the current distribution to the individual cells for thefirst charging and discharging cycle with different PDV.
The charging profile remains unaffected in this case whereas the
discharge profile changes shape. The limiting factor in this case is
the lower limit of OCV and the PDV. The cell takes infinite time for
[image:7.595.92.500.67.400.2]discharging if the PDV and the lower limit of OCV (at 0% SoC) are equal. Thus the pack must be charged and discharged at a voltage
above and below the OCV limit of the individual cells to charge and discharge the individual cells fully.
Fig. 3c shows the voltage profile variation after 50 constant voltage charging and discharge cycling with 4.1 V PCV and 3.31 V PDV. A solvent reduction side reaction dampens the overall current density, reducing the rate of chemical reaction which will be
re-flected in the model as the reduction in capacity. The time for
charging increases to 8 h as the SEI layer thickens, indicating that the external power source has to overcome the resistance due to SEI, to charge the battery. A clear voltage jump can be seen at the
beginning of the charge and discharge profile (after 50thcycle) once the SEI layer develops. Thus, care should be taken to avoid the operating condition where the voltage drop by the SEI layer can affect the pack charging time. A voltage increase is suggested; otherwise this could lead to extremely long time for charging and very short time for discharging due to the dominance of SEI resis-tance. Thus, the pack charging voltage is taken as 4.2 V and the
discharge voltage is 2.9 V which is sufficient to overcome the
[image:8.595.140.468.66.381.2]resistance offered by the SEI layer for the parameters considered in this study. The 4.2 V is determined by conducting a parametric
Fig. 3.Constant voltage charging profiles in Cell1withRc¼0 (a) Current profile in Cell1with pack charging voltage, 4.1 V and 4.5 V (b) Current profile in Cell1with pack discharge
[image:8.595.131.478.432.589.2]voltage, 3.31 V and 2.9 V (c) Voltage profile after 50 Cycles of operation.
study by varying PCV from 3.89 V to 4.5 V such that the pack will be able to be charged within one hour even after 50 cycles of SEI growth. The 2.9 V value is determined in a similar way to discharge the battery within one hour after 50 cycles of SEI growth. The
au-thors found that the PCV with 4.1 V is reachingflat asymptotic
voltage profile after 20 cycles of SEI build up. This indicates that a PCV adjustment is needed as the pack gets older.
5.2. Effect of porosity variation on the pack performance
Fig. 4shows the effect of variable porosity on the performance of the battery. The variable porosity has an impact on the volume
specific area available for reaction. The area change is governed
through the equationas¼3εs=Ls. The intercalation current density
in the negative electrode is taken as negative during charging in this model. The current density changes sign during discharge and
in the positive electrode. The amount of porousfilling is controlled
by the partial molar concentration of the electrolyteVLiþandVLac.
TheVLiþ of the electrolyte corresponds to the reversible porosity
variation whereasVLac represents the irreversible deposition over
the particle due to SEI formation. The ageing reaction will get activated only during the charging process and is completely absent during discharge. This gradually increases the solid volume fraction of the battery during charge-discharge cycling. The value of the molar concentration should be adjusted to match the experimental results. However, no attempt has been made in this study to match the value with actual experimental results since this work is initially a theoretical model demonstration.
Fig. 4a shows that with zero inter-connecting resistance, the porosity in Cell1and Cell2is equal after a hundred cycles. This result
indicates that the split current distribution is uniform without any imbalance, if operated with identical thermal and chemical
conditions. A dashed line is used in thefigure to separate charging
region and the discharging region for the initial cycle for both the 0 and 100 cycle. The overall cycle time decreases over time due to the build-up of SEI layer which has developed uniformly in all the cells after a hundred cycles. Another interesting observation is the range of reversible porosity change, which is maximum for a fresh cell where the porosity changes from 0.334 to 0.310. The reversible porosity change decrease from 0.329 to 0.324 after a hundred cycles which indicates that the intercalation current density is substan-tially reduced or overpowered due to the build-up of SEI layer. The decrease in electrolyte porosityεe(or the increase in solid porosity
εs) after a hundred cycles is caused by the irreversiblefilling of
pores due to SEI growth.
Other imbalances such as thermal or unequal current distribu-tion can alter this equilibrium and such a condidistribu-tion is presented in
Fig. 4b where Cell2 is kept at a higher temperature compared to
Cell1. The results show that the porousfilling in Cell2 gets
accel-erated compared to Cell1which is kept at a lower temperature. The
higher temperature accelerates the solvent reduction reaction current density thereby causing an increased SEI layer growth. Thus the irreversible porosity change due to side reaction gets acceler-ated by the change in temperature. Later in this work, the results show that temperature is more crucial than controlling the split current by changingRc.
5.3. Effect of capacity fade and SEI growth on the performance with non zero Rc
A non-zero inter-connecting resistance (Rc) can cause imbalance
in the pack current, changing the magnitude of split current to
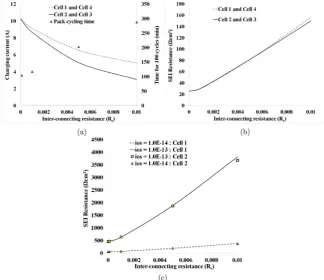
individual cells.Fig. 5shows the current distribution in the pack
[image:9.595.129.454.436.716.2]and the corresponding SEI growth. A non-zero resistance will result
in driving less current with equal magnitude in Cell2and Cell3and
higher magnitude equal current in Cell1 and Cell4. This current
imbalance can be seen in a pack with any number of cells, and here the outermost cells receive more current compared to the inner
ones. The imbalance can be changed by using differentRcvalues for
different branches. However, this model assumes that all inter-connecting resistances are equal, though this model is capable of
including unequal resistance with a slight change in the Kirchoff'S
formulation.
Fig. 5a shows the current distribution at the beginning of a charging cycle after a hundred cycles of operation. An increase in the inter-connecting resistance decreases the cell charging current where the highest charging current is observed where the cells are connected in parallel without the resistance. Similarly the cells take a longer time to complete a hundred cycle with an increased resistance since less energy is pushed into the cells per unit time. In other words, the energy supplied by the constant voltage source is dissipated at the inter-connecting resistance rather than charging the cells. This however keeps the cell temperature low thereby reducing the rate of growth of the SEI layer due to temperature. The variation of SEI resistance of the cell with inter-connecting
resis-tance after a hundred charge-discharge cycles is plotted inFig. 5b.
The change in SEI resistance is minimal with increase in inter-connecting resistance, although a slight variation can be seen at higher inter-connecting resistance. The difference in charging
current from Cell1to Cell2 is less than 2 A for the highest
inter-connecting resistance.
Fig. 5c shows the variation of SEI layer resistance with different exchange current densities for solvent reduction reaction. The cell
is started with initial resistance
U
SEI¼500U
cm2to simulate theconditions when the pack is aged. The solid lines indicate Cell1
resistance whereas the points indicate the Cell2resistance. The
cell-to-cell variation in SEI resistance is“very weak”for both exchange current densities. However a slight difference is visible for cases
with high inter-connecting resistances. As shown inFig. 5a, a high
resistance can drive more differential current into the cells result-ing in differential capacity fade. Thus it is always advised to operate this pack layout with as low an interconnecting resistance as possible so that the SEI triggered imbalance in the current will be minimised. The observed variation is not powerful enough to cause imbalance or differential ageing in the pack unless other factors supplement the ageing mechanism.
5.4. Thermal effect on the performance of the battery pack
Fig. 6shows the thermal response of the model by varying the surface heat transfer coefficient at different values for Cell1. The
pack is cycled between PCV¼4.2 V and PDV¼3.3 V and the current
variation is marked in thefigure with hexagonal dots. The ambient
temperature is kept at 298.15 K and the convective heat transfer coefficient of the pack is varied from 3 to 50 W=m2K to control the
heat transfer out of the battery. The observation is made for a
parallel configuration with zero inter-connecting resistance. The
temperature of the battery shows cyclic variation for all heat
transfer coefficient values and the cyclic variation reduces with
higher heat transfer coefficient as more thermal energy is
con-vected out. The peak temperature in the battery is observed to be 370 K which is well above the safe operating limit of the battery for
the 3 W=m2K condition. Heat transfer of at least 5 W=m2K is
needed to bring the battery temperature down to an operating limit of 330 K. This indicates that the battery cannot be operated under
natural convection where the heat transfer coefficient can be much
below this limit. The battery can be cooled to a safe limit using any of the forced convection methods such as fan cooling or turbulent aided cooling. Similar observations have been made by Cai and White[5]by varying the cell heat transfer coefficient from adiabatic to iso thermal leading to a peak temperature of 379 K and 298 K respectively. FromFig. 6, the temperature reaches its peak while the rate of change of current is at its maximum. A rapid current change always triggers rapid chemical changes inside the battery followed by a sharp increase in reaction heatQrxnand ohmic heatQohmdue to
[image:10.595.317.560.403.707.2]the change in potential gradient. The rapid current variation also results in a rapid rate of change of C-rate almost equal to 4C within
[image:10.595.47.290.537.725.2]Fig. 6.Temperature variation in the pack with change in heat transfer coefficient (h).
a shot duration. A higher C-rate results in an increased temperature and the dependency of C-rate on temperature can be found in Cai
and White [5]. We can observe that the temperature is lagging
behind the current pulse and the phase lag is dependent on the heat capacity and the thermal conductivity of the cell; the higher
the heat capacity, the larger the phase lag. Thus the temperature peaks can be observed at the beginning of charging and the switch over of current from positive to negative. The battery pack reaches 370 K with 3.0 W=m2K indicating that higher cooling is required for
the pack compared to a single cell. More details about the single cell
model can be found in Ashwin et al.[21]. The difference in
tem-perature can possibly accelerate the rate of SEI growth in the pack which will be analysed in the coming sections.
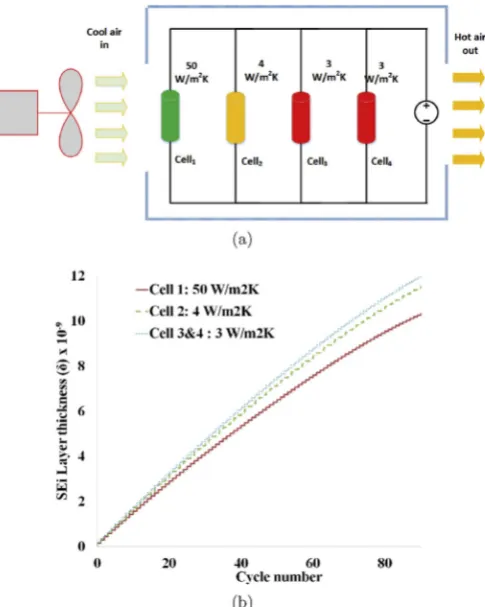
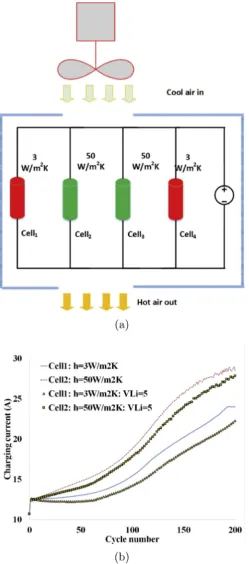
Fig. 7andFig. 8shows the effect of temperature on performance of the battery pack in terms of SEI thickness and charging current. The results present a pack with differentially cooled battery and its effect on ageing and charging current variation. The inter-connecting resistance is taken as zero so that the current distri-bution is equal in all cells which gives theflexibility of analysing the
effect of thermal effects. InFig. 7, a practical case is considered
where the outer most cell, Cell1, receives the maximum cooling and
the innermost cells (Cell3 and Cell4) receives comparatively less
cooling. This condition is achieved by imposing a variation in heat
transfer coefficient for each cell in the pack. The SEI thickness is
plotted for the individual cells with cycle number. We can clearly
see a higher SEI growth for cases with lower heat transfer coeffi
-cient even for relatively small difference. Thus the impact of ther-mal imbalance on SEI layer is much more than the imbalance
caused by the inter-connecting resistances (Rc)
Fig. 8shows the split current distribution to the cell branches with different heat transfer coefficient. The heat transfer coefficient for Cell2and Cell3is kept higher compared to the outer cells, Cell1
and Cell4. This is equivalent to using a fan or blower which can
possibly increase the heat transfer coefficient to a forced convection limit of 50 W=m2K. The current imbalance is plotted for a constant
porosity case and a variable porosity case. There can be initial
disturbance or currentfluctuation in the pack which will settle
down quickly and reach a steady state after few time steps. Lower
temperature on Cell2 decelerates the growth of SEI layer thereby
decreasing the overall resistance of the cell. However a higher
temperature on Cell1accelerates the SEI growth thereby increasing
the overall resistance of the cell causing a lower currentflow.
6. Discussion
Fig. 3shows that the PCV can affect the charging current profile of the pack. The ageing reaction is active only during charging and
comparatively insignificant during discharge therefore the ageing
side reaction is neglected in this model during discharge. Many of the previous experimental and theoretical investigations show that neglecting the SEI growth during discharge is an acceptable
assumption[25,26]. Thus the PCV can affect the life of the battery
leading to accelerated ageing in a constant voltage charging
configuration. The voltage profile changes after 50 cycles, which
shows that a differential SEI build-up can alter the split current distribution in the pack.
From the voltage and current profile analysis, the work proves
that cell-to-cell SEI pattern can exist in the pack with different
charge-discharge conditions even for identical internalRc. However
there are some additional factors that may be important:
1. In Section5.1the investigations were performed with constant
temperature. There is also a possibility that the thermal varia-tion can affect the current distribuvaria-tion or the differential porous
filling leading to stress development in the pack.
2. Wu et al.[18]proved that the value of inter-connecting
resis-tance is critical in deciding the performance of the battery pack,
however this work did not answer whether a change inRc
re-sults in a differential SEI formation possibly leading to acceler-ated ageing of the pack.
[image:11.595.36.286.65.631.2]The following sections will attempt to analyse each case in detail
tofind an answer to the above mentioned questions.
6.1. Discussion on porosity change
The fundamentals of porosity change in a single cell can be seen
in Sikha et al.[19]for iso-thermal conditions. Thus the model was
not coupled with the energy equation to analyse the effect of
thermal heating on porous filling. Fig. 4shows that the current
model is capable of predicting the porosity change pattern in the pack due to the solvent reduction side reaction and analysing the effect of thermal variation on porosity change. There is more intense porousfilling for the cells kept at a higher temperature. This can possibly explain the stress development in a differentially cooled pack which can obviously occur in an automotive pack. The
internal pressure is proved to have influence on the performance of
a battery. A similar observation has been made by Barai et al.[27]
for a single cell Lithium-Sulfur battery that non-uniform
precipi-tation may lead to significant pore confinement, which could have
the potential to cause microcrack formation in the pore walls of a typical carbon-based cathode microstructure.
6.2. Discussion on capacity fade with Rc
Section5.3shows that the pack develops almost uniform cell to
cell SEI pattern even with the highest inter-connecting resistance studiedRc¼1:0102
U
.Fig. 5a shows the current distribution toeach cell in the pack. The value of the inter-connecting resistance must be carefully adjusted while inter-connecting differentially
aged cells which can further widen the imbalance in currentflow
thereby accelerating the SEI growth. A similar analysis can be seen
in Wu et al.[18]to calculate the split current variation. However,
the present work takes the analysis further in the ageing context, to study the sensitivity ofRcon a cell-to-cell differential SEI pattern.
The capacity fade for a single cell is almost linear withios[3,21].
However the capacity fade can be accelerated within a range of exchange current densities and the range is strongly linked to the
cell chemistry; more details can be found in Ramadass et al.[3].
Fig. 5c shows that a higher exchange current density ios can
accelerate ageing; however very weak cell-to-cell differential ageing can be observed in the pack, even with highest value of split
current variation. Hence the split current imbalance due to Rc
change may not significantly affect the ageing behaviour of the
pack. A similar observation was made by Kenney et al.[13]who
used SP model to analyse the capacity fade in a pack with Constant Current(CC) cycling.
The time varying current creates a time varying growth rate for SEI which will be maximum at the beginning of the cycle and then
reduces to a lower value, depending on the current profile. The
higher the time spent by the pack in high current region during charging, the thicker the SEI growth. The battery analysed in this
work quickly allows the current profile to reach an asymptotic
lower value within a short time keeping the SEI growth rate lower.
The time for charging can also affects the SEI growth.Fig. 3c shows
that the cell takes almost 8 h to complete charging. The higher the time spent for charging, the thicker the SEI growth since the side reactions are active especially during charging. The difference in cell current at the beginning of a charging cycle is responsible for the slight difference in SEI growth in the pack. These observations are made for an iso-thermal condition. The effect of temperature increase due to high current and the resulting enhancement in SEI growth rate is completely neglected. Another advantage of using this battery pack layout is that the voltage distribution and the current distribution is not affected by the build-up of SEI layer, or it affects the pack almost uniformly. The battery ages almost equally,
developing a similar SEI resistance pattern on the individual cells.
6.3. Discussion on the thermal performance of cells
Section 5.4and Fig. 6shows that the pack exhibited a cyclic
temperature variation and the maximum temperature was observed at the instances when the rate of change of current is maximum. Hence this model gives insight into the design of the cooling strategy for the battery pack. The phase lag between cur-rent signal and the temperature output is proportional to the heat capacity (Cp) of the cell.
The dependency of temperature on SEI growth, capacity fade and power fade is well established[28]. A thermal gradient exists in the battery which affects the performance during charge and
discharge. Troxler et al.[29]developed a model to quantify thermal
gradient errors due to a lumped parameter approximation. Thus, the model described in this paper uses a discrete thermal model which models the node-to-node heat transfer therefore the model presented can accurately calculate the thermal gradient inside the battery and hence a coupled-differential SEI growth. The accuracy of a thermal model in a pack will be higher if a discrete thermal
model is used to calculate cell-to-cell SEI growth. Yang et al.[30]
developed a thermal model to investigate the temperature varia-tion external to a battery pack, linked to an electrochemical model. The present model combines the advantage of all the above thermal methods by combining a strong internal as well as external
pre-diction to make a better model for real world applications.Fig. 7
shows that higher temperature can further increase the rate of
SEI build-up, andFig. 8shows that the thermal imbalance is more
critical than theRcvariation, which can develop into a variation in
the split current leading to pack current imbalance.Fig. 8showed
an extension of the study presented inFig. 7which showed that a
variable thermal condition can ultimately lead to a variation in the split current in the pack. The variable porosity also has an effect on the current distribution which reduces the charging current indi-cating that the variable porosity acts as a resistance on individual cells. It is worth noting that the effect of variable porosity on split
current is minimal for up tofifty charge discharge cycles but the
difference increases as the cycle number increases. The solvent reduction side reaction at a constant temperature does not alter the
current distribution to an individual cell significantly whereas the
differentially cooled cells can lead to a large difference in expected lifetime.
Although this work tries to separate the effects on life of the battery into ageing and thermal, the overall impact is always coupled. The pack is not able to operate under natural convection conditions with the configuration presented inFig. 1.
As a concluding remark, the model presented in this paper can
be extended to a pack with cells of any configuration with different
initial conditions, capacity and thermal conditions. Moreover this method is capable of analysing the interlinked effects on individual cell performance.
7. Conclusion
A P2D model has been extended to capture the significant
electro-chemical effects such as ageing, porosity variation and temperature, inside a battery pack under cyclic charging and dis-charging conditions. The individual cells in the pack develop uni-form SEI resistance indicating that the pack is stable without significant split current variation even for the highest value of inter-connecting resistance studied. This study shows that thermal
ef-fects have a higher influence than all other factors considered in
be more for the cells kept at higher temperatures. A differential thermal condition can accelerate the SEI growth, possibly leading to differential internal stress development and spilt current variation. Thus, this study integrates the capacity fading, thermal heat gen-eration and the porosity change with a variable SEI resistance and the results show that all the coupled electro-chemical and thermal characteristics can be predicted using this pack model.
Acknowledgement
This work was funded by the Innovate UK through the WMG centre High Value Manufacturing (HVM) Catapult in collaboration with Jaguar Land Rover and TATA Motors European Technical Centre. The authors thank Dr. Gael Chouchelamane, Specialist En-gineer at Jaguar Land Rover and Dr. Shriram Santhanagopalan, National Renewable Energy Laboratory, US, for helpful discussions.
Nomenclature
a Active surface area per electrode unit volume (cm1)
A Electrode plate area (cm2)
c Volume-averaged concentration (mol cm3)
Cp Specific heat (J kg1K1)
Celln Cell number
D Diffusion coefficient (cm2s1)
E Activation energy (J mol1)
F Faraday constant, 96487 C mol1
f± Electrolyte activity coefficient
G Resistance of SEI (
U
cm2)h Convective heat transfer coefficient (W m2K1)
Iapp Applied current (A)
io Exchange current density for intercalation reaction
(A cm2)
ios Exchange current density for solvent reduction reaction
(A cm2)
J1 Reaction current for intercalation reaction (A cm3)
Js Reaction current for solvent reduction reaction (A cm3)
I Current (A)
kct Kinetic rate constant for intercalation reaction
L Length of electrode (cm)
MSEI Molecular weight (kg mol1)
Q Heat generation (W cm3)
R Universal gas constant, 8.3143 (J mol1K1)
R resistance (
U
)Rc Inter-connecting resistance (
U
)t Time (s)
t0
þ Transference number
x Cartesian coordinates
T Absolute temperature (K)
U;OCV Open-circuit potential(V)
V Cell voltage (V)
VLiþ;VLac Partial molar volume for intercalation and side reaction
(cm3mol1)
Greek symbols
a
a;a
c Charge-transfer coefficientd
Thickness (cm)b
Matrix coefficientε Volume fraction of domain
r
Density (kg cm3)h
Over potential (V)k
D Diffusivity (A cm1)Ls Radius of particle (cm)
l
Thermal conductivity (W cm1K1)k
SEI Conductivity of SEI layer (S cm1)s
Solid phase conductivity (S cm1)f
Volume averaged potential (V)U
SEI Initial resistance of SEI layer (U
cm2)Superscript&subscript
amb Ambient condition
app Applied voltage or current to the cell or pack
cell Cell number
e Electrolyte phase
eff Effective
film SEI layer thickness
i Electrodes
max Maximum
n Negative electrode
N Cycle number
ohm Ohmic
p Positive electrode
ref Reference
react Reaction
rev Reversible
s Solid phase of positive or negative electrode
sur Surface quantity
To the left of an interface
þ To the right of an interface
List of acronyms
BMS Battery Management System
CC Constant Current
CV Constant Voltage
ECM Equivalent Circuit Model
EChM Electrochemical model
LCV Lower Cut off Voltage of individual cell
OCV Open Circuit Voltage
P2D Pseudo Two Dimension
PCV Pack Charging Voltage
PDV Pack Discharge Voltage
SEI Solid Electrolyte Interphase
SoC State of Charge
SP Single Particle Model
UCV Upper Cut off Voltage of individual cell
References
[1] M. Doyle, T.F. Fuller, J. Newman, J. Electrochem. Soc. 140 (1993) 1526e1533. [2] K. Smith, C.-Y. Wang, J. Power Sources 160 (2006) 662e673.
[3] P. Ramadass, B. Haran, P.M. Gomadam, R. White, B.N. Popov, J. Electrochem. Soc. 151 (2004) A196eA203.
[4] Y. Xie, J. Li, C. Yuan, J. Power Sources 248 (2014) 172e179. [5] L. Cai, R.E. White, J. Power Sources 196 (2011) 5985e5989.
[6] Y. Ye, Y. Shi, N. Cai, J. Lee, X. He, J. Power Sources 199 (2012) 227e238. [7] M. Dubarry, N. Vuillaume, B.Y. Liaw, J. Power Sources 186 (2009) 500e507. [8] J. Kim, J. Shin, C. Chun, B. Cho, Power Electron. IEEE Trans. 27 (2012) 411e424. [9] C. Sen, N.C. Kar, in: Vehicle Power and Propulsion Conference, IEEE, 2009, pp.
207e212. VPPC’09. IEEE.
[10] R.C. Kroeze, P.T. Krein, in: Power Electronics Specialists Conference, IEEE, 2008, pp. 1336e1342. PESC 2008. IEEE.
[11] K.A. Smith, C.D. Rahn, C.-Y. Wang, J. Dyn. Syst. Meas. Control 130 (2008) 011012.
[12] J.L. Lee, A. Chemistruck, G.L. Plett, J. Power Sources 220 (2012) 430e448. [13] B. Kenney, K. Darcovich, D.D. MacNeil, I.J. Davidson, J. Power Sources 213
(2012) 391e401.
[14] S. Santhanagopalan, Q. Guo, R.E. White, J. Electrochem. Soc. 154 (2007) A198eA206.
[15] H. Sun, X. Wang, B. Tossan, R. Dixon, J. Power Sources 206 (2012) 349e356. [16] B. Severino, F. Gana, R. Palma-Behnke, P.A. Estevez, W.R. Calderon-Mu~noz,
M.E. Orchard, J. Reyes, M. Cortes, J. Power Sources 267 (2014) 288e299. [17] A. Mills, S. Al-Hallaj, J. Power Sources 141 (2005) 307e315.
[18] B. Wu, V. Yufit, M. Marinescu, G.J. Offer, R.F. Martinez-Botas, N.P. Brandon, J. Power Sources 243 (2013) 544e554.
[20] L.H. Saw, Y. Ye, A.A. Tay, W.T. Chong, S.H. Kuan, M.C. Yew, Appl. Energy 177 (2016) 783e792.
[21] T.R. Ashwin, Y.M. Chung, J. Wang, J. Power Sources 328 (2016) 586e598. [22] G. Sikha, B.N. Popov, R.E. White, J. Electrochem. Soc. 151 (2004)
A1104eA1114.
[23] S. Patankar, Numerical Heat Transfer and Fluid Flow, CRC press, 1980. [24] T.R. Ashwin, G. Narasimham, S. Jacob, Int. J. Heat Mass Transf. 54 (2011)
3357e3368.
[25] S. Santhanagopalan, Q. Guo, P. Ramadass, R.E. White, J. Power Sources 156
(2006) 620e628.
[26] J. Vetter, P. Novak, M. Wagner, C. Veit, K.-C. M€oller, J. Besenhard, M. Winter, M. Wohlfahrt-Mehrens, C. Vogler, A. Hammouche, J. power sources 147 (2005) 269e281.
[27] P. Barai, A. Mistry, P.P. Mukherjee, Extreme Mech. Lett. (2016). [28] M.B. Pinson, M.Z. Bazant, J. Electrochem. Soc. 160 (2013) A243eA250. [29] Y. Troxler, B. Wu, M. Marinescu, V. Yufit, Y. Patel, A.J. Marquis, N.P. Brandon,
G.J. Offer, J. Power Sources 247 (2014) 1018e1025.