Pressure Points in Reading Comprehension: A Quantile Multiple Regression Analysis
Language and Reading Research Consortium and
Jessica Logan Ohio State University
All correspondence to [email protected]
Accepted for publication in Journal of Educational Psychology 27 July 2016
Author Note
This paper was prepared by a Task Force of the Language and Reading Research Consortium (LARRC) consisting of Hugh W. Catts (Convener), Kate Cain, Jill Pentimonti, and Jessica Logan (non-LARRC member). LARRC project sites and investigators are as follows:
Ohio State University (Columbus, OH): Laura M. Justice (Site PI), Richard Lomax, Ann O’Connell, Jill Pentimonti, Stephen A. Petrill1, Shayne B. Piasta
Arizona State University (Tempe, AZ): Shelley Gray (Site PI), Maria Adelaida Restrepo.
Lancaster University (Lancaster, UK): Kate Cain (Site PI).
University of Kansas (Lawrence, KS): Hugh Catts2 (Site PI), Mindy Bridges, Diane Nielsen.
University of Nebraska-Lincoln (Lincoln, NE): Tiffany Hogan3 (Site PI), Jim Bovaird, J. Ron Nelson.4
1. Stephen A Petrill was a LARRC co-investigator from 2010-2013.
2. Hugh Catts is now at Florida State University.
3. Tiffany Hogan is now at MGH Institute of Health Professions.
4. J. Ron Nelson was a LARRC co-investigator from 2010-2012.
Abstract
The goal of this study was to examine how selected pressure points or areas of vulnerability are related to individual differences in reading comprehension and whether the importance of these pressure points varies as a function of the level of children’s reading comprehension. A sample of 245 third grade children were given an assessment battery that included multiple measures of vocabulary, grammar, higher-level language ability, word reading, working memory, and reading comprehension. Ordinary least squares (OLS) and quantile regression analyses were undertaken. OLS regression analyses indicated that all variables except working memory, accounted for unique variance in reading comprehension. However, quatntile regression showed that the extent of the relationships varied in some cases across readers of different ability levels. Results suggest that quantile regression may be a useful approach for the study of reading in both typical and atypical readers and aid greater specification of
componential models of reading comprehension across the ability range.
Pressure Points in Reading Comprehension: A Quantile Multiple Regression Analysis Reading comprehension is a complex activity informed by multiple language and
cognitive skills, in addition to word reading ability. Research to date has sought to determine the skills that predict reading comprehension outcomes in unselected samples (Oakhill & Cain, 2012; Vellutino, Tunmer, Jaccard, & Chen, 2007) or to identify candidate causes of poor reading comprehension (Cain & Oakhill, 2006; Catts, Adlof, & Weismer, 2006; Nation, Clarke,
Marshall, & Durand, 2004). What this work does not tell us is which, if any, of these skills make a unique contribution to reading comprehension outcomes and also whether the skills that predict reading comprehension in general are the same for those with poor, average, or good reading comprehension. We seek to address these significant gaps in knowledge. Our aims are to identify the skills that uniquely predict reading comprehension across the ability range, and to determine whether their importance varies as a function of the level of children’s reading comprehension. First, we consider our theoretical framework and variables, and then explain our analytic approach.
memory). We adopt Perfetti et al.’s terminology of ‘pressure points’ because of our interest in the skills that might lead to comprehension breakdown, but we propose a slightly different and expanded categorization of potential pressure points as outlined below. The different child-level variables that we consider meet the criteria for a potential pressure point: they are each integral to text comprehension, have face validity as skills that may be causally related to text
comprehension as well as being robust correlates with reading comprehension skill, and are potentially malleable through instruction and intevention (Perfetti & Adlof, 2012).
Word-level processes play an important first step in the reading comprehension process. The ability to accurately and efficiently decode and recognize printed words is critical to
building an understanding of the text (Perfetti & Hart, 2002). Indeed, children with word reading problems (i.e., dyslexia) often have significant deficits in reading comprehension (Shankweiler, et al., 1999). Beyond decoding, word-level processes include the ability to access and use word meaning. Reading comprehension requires that readers have rich lexical knowledge that can be retrieved quickly and used flexibly to derive appropriate contextual meaning. Children with poor reading comprehension often have deficits in lexical knowledge: they have smaller vocabularies (Catts et al., 2006; Nation et al., 2004) and are less sensitive to semantic relationships or multiple meanings (Henderson, Snowling, & Clarke, 2013; Nation & Snowling, 1999) than are typical readers. Studies using event-related potentials have documented neurological evidence of semantic processing deficits in poor comprehenders (Landi & Perfetti, 2007; Yang et al., 2005) and retrospective studies have shown that poor comprehenders have vocabulary weaknesses that are present in the preschool years (Catts et al., 2006; Elwer, Keenan, Olson, Byrne, &
both poor word reading and poor vocabulary, and a theoretical basis that each may contribute to reading comprehension outcomes.
Perfetti et al. (2013) group word-level processes together as a possible pressure point and there is empirical support for that position: for example, vocabulary skills contribute to
competence in word reading (Language and Reading Research Consortium, 2015a; see also, Metsala, 1999; Ouellette & Beers, 2010; Tunmer & Chapman, 2012) suggesting an association between the two. However, there is also an empirical basis to consider word reading and vocabulary as separate word-level pressure points. First, word reading and vocabulary knowledge make distinguishable contributions to the concurrent prediction of reading
comprehension in grades 1 to 4 (Cain, Oakhill, & Bryant, 2004; Richter, Isberner, Naumann, & Neeb, 2013). In addition, precursors of decoding (e.g., letter knowledge and phonological awareness) and vocabulary knowledge measured before grade 1 make separable contributions to reading comprehension over time through their respective influence on word decoding and listening comprehension (Kendeou, van den Broek, White & Lynch, 2009; Storch & Whitehurst, 2002). Second, when we consider children who have poor reading comprehension in the
presence of age appropriate word reading, not all have weak vocabulary skills (Cain & Oakhill, 1999; Ehrlich, Remond, & Tardieu, 1999; Tong, Deacon, Kirby, Cain, & Parrila, 2011). Such findings question how best to conceptualise the interrelations between these different
Another language skill related to reading comprehension is grammar. This was not considered as a separate candidate pressure point by Perfetti and colleagues. The understanding of individual sentences is necessary to construct the mental model of the text’s meaning.
Grammatical cohesive devices serve a clear integrative function enabling the meanings of successive clauses and sentences to be combined (Halliday & Hasan, 1976). Grammar predicts early reading comprehension outcomes (Muter, Hulme, Snowling, & Stevenson, 2004) and poor comprehenders show weaknesses on measures of grammar and morphosyntax (Adlof & Catts, 2015; Catts et al., 2006; Marshall & Nation, 2003; Stothard & Hulme, 1992; Tong, Deacon, & Cain, 2014). In addition, grammar forms a distinct language dimension from vocabulary and higher-level language by grade 3 (Language and Reading Research Consortium, 2015b). Given this backdrop, we examined the role of grammar as an additional language pressure point in the reading comprehension process.
theoretical and empirical reasons, we consider inference and comprehension monitoring together as a higher-level language pressure point (as do Perfetti and colleagues).
There are contrasting accounts of the relative importance of these different oral language skills (vocabulary, grammar, and higher-level language skills) to listening and reading
comprehension. Some consider the oral language skills of vocabulary and grammar skills as primary predictors of reading and listening comprehension outcomes (Hulme & Snowling, 2011) and higher-level language skills as a ‘secondary’ pressure point, resulting from weaknesses in basic skills further down the language processing chain (see also Perfetti et al., 2013). However, empirical work that shows separate prediction of reading and listening comprehension from lower-level skills (vocabulary and grammar) and higher-level skills (inference making) (Lepola, Lynch, Laakkonen, Silven, & Niemi, 2012; Oakhill & Cain, 2012; Silva & Cain, 2015) supports a more nuanced model. Specifically, this work suggests that higher-level language is an
Another type of pressure point considered by Perfetti and colleagues is cognitive resources such as working memory. Working memory is the mental workspace in which
language processing and the construction of the mental model takes place. Poor comprehenders have weak working memory (Cain, 2006; Carretti, Borella, Cornoldi, & de Beni, 2009; Nation, Adams, Bowyer-Crane, & Snowling, 1999). Critically, assessments on measures of memory that tap the executive component of working memory, that is tasks that require both processing and storage of information, are unique predictors of poor reading comprehension; in contrast, memory tasks that tap only phonological storage are specifically related to decoding problems (Swanson & Berninger, 1995). Such working memory weaknesses could affect the accurate storage of the information needed to make long distance inferences within a text and the
integration of new information with the mental model, leading to reading comprehension failure. In support of this view, working memory is related to differences between good and poor
comprehenders in inference making ability (Cain, Oakhill, & Lemmon, 2004) and
comprehension monitoring (Oakhill, Hartt, & Samols, 2005). Critical to our research aims, it is necessary to determine whether the prediction of reading comprehension by higher-level language skills is independent, or due to their dependence on working memory.
et al., 1999; Perfetti, 1985): that is, slow or inefficient lexical processes might limit the available resources in working memory for the higher-level integrative skills needed to construct the mental model.
Our review demonstrates an inconclusive picture of the candidate causes of reading comprehension failure: there is evidence that each of the proposed types of pressure point is both a primary and a secondary source of reading comprehension difficulties. One difficulty in
interpreting these previous studies, is that the majority of studies have investigated each pressure points individually in relationship to reading comprehension. A handful of studies have
examined their unique and shared contributions to reading comprehension (Cain, Oakhill, & Bryant, 2004; Oakhill & Cain, 2012; Catts et al., 1999; Vellutino, Tunmer, Jaccard & Chen, 2007), but these are limited because they have relied on a single measure of each construct, resulting in a narrow sampling of each construct that is also prone to measurement error.In addition, this work, like most predictive research in reading, has operated with the underlying assumption that variables are equally predictive for all participants. Confidence intervals around such estimates give an idea about how similar the effect is for participants, but the fact remains that the interpreted estimates are “averaged” across children with different levels of reading comprehension ability. This approach does not allow us to determine whether the factors that are predictive of poor reading comprehension are the same as those for average or good reading comprehension.
Research on the component skills of reading comprehension has not tested this issue directly but indicates that it warrants our attention: each of the factors reviewed above explains unique as well as shared variance in reading comprehension, but that the strength of the
for ability level, these findings suggest that a given variable may not be equally predictive across the ability range, a pattern that has been found for other reading-related measures, such as
naming speed (Johnston & Kirby, 2006). The literature on English language learners (ELL), although not the focus of this study, also points to the need to examine the prediction of reading comprehension across different ability groups: ELL and monolingual groups differ not only differ in reading comprehension level, but in the language skills that significantly predict reading comprehension in each group (Geva & Farnia, 2012).
In summary, reading comprehension is a complex construct informed by a range of lower- and higher-level language skills, which draw on cognitive resources. Theoretically, each of these language and cognitive skills may make an independent contribution to the prediction of reading comprehension and there is broad empirical support for this. On examination, the
empirical work indicates that the relationship between these different factors and reading comprehension may be specific to reader profile, but research studies to date have not directly addressed this issue. One approach that can address this gap in our knowledge is quantile regression.
Quantile regression uses a weighting procedure to estimate the relationship between a predictor variable and an outcome variable at several specified points in the distribution of the outcome variable. As such, it allows for the comparison of the factors related to poor versus good comprehension while at the same time using data across the entire ability range. This technique has usefully demonstrated that the contributions of heritability and shared environmental
instruments (Catts, Petscher, Schatschneider, & Bridges, 2009). These studies demonstrate the sensitivity of this approach for uncovering nonlinear relationships that may be missed by other statistical approaches.
Our aims for the present study were to determine which language and cognitive factors are related to reading comprehension in third grade children and to investigate if these factors are the same or different at various levels of comprehension. To do so, participants completed
multiple measures of word recognition, vocabulary, grammar, higher-level language, working memory, and reading comprehension. This provided a broader sampling of these constructs than in previous research, reducing measurement error, and enabling greater generalisation of our findings. Critically, quantile regression analyses were conducted. On a theoretical level, quantile regression can elucidate the relations between different language and cognitive skills and the nature of their influence on reading comprehension success and failure (i.e. consistent or not across the ability range). On a practical level, documenting the skills that influence reading comprehension for good and poor readers may also assist practitioners in developing approaches for early identification and intervention of comprehension problems. For example, those skills most closely related to poor comprehension may be targets for assessment and/or intervention protocols.
Method
Participants
to send home for all students in their class. Among those children whose parents consented to participation, we randomly selected approximately equal number of children per site per grade to receive our assessment battery. The sample for the current study included 245 children who had completed the third grade assessment battery. Table 1 shows the mean age, income status, gender, ethnicity, percentage of free/reduced lunch, and special education status of participants. Note that our sample had a disproportionate percentage of children with family income in the higher bracket. This, no doubt, had some impact on the results reported below. However, because we examined children’s performances across the reading comprehension distribution, our sample likely influences the interpretation of our results less than if only mean performances were considered.
Measures
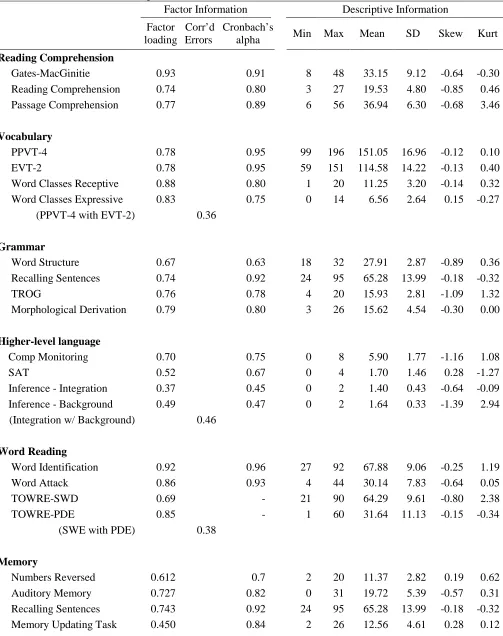
Our assessment battery included multiple measures of vocabulary, grammar, higher-level language processing, working memory, word recognition and reading comprehension. All standardized measures had adequate psychometrics as reported in cited manuals or research reports. Cronbach’s alphas were also calculated for both standardized and non-standardized measures and are presented in Table 2.
semantic class features and to orally express the similarities and differences concerning those relationships (e.g., cat, whiskers, nest, which of these go togeteher; why).
Grammar. Four measures of grammar were administered.The Word Structure subtest of the CELF-4 (Semel et al., 2003) assessed children’s abilities to apply word structure rules or select appropriate pronouns (e.g., The boy likes to read. Everyday he ___). The Recalling Sentences subtest of the CELF-4 assessed children’s ability to listen to spoken sentences of increasing length and complexity and repeat them without changing meaning or sentence structure (e.g., The girl stopped to buy some milk, even though she was late for class). The Test for Reception of Grammar – Version 2 (TROG-2; Bishop, 2003) assessed understanding of grammatical stuctures. In this task, children were asked to point to the picure that corresponded to a spoken sentence (e.g., The man the elephant sees is eating). A Morphological Derivation task described by Wagner and colleagues (Wagner, n.d.) assessed knowledge of derivational morphology. The assessor presented children with a base word (e.g., farm) and an incomplete sentence for which children provided a derived form of the base (e.g., My uncle is a ______).
causally- and temporally-coherent sequence. In this story arrangement task, children were told that they would read some sentences that tell a story, but the story is out of order. The assessor then showed the children a set of 6 to 12 cards, with one sentence typed on each card, in a fixed order and read each sentence aloud to the child. The child was asked to rearrange the sentences to put them in the correct sequence. This measure consists of 1 practice story and 4 test stories. A third researcher-developed measure, inferencing task, based on work by Cain and Oakhill (1999) and Oakhill and Cain (2012) was used to assess children’s ability to generate two types of inferences from short narratives: inferences that require integration of two premises, and
inferences that require integration of information in the text with background knowledge to fill in missing details. Following administration of a practice stiory, children listened to two stories, after which the assessor asked eight questions, reflecting four questions per inference type. For the integration type, the children were asked a question such as “Why did they have no money for the bus (they had spent it on other things)?” For the background knowledge type, children were asked a question such as “Why did they get wet on the way home (story mentioned that it had rained)?” As seen in Table 2, Cronbach’s alpha for the comprehension monitoring task was adequate (.75) whilst the alphas for the other tasks fell short of commonly accepted cutoffs (.45-.67). However, the influence of the low reliability of the latter measures were minimised by the use of a latent variable for higher-level language.
attention. Children listen to a series of both digits and objects and are then asked to reorder the series, saying the objects, followed by the digits, in sequential order. A researcher developed measure, the Memory Updating Task, based on the work of Belacchi, Carretti, and Cornoldi (2010) assessed the ability to modify the contents of working memory using comparison of objects; e.g., as part of the assessment for one item the assessor would say, “This time you will hear five words. I want you to tell me the names of the two smallest things.”
Word Reading. Four measures of word reading were administered. They included two subtests from the Woodcock Reading Mastery Tests-Revised: Normative Update (WRMT-R:NU; Woodcock, 1998). The Word Identification subtest measured children’s ability to
accurately pronounce printed English words ranging from high to low frequency of occurrence. The Word Attack subtest assessed children’s ability to read pronounceable nonwords varying in complexity. We also administered two subtests of the Test of Word Reading Efficiency-Second Edition (TOWRE-2; Torgesen, Wagner & Rashotte, 2011). The Sight Word Efficiency subtest measured how many printed English words, which ranged from high to low frequency of occurrence, children could accurately pronounce in 45 seconds. The Phonemic Decoding Efficiency subtest assessed how many pronounceable nonwords, which varied in complexity, children could accurately pronounce in 45 seconds.
Reading Comprehension. Three measures of reading comprehension were administered. The Gates-MacGinitie Reading Tests (MacGinitie, MacGinitie, Maria, & Dryer, 2002) assessed children’s ability to read one or more sentences and select from 4 corresponding pictures the one that matched the meaning of the sentences. The Reading Comprehension Measure (RCM) was an experimental measure adapted from the Qualitative Reading Inventory (QRI-5; Leslie &
the examiner when each passage had been read. The examiner asked sets of open-ended inferential and non-inferential questions after each one. The narrative passages came from the QRI-5 and the expository passages were created specifically for this project and matched the grade appropriate passages from the QRI-5 in terms of approximate length and lexile score. Children’s responses to administered questions were audio-recorded and were postscored based on a rubric of acceptable answers. Inter-rater reliability was acceptable with an ICC of 0.86. Finally, the Passage Comprehension subtest of the Woodcock Reading Mastery Tests-Revised: Normative Update (WRMT-R:NU; Woodcock, 1998) was administered. This measure was a cloze task that required children to read a series of sentences or short passages and add the missing word(s).
Procedures
Assessors underwent comprehensive measurement training and in-lab observations to ensure consistent training, measurement administration, and fidelity across sites. At two testing sites, measures were administered during one-hour testing blocks in children’s schools. In the other two sites, assessments were administered during 3-6 hour blocks at weekends and frequent play breaks were taken to assure children were attentive during test administration. With the exception of the Gates-MacGinitie, which is a standardized group-administered test, all measures were administered individually.
Analyses
reading comprehension, as well as the unique contributions of each construct to reading
comprehension using an ordinary least squares (OLS) framework, and then replicated the same analyses in a quantile regression framework.
Preliminary Analyses. As noted in previous sections, each of the six theoretical
constructs of interest were tapped by several unique measures (See measures section for detailed information about each measure). To derive one representation for each construct, we calculated latent factor scores. The use of latent factors offers several advantages over using either
individual observed (manifest) variables or a composite score (averages across multiple observed variables) approach. In the case of the former, latent representations are relatively free of
measurement error, thus yielding more accurate representations of the underlying relations between measured constructs. For the latter, latent representatons have several advantages. First, individual measures are not forced to equally contribute to the development of the factor.
Second, we can further reduce error by allowing observed variables that share method variance (or are subtests of the same larger measure) to have correlated error variances as necessary. Third, unlike composite scores, latent approaches provide methods to explicitly measure how well the model fits the data. In the present study, six individual factor analyses were conducted to extract latent variable representations for vocabulary, grammar, higher-level language, word reading, memory and reading comprehension1. The factors were calculated and extracted in Mplus v6.0 using the regression method and maximum likelihood estimation. All error variances
1
Note that our previous theoretical work with this sample identified that vocabulary, grammar, and
higher-level language were unique but correlated aspects of language, thus these were estimated
between observed scores were first constrained to be independent, and then relaxed and allowed to estimate as suggested through modification indices.
The fit of each model was assessed by examining the factor loadings, factor reliabilities, factor determinacies, and static fit indices (CFI, TLI, RMSEA, and SRMR), with results
presented across two separate tables. Table 2 provides the standardized factor loadings of each measure onto its respective construct, as well as the standardized paths for any included
correlated errors. Factor loadings indicated that all observed measures loaded sufficiently well on their respective construct (>0.4; Kline, 2013). Table 3 provides additional model fit indices. Construct reliabilities were calculated using Hancock and Mueller’s Coefficient H (Hancock & Mueller, 2001), which describes the relation between the latent construct and its measured indicators, drawing information from all indicators in a manner commensurate with their ability to reflect the construct (values at or above .90 indicate a reliable construct). Factor determinacy values range from 0 to 1 and indicate how well the factor score correlates with the factor (a larger value denotes a better fitting model). Static model fit indices included the CFI and TLI (values above 0.90 indicate good model fit) and the RMSEA and SRMR (values less than .05 indicate good model fit; Kline, 2013). Examining Table 3, there were a few instances where an individual factor did not meet all model fit criteria (e.g., Word Reading shows an RMSEA considerably larger than .05). However, contemporary practices suggest that model fit indices should be considered as a collective rather than relying on one solitary index (Lomax, 2013), thus taken together these results indicate that all six models fit the data well.
and quantile regression reported in subsequent sections are unbiased by the missingness and missing data were addressed by listwise deletion. Analyses were conducted in R (R Core Team, 2012): The lm package was used for OLS regression and quantreg package for the quantile regressions.
Quantile Regression. An important point to remember about the OLS estimates is that they are designed to represent the best overall estimate for all students, and therefore are most representative of students with the average level of reading comprehension. A critical innovation of this study was to determine whether these relationships differed depending on children’s reading comprehension ability. To do this, we used quantile regression analysis to examine how each construct was related to reading comprehension individually at different quantiles, and how constructs were uniquely related to reading comprehension while controlling for the influences of the others. Our questions are well suited to quantile regression, as this technique allows for the estimation of relations between a dependent and independent variable at multiple locations (i.e., quantiles) of the dependent variable. Quantile regression calculates the strength of these relations without creating subgroups (which would violate the normality assumption of OLS regression). Rather, it uses every observation when estimating the relations at a given point in the
relationat each selected point along the distribution of reading comprehension. Due to this weighted method of estimation, quantile regression has no assumptions of the variance in the residual error terms, no assumptions on the functional form of the relation, and is robust to outliers and non-normally distributed data (Koenker, 2005).
In the current study, we chose to estimate the relations between the constructs at 9 points in the distribution of reading comprehension (the .10 quantile to the .90 quantile) to give as few estimates as possible, while still providing an overall representation of how the functional relationship changes along the distribution of reading comprehension. Critically, the results for the reported quantiles would not vary if additional points were selected; these estimates are representative only of the point described and not of a group of surrounding points. Because the data had a partially nested structure (factor ICCs ranged from .10 to .17; see Table 3), all significance tests (t and F critical values) were adjusted using a conservative cluster-correction coefficient adapted from Hedges (2007), with degrees of freedom corresponding to the number of upper-level units (teachers) rather than lower-level units (children).
Results
The results are presented first for all univariate estimates; where each pressure point is considered in its sole concurrent prediction of reading comprehension. Second, we present all multivariate results, which provide evidence of each component’s unique concurrent prediction of reading comprehension.
demonstrate that, though estimated separately, all components are moderately correlated. Of particular interest in the correlation matrix is how each of the factors correlate with the reading comprehension factor, reported in the first column of Table 3, as the correlation is akin to a regression standardized beta weight. Results indicated that each potential “pressure point” was was strongly and significantly correlated with reading comprehension, with r-values ranging from .597 to .772 (each explaining 35% to 59% of the variance in reading comprehension when used as an individual predictor).
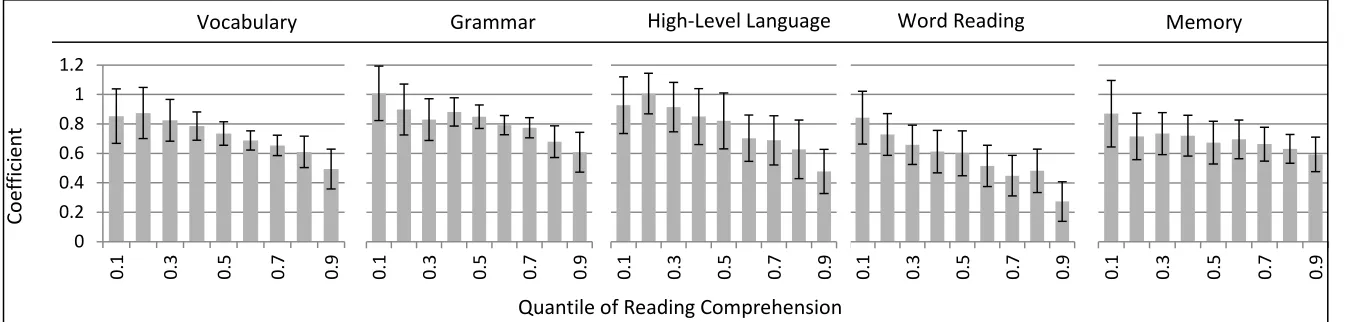
pattern to vocabulary. In each case, constructs tend to be more predictive at the lower end of the distribution of reading comprehension than the higher end, but each predictor is significantly related to the outcome across the distribution of reading comprehension skill.
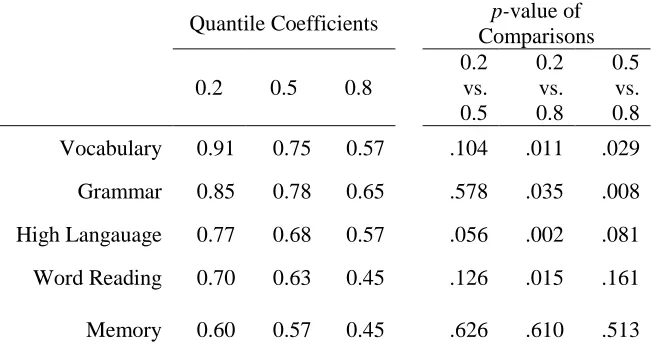
To further examine these trends, we conducted statistical comparisons between quantiles to test whether the relation of each predictor is stronger at one point in the distribution than another (Petscher & Logan, 2014). A-priori we selected three points to compare: the .20, .50, and .80 quantiles, representing the low, mid, and high range of reading comprehension. Though all estimates are visible in Figure 1, exact estimates of the associations between each predictor and the outcome are presented in Table 4, along with the results of the between-quantile
comparisons. From Table 4, we see that the prediction of reading comprehension was significantly better for poor comprehenders than good comprehenders (as evidenced by a significant contrast of the .2 and .8 quantile estimates) for vocabulary, grammar, higher-level language, and word reading, but not for memory. Also for language constructs only, the prediction of reading comprehension was significantly better for average comprehenders (.5) than for good comprehenders (.8); suggesting a decrease in the contribution of language components to reading comprehension as one movs from poor to better comprehenders.
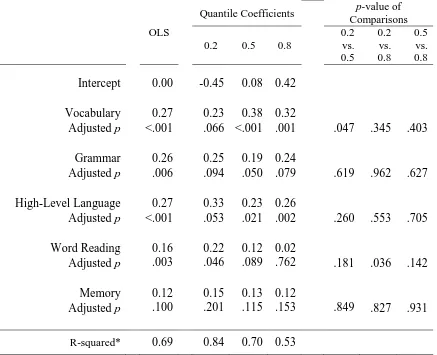
A quantile multiple regression was conducted to examine how each construct was predictive of reading comprehension after controlling for the others. The factor scores were all standardized (m = 0, sd = 1). Therefore resulting coefficients can all be interpreted as partial effects. In line with the simple regression results, the quantile multiple regression was also estimated at nine different points in the reading comprehension distribution. For ease of
comparison, the results of three of those points are reported in Table 5 (for all nine see Figure 2, which can be read the same way as Figure 1, except that coefficients are partial effects). Table 5 contains the coefficients and the cluster-adjusted p-values for each predictor for the OLS
regression and the quantitle regression at four different quantiles of reading comprehension. For example, at the .20 quantile (approximately the 20th percentile), the intercept of reading
comprehension is -0.45, and the coefficient associating vocabulary with reading comprehension (after controlling for the effects of the other predictors) is a significant .23 (evidenced by the confidence intervals not overlapping with zero). Grammar, higher-level language, and word reading were also significant predictors of reading comprehension at the .20 quantile, but memory was not (Table 5). These results can also be visually compared to the OLS results. For example the OLS estimate for vocabulary has the strength of the relation between vocabulary and reading comprehension at .27 (at the mean), which is similar to the quantile regression results at the low end of reading comprehension (.20 quantile) but comparatively weaker to the results near the median of reading comprehension (.60 quantile where the estimate is .37).
any of the quantiles. In contrast, differential effects were found when examining word reading; this construct was significant only at the lower end of reading comprehension (when reading comprehension is below the .40 quantile). This suggests that word reading is an important component skill for children with poor comprehension, but is not uniquely related to
comprehension for children with good comprehension. To further examine these trends, we conducted comparisons between quantiles using the same procedure described earlier. Only one significant difference was found: Word reading was a significantly better predictor of reading comprehension at the low end (.20 quantile) than the high end (.80 quantile; Corrected F(1,82) = 4.56, p = .036).
Also included in Table 5 are estimates of the percentages of variance in reading comprehension accounted for at each of the four quantiles. These were calculated using a
pseudo-R2 (Petscher, Logan, & Zhou, 2013), which is designed to produce an estimate of
variance explained comparable to the traditional OLS R2. The pseudo-R2 values demonstrate that there is a higher percentage of variance explained in reading comprehension for children with poor comprehension skills (84%) in comparison to those with good reading comprehension skills (53%). This finding is consistent with the individual quantile regression analyses that also showed a weaker relationship between constructs and reading comprehension at the higher quantiles.
Discussion
We examined how specific pressure points or areas of vulnerability uniquely influence reading comprehension and whether or not the unique predictors vary as a function of the level of children’s reading comprehension. As expected, we found that word-level semantic
found to be a significant predictor of reading comprehension at all quantiles examined. In addition, other language factors (i.e., grammar and higher-level language) were also significant predictors of reading comprehension, again across quantiles. Not only were language constructs individually related to reading comprehension, but each showed a unique relationship to reading comprehension after controlling for the effects of the others.
In another study using this same dataset, an emergent structure for language was found. Specifically, vocabulary and grammar represented a single construct during
preschool/kindergarten but separate constructs by third grade. In addition, higher-level language was clearly separable from vocabulary and grammar by third grade (Language and Reading Research Consortium, 2015b). It was argued on the basis of those results that vocabulary, grammar, and higher-level language represented different dimensions of language at this grade. The present results showing that each of these constructs explains unique variance in reading comprehension provides further evidence for the dimensionality of language and our hypothesis that higher-level language skills make a specific contribution to reading comprehension
outcomes independent from that of vocabulary and grammar, in contrast to other accounts (e.g., Hulme & Snowling, 2011). This finding is in line with theoretical models of reading
comprehension, which agree that the product of reading comprehension is a mental model of the text’s meaning constructed by integrating the meanings of the propositions in the text and inferring connections between these (e.g., Kintsch, 1998). Further, the contribution of higher-level skills, such as inference making to reading comprehension, cannot be explained simply in terms of their resource demands. Inference draws on vocabulary as well as working memory (Cain & Oakhill, 2014; Cain et al., 2004), but its contribution to reading comprehension
that these different dimensions of language are each critical to reading comprehension in young readers. Furthermore, the range of skills associated with reading comprehension outcomes might be one reason why many interventions with older poorer readers have only moderate impacts (Edmonds et al., 2009).
Each of the language constructs by themselves were more related to reading
comprehension at low ability levels than at the higher levels. Also, our multiple regression model accounted for much less variance at the higher than lower quantiles. Whereas a small ceiling effect in several of our contructs may have contributed to this decline, it is unlikely to have been a major factor. In fact, it is more probable that other factors, not considered in this study, play a more important role in accounting for variance among good comprehenders. One such factor may be background information. There is considerable evidence that prior knowledge of the topic is critical to reading comprehension in most contexts (e.g., Compton, Miller,
Gilbert, & Steacy, 2013; Kendeou & van den Broek, 2005; Schneider, Korkel, & Weinert, 1989). Background knowledge allows readers to better make inferences and build coherence and
memory representations of written text (Kintsch & Rawson, 2005). It may be that this background knowledge plays an important role in differentiating children who have good language and other cognitive skills related to reading. Alternatively, a likely factor that could differentiate children at the higher end of the reading comprehension distribution is standard of coherence, which is children’s explicit or implicit criteria for how coherent their understanding of a passage should be (van den Broek, Bohn-Gettler, Kendeou, Carlson & White, 2011).
Standard of coherence is influenced by task variables, such as the purpose of reading, but also by one’s motivation, interest in a topic or activity, or the presence/absence of distractors or
present study. Children with similar language and cognitive abilities may set very different standards of coherence in this reading activity, and as a result, vary in their ability to answer comprehension questions. Of course, future research will be needed to examine this and other possible factors as they relate to good comprehension.
Among the language factors, grammar was the construct most closely related to reading comprehension. This finding is consistent with evidence of grammatical problems in poor comprehenders (Adlof & Catts, 2015; Catts et al., 2006; Cragg & Nation, 2006), as well as the prediction of reading comprehension by grammar across time (Muter, Hulme, Snowling, & Stevenson, 2004). Given that our grammar construct most likely includes other skills, such as semantic knowledge and memory (Cain, 2007), it is surprising that grammar should be such an important predictor once independent measures of those factors were controlled. One reason for the strength of this predictor may be that grammar serves a wider integrative function that
extends beyond individual sentence comprehension: it enables readers to integrate across clauses and sentences to construct text-level representations. There is empirical support for this
In line with our predictions, word decoding was significantly and uniquely related to reading comprehension in both the OLS and quantile regression analyses. However, in the quantile multiple regression analyses, word reading was only a unique predictor at the lower quantiles (<.40). These results are consistent with other studies demonstrating that, in the early school grades, word reading accounts for more unique variance in reading comprehension than at later grades (Catts, Hogan, & Adlof, 2005; Gough et al., 1996; Language and Reading Research Consortium, 2015a). For higher skilled readers, language abilities were found to be more
uniquely associated with reading comprehension.
Whereas working memory was related to reading comprehension when considered by itself, it did not explain unique variance in either the OLS or quantile regression analyses. There may be several reasons for this finding. First, it has been argued that verbal working memory, which was how it was operationalized in this study, is to a large extent a reflection of children’s basic language ability (Gathercole & Baddeley, 1993). Children with good verbal skills more quickly activate and store verbal items in memory (Nation et al., 1999) and recent work suggests that the influence of working memory on children’s inference making is mediated by vocabulary knowledge (Currie & Cain, 2015). Further, the unique variance in children’s reading
comprehension explained by working memory is reduced significantly when considered
Another possibility is that our working memory measures were not representative of the type of working memory that is important for reading comprehension. Measures of verbal working memory that involve both storage and processing or manipulation of verbal stimuli, and also those with a sentence comprehension component, are most strongly predictive of children’s and adults’ reading comprehension (Carretti, Borella, Cornoldi, & de Beni, 2009; Daneman & Merikle, 1996; Siegel & Ryan, 1989). While all of our working memory tasks tapped the storage and processing resources of verbal working memory, we selected tasks that did not include comprehension of sentences in order to examine the unique prediction of memory over and above our assessments of grammar and higher-level language skills. We would expect that measures of working memory such as the listening span task to be more strongly predictive of children’s reading comprehension. But then again, such a task would be expected to have more overlap with our language measures, and thus explain less unique variance.
We considered only child-level pressure points, that is how individual differences in language skills were related to reading comprehension outcomes, and sought to explain their unique, rather than interactive, influence. Several of these skills meet the criteria for a pressure point: theoretically the language skills we studied are integral to text comprehension, their unique influence across the ability range confirmed their validity as component comprehension skills, and each is potentially malleable through instruction and intevention (Compton & Pearson, 2016). However, our analytic framework did not take into account text characteristics and how these can interact with reader characteristics to influence comprehension (e.g.,
of the text and reader skills (as is the case for weak decoders, and younger readers) that word reading is found to be a pressure point. Considered in a developmental context, we might
speculate that different pressure points are paramount at different points in development. Future studies should also consider how different reader skills work in concert to support
comprehension processing and how characteristics of the text, for example decoding level, topic and also cohesion, interact with reader skills to influence comprehension (Compton & Pearson, 2016).
Implications
Our general aim was to understand better the factors that predict reading comprehension success and failure. Our findings have both theoretical and practical implications. First, we found a non-linear relationship between word reading and reading comprehension; word reading was significantly related to reading comprehension only for poor readers. In relation to our theoretical frameworks, this finding indicates that the impact of word reading on reading comprehension not only decreases across the course of development (Language and Reading Reasearch Consortium, 2015a), but also across the ability range, in line with the simple view of reading. Critically, our findings extend this work by suggesting that language skills, as well as word reading skills, may exert different influences on reading comprehension for different reader profiles. In particular, the impact of these skills appears to be lower at the higher ability levels and factors other than word reading, language, and memory may be operative in this range (see also Compton et al., 2014, for discussion of this point).
In terms of instruction, this finding highlights the need for a focus on a range of skills, including word reading, to support the development of good reading comprehension, as
is not a proxy measure for reading comprehension and converge with research highlighting the need for reading comprehension assessments that are not unduly influenced by decoding skills (Keenan, Betjemann, & Olson, 2008). To improve the tools available for language and literacy research, we note that the assessments of higher-level language skills require additional
measurement work because internal consistency was below commonly accepted cutoffs, particularly for the inference task. However, measurement error was minimised by the use of more than one indicator for each of our language constructs.
These insights into assessment, instruction, and the relationships between different language skills and reading were possible through our use of quantile multiple regression. This analytic approach could be a useful method to examine other aspects of reading development. By
References
Adlof, S. M. & Catts, H.W. (2015). Morphosyntactic skills in poor comprehenders. Reading and
Writing: An Interdisciplinary Journal.28, 1051-1070.
Adlof, S. M., Perfetti, C. A., & Catts, H. W. (2011). Developmental changes in reading comprehension: Implications for assessment and instruction What research has to say
about reading instruction (Vol. 4, pp. 186-214). Newark, DE: International Reading
Association.
Belacchi, C., Carretti, B., & Cornoldi, C. (2010). The role of working memory and updating in
Coloured Raven Matrices performance in typically developing children. European
Journal of Cognitive Psychology, 22, 1010-1020.
Bishop, D. M. V. (2003). Test for Reception of Grammar-2. London: Pearson.
Cain, K. (2006). Children's reading comprehension: The role of working memory in normal and impaired development. In S.J. Pickering (Ed.) Working memory and education (p. 61-91). Amsterdam: Elsevier.
Cain, K. (2007). Syntactic awareness and reading ability: is there any evidence for a special relationship? Applied Psycholinguistics, 28, 679-694.
Cain, K., & Oakhill, J. (1999). Inference making ability and its relation to comprehension
failure in young children. Reading and writing, 11(5-6), 489-503.
Cain, K., & Oakhill, J. (2006). Profiles of children with specific reading comprehension difficulties. British Journal of Educational Psychology, 76, 683-696. doi: 10.1348/000709905X67610
431-443. doi: 10.1177/0022219411410042
Cain, K., & Oakhill, J. (2014). Reading comprehension and vocabulary: Is vocabulary more important for some aspects of comprehension? L'Année Psychologique, 114, 647-662. Cain, K., Oakhill, J., & Bryant, P. E. (2004). Children's reading comprehension ability:
Concurrent prediction by working memory, verbal ability, and component skills. Journal
of Educational Psychology, 96, 31-42. doi: 10.1037/0022-0663.96.1.31
Cain, K., Oakhill, J., & Lemmon, K. (2004). Individual differences in the inference of word meanings from context: the influence of reading comprehension, vocabulary knowledge, and memory capacity. Journal of Educational Psychology, 96, 671-681. doi:
10.1037/0022-0663.96.4.671
Carretti, B., Borella, E., Cornoldi, C., & De Beni, R. (2009). Role of working memory in explaining poor comprehenders performance: A meta-analysis. Learning and Individual
Differences, 19, 246-251. doi:10.1016/j.lindif.2008.10.002
Carretti, B., Borella, E., Cornoldi, C., & de Beni, R. (2009). Role of working memory in explaining the performance of individuals with specific reading comprehension difficulties: A meta-analysis. Learning and Individual Differences, 19, 246-251.
Catts, H. W., Adlof, S. M., & Weismer, S. (2006). Language deficits in poor comprehenders: A case for the Simple View of Reading. Journal of Speech-Language-Hearing Research,
49, 278- 293.
Catts, H.W., Fey, M.E., Zhang, X., & Tomblin, J.B. (1999). Language basis of reading and reading disabilities: Evidence from a longitudinal study. Scientific Studies of Reading, 3,
Catts, H.W., Hogan, T.P., & Adlof, S.M. (2005). Developmental changes in reading and reading disabilities. In H. W. Catts & A. G. Kamhi (Eds.), The connections between language
and reading disabilities (pp. 25-40). Mahwah, NJ: Lawrence Erlbaum Associates.
Catts, H.W., Petscher, Y., Schatschneider, C., & Bridges, M. (2009). Floor effects in
universal screening and their impact on the early identification of reading disabilities.
Journal of Learning Disabilities, 42, 163-176.
Compton, D.L., Miller, A.C., Elleman, A.M., & Steacy, L.M. (2014). Have we forsaken reading theory in the name of “quick fix” Interventions for children with reading disability?
Scientific Studies of Reading, 18, 55-73. doi: 10.1080/10888438.2013.836200
Compton, D.L., Miller, A.C., Gilbert, J.K. & Steacy, L.M. (2013). What can be learned about the reading comprehension of poor readers through the use of advanced statistical modeling techniques? In L. E. Cutting, B. Miller, & P. McCardle (Eds.), Unraveling the
behavioral, neurobiological, & genetic components of reading comprehension, (pp. 135-
147). Baltimore, MD: Brookes Publishing.
Compton, D.L. & Pearson, P.D. (2016) Identifying robust variations associated with reading comprehension skill: The search for pressure points. Journal of Research on Educational
Effectiveness, 9:2, 223-231.
Cragg, L., & Nation, K. (2006). Exploring written narrative in children with poor reading comprehension. Educational Psychology, 26, 55-72.
Daneman, M., & Carpenter, P. A. (1980). Individual differences in working memory and reading. Journal of Verbal Learning and Verbal Behaviour, 19, 450-466.
Deason, S.H. & Kirby, J.R. (2004). Morphological awareness: Just “more phonological”? The roles of morphological and phonological awareness in reading development. Applied
Psycholinguistics, 25, 223-238.
Dunn, L., & Dunn, D. (2007). Peabody Picture Vocabulary Test-4. Minneapolis: Pearson.
Edmonds, M. S., Vaughn, S., Wexler, J., Reutebuch, C., Cable, A., Tackett, K. K., &
Schnakenberg, J. W. (2009). A synthesis of reading interventions and effects on reading comprehension outcomes for older struggling readers. Review of Educational Research,
79(1), 262-300.
Ehrlich, M. F., Remond, M., & Tardieu, H. (1999). Processing of anaphoric devices in young skilled and less skilled comprehenders: Differences in metacognitive monitoring.
Reading and Writing, 11, 29-63.
Elwér, Å., Keenan, J. M., Olson, R. K., Byrne, B., & Samuelsson, S. (2013). Longitudinal
stability and predictors of poor oral comprehenders and poor decoders. Journal of
Experimental Child Psychology, 115, 497-516.
Gathercole, S. E., & Baddeley, A. D. (1993). Phonological working memory: A critical building block for reading development and vocabulary acquisition? European Journal of
Psychology of Education, 8, 259-272.
Gough, P. B., Hoover, W. A., & Peterson, C. L. (1996). Some observations on a simple view of reading. In C. Cornoldi & J. Oakhill (Eds.), Reading comprehension difficulties:
Processes and interventions (pp. 1-13). Mahwah, NJ: Erlbaum.
Hancock, G. R., & Mueller, R. O. (2011). The reliability paradox in assessing structural relations within covariance structure models. Educational and Psychological Measurement, 71, 306-324.
Henderson, L., Snowling, M., & Clarke, P. (2013). Accessing, integrating, and inhibiting word
meaning in poor comprehenders. Scientific Studies of Reading, 17(3), 177-198.
Hulme, C., & Snowling, M. J. (2011). Children's reading comprehension difficulties: nature, causes, and treatments. Curent Directions in Psychological Science, 20, 139-142. Justice, L., Mashburn, A. & Petscher, Y. (2013). Very early language skills of fifth-grade poor
comprehenders. Journal of Research in Reading, 36, 172-185.
Keenan, J.M., Betjemann, R. S., & Olson, R. K. (2008). Reading comprehension tests vary in the skills they assess: Differential dependence on decoding and oral comprehension.
Scientific Studies of Reading, 12, 281-300.
Kendeou, P., & van den Broek, P. (2005). The effects of readers’ misconceptions on comprehension of scientific text. Journal of Educational Psychology, 97, 235-245. Kendeou, P., van den Broek, P., White, M., & Lynch, J. S. (2009). Predicting reading
comprehension in early elementary school: the independent contributions of oral language and decoding skills. Journal of Educational Psychology, 101, 765-778. Kintsch, W. (1998). Comprehension: A Paradigm for Cognition. New York, NY: Cambridge
University Press.
Kintsch, W., & Rawson, K. A. (2005). Comprehension. In M. J. Snowling & C. Hulme (Eds.),
The science of reading: A handbook (pp. 209-226). Malden, MA: Blackwell.
Language and Reading Research Consortium (2015b). The dimenationality of language ability in young children., Child Development, 86, 1948-1965.
Landi, N., & Perfetti, C. A. (2007). An electrophysiological investigation of senatic and
phonological processing in skilled and less-skilled comprehenders. Brain and Language,
102, 30-45.
Lepola, J., Lynch, J. S., Laakkonen, E., Silven, M., & Niemi, P. (2012). The role of inference making and other language skills in the development of narrative listening
comprehension in 4–6-year-old children. Reading Research Quarterly, 47, 259-282. Leslie, L., & Caldwell, J. S. (2011). Qualitative Reading Inventory (5 ed.): Chicago, IL: Pearson. Logan, J., Petrill, S.A., Hart, S.A., Schatschneider, C. Thompson, L.A., Deater-Deckard, K.,
DeThorne, L.S., Barlett, C. (2012) Heritabilty across the distribution: An application of quantile regression. Behavorial Genetics, 42, 256-267.
MacGinitie, W.H., MacGinitie, R.K., Maria, K., & Dryer, L.G. (2002). Gates-MacGinitie
Reading Tests-4. Rolling Meadows, IL:Riverside.
Marshall, C. M., & Nation, K. (2003). Individual differences in semantic and structural errors in
children’s memory for sentences. Educational and Child Psychology, 20, 7.
McNamara, D. S., Kintsch, E., Songer, N. B., & Kintsch, W. (1996). Are good texts always better? Interactions of text coherence, background knowledge, and levels of
understanding in learning from text. Cognition and Instruction, 14, 1–43.
Muter, V., Hulme, C., Snowling, M., & Stevenson, J. (2004). Phonemes, rimes, vocabulary and grammatical skills as foundations of early reading development: evidence from a
Nation, K., Adams, J. W., Bowyer-Crane, C. A., & Snowling, M. J. (1999). Working memory deficits in poor comprehenders reflect underlying language impairments. Journal of
Experimental Child Psychology, 73, 139-158.
Nation, K., Clarke, P., Marshall, C.M., & Durand, M (2004). Hidden language impairments in children: Parallels between reading comprehension and specific language impairments.
Journal of Speech, Language, and Hearing Research, 47, 199-211.
Nation, K., Cocksey, J., Taylor, J. S., & Bishop, D.M.V. (2010). A longitudinal investigation of
early reading and language skills in children with poor reading comprehension. Journal
of Child Psychology and Psychiatry, 51, 1031-1039.
Nation, K., & Norbury, C. F. (2005). Why reading comprehension fails: Insights from developmental disorders. Topics in language disorders, 25, 21-32.
Nation, K., & Snowling, M. J. (1999). Developmental differences in sensitivity to semantic
relations among good and poor comprehenders: Evidence from semantic priming.
Cognition, 70, B1-B13.
Oakhill, J. V., & Cain, K. (2012). The precursors of reading ability in young readers: Evidence
from a four-year longitudinal study. Scientific Studies of Reading, 16, 91-121.
Oakhill, J., & Cain, K. (2012). The precursors of reading comprehension and word reading in young readers: Evidence from a four-year longitudinal study. Scientific Studies of
Reading, 16, 91-121. doi: 10.1080/10888438.2010.529219
Oakhill, J., Hartt, J., & Samols, D. (2005). Levels of comprehension monitoring and working memory in good and poor comprehenders. Reading and Writing, 18, 657-713.
Perfetti, C. A. (1985). Reading ability. New York: Oxford University Press.
Perfetti, C. A., & Adlof, S. M. (2012). Reading comprehension: A conceptual framework from word meaning to text meaning. (pp 3-20) in J. Sabatini, E. Albro, & T. O’Reilly (Eds) Measuring up: Advances in how to assess reading ability. Lanham, MD: Rowman & Littlefield Education.
Perfetti, C. A., & Hart, L. (2002). The lexical quality hypothesis. In L. Vehoeven, C. Elbro, &
Reitsma (Eds.). Precursors of functional literacy (p. 189-213). Amsterdam/ Philadelphia:
John Benjamins.
Perfetti, C., Stafura, J.Z., & Adlof, S.M. (2014). Reading comprehension and reading comprehension problems: A word-to-text integration perspective. In B. Miller, L.E. Cutting, & P. McCardle (Eds). Unraveling reading comprehension: Behavioral,
Neurobiological and genetic components, (p.22-32). Baltimore, MD:Brookes Publishing.
Petscher, Y. & Kim, Y. (2011). The utility and accuracy of oral reading fluency score types in
predicting reading comprehension. Journal of School Psychology, 49, 107-129.
Petscher, Y., Logan, J.A.R., & Zhou (2013). Quantile regression in the Behavioral Sciences. In
Y. Petscher & C. Schatschneider (Eds.), Applied Quantitative Analysis in Education and
the Social Sciences. New York: Routledge.
Petscher, Y. & Logan, J.A.R. (2014). Quantile regression in the study of developmental sciences.
Child Development, 85, 861-881.
R Core Team (2012). R: A language and environment for statistical computing. R Foundation for Statistical Computing, Vienna, Austria. ISBN 3-900051-07-0, URL
http://www.R-project.org/.
comprehension in primary school children. Scientific Studies of Reading, 17, 415-434. Schneider, W., Korkel, J., and Weinert, F. E. (1989). Domain-specific knowledge and memory
performance: A comparison of high- and low-aptitude children. Journal of Educational
Psychology, 81, 306–312.
Semel, E. M., Wiig, E. H., & Secord, W. (2003). Clinical Evaluation of Language
Fundamentals-4. Toronto, Canada: Psychological Corporation.
Shankweiler, D., Lundquist, E., Katz, L., Stuebing, K. K., Fletcher, J. M., Brady, S., ... &
Shaywitz, B. A. (1999). Comprehension and decoding: Patterns of association in children with
reading difficulties. Scientific Studies of Reading, 3, 69-94.
Siegel, L. S., & Ryan, E. B. (1989). The development of working memory in normally achieving and subtypes of learning disabled children. Child Development, 60, 973-980.
Silva, M. T., & Cain, K. (2015). The relations between lower- and higher-level oral language skills and their role in prediction of early reading comprehension Journal of Educational
Psychology, 107, 321-331.
Snow, C.E. (2002). Reading for understanding: Toward a research and development program in
reading comprehension. Santa Monica, CA: RAND Cooperation.
Storch, S. A., & Whitehurst, G. J. (2002). Oral language and code-related precursors to reading: Evidence from a longitudinal structural model. Developmental Psychology, 38, 934-947. Stothard, S. E., & Hulme, C. (1992). Reading comprehension difficulties in children. Reading
and Writing, 4, 245-256.
Stothard, S. E., & Hulme, C. (1995). A comparison of phonological skills in children with reading comprehension difficulties and children with decoding difficulties. Journal of
Swanson, H. L., & Berninger, V. (1995). The role of working memory in skilled and less skilled readers' comprehension. Intelligence, 21, 83-108.
Tong, X., Deacon, S. H., & Cain, K. (2014). Morphological and syntactic awareness in poor comprehenders: another piece of the puzzle. Journal of Learning Disabilities, 47, 22-33. Tong, X., Deacon, S. H., Kirby, J. R., Cain, K., & Parrila, R. (2011). Morphological awareness:
A key to understanding poor reading comprehension in English. Journal of Educational
Psychology, 103, 523-534
Torgesen, J.K., Wagner, R.K., & Rashotte, C.A. (2011). Test of Word Reading Efficiency-
Second Edition. Austin, TX: PRO-ED.
van den Broek, P. W., Bohn-Gettler, C., Kendeou, P., Carlson, S. & White, M. J. (2011). When a reader meets a text: The role of standards of coherence in reading
comprehension. In M.T. McCrudden, J.P. Magliano, G. Schraw (Eds.), Text relevance
and learning from text., pp. 123-140. Greenwich, CT: Information Age Publishing.
Van Dyke, J. A., Johns, C. L., & Kukona, A. (2014). Low working memory capacity is only spuriously related to poor reading comprehension. Cognition, 131, 373-403.
Wagner, R (n.d.) Morphological task. Unpublished test. Florida State University
Williams, K. T. (2007). Expressive Vocabulary Test-2. San Antonio, TX: Pearson Assessments.
Woodcock, R.W. (1998). Woodcock-Reading Mastery Tests-Revised/Normative Update. Circle Pines, MN: American Guidance Service.
Woodcock, R. W., McGrew, K. S., & Mather, N. (2001). Woodcock-Johnson III Tests of
Cognitive Abilities. Rolling Meadows, IL: Riverside.
Yang, C.L., Perfetti, C., & Schmalhofer, F. (2005). Less skilled comprehenders ERPs show
sluggish word-to-text integration processes. Written Language & Literacy, 8, 233-257.
Table 1. Participant characteristics Characteristic
N 245
Average age (years) 8.58
Individualized Education Plan 6% Income (categorical)
< 30K 11%
31K - 60K 17%
60K - 85K 20%
> 85K 41%
Did not report 11%
Free/Reduced Price Lunch
Yes 18%
Did not report 10%
Gender
Female 52%
Race (participants could select multiple)
White/Caucasian 81%
African American 5%
Asian 5%
Did not report 10%
Ethnicity
Hispanic/Latino 6%
Not Hispanic/Latino 83%
Table 2. Factor and descriptive information for variables in the six FAs.
Factor Information Descriptive Information
Factor
loading
Corr’d Errors
Cronbach’s
alpha Min Max Mean SD Skew Kurt
Reading Comprehension
Gates-MacGinitie 0.93 0.91 8 48 33.15 9.12 -0.64 -0.30 Reading Comprehension 0.74 0.80 3 27 19.53 4.80 -0.85 0.46 Passage Comprehension 0.77 0.89 6 56 36.94 6.30 -0.68 3.46
Vocabulary
PPVT-4 0.78 0.95 99 196 151.05 16.96 -0.12 0.10
EVT-2 0.78 0.95 59 151 114.58 14.22 -0.13 0.40
Word Classes Receptive 0.88 0.80 1 20 11.25 3.20 -0.14 0.32 Word Classes Expressive 0.83 0.75 0 14 6.56 2.64 0.15 -0.27
(PPVT-4 with EVT-2) 0.36
Grammar
Word Structure 0.67 0.63 18 32 27.91 2.87 -0.89 0.36 Recalling Sentences 0.74 0.92 24 95 65.28 13.99 -0.18 -0.32
TROG 0.76 0.78 4 20 15.93 2.81 -1.09 1.32
Morphological Derivation 0.79 0.80 3 26 15.62 4.54 -0.30 0.00
Higher-level language
Comp Monitoring 0.70 0.75 0 8 5.90 1.77 -1.16 1.08
SAT 0.52 0.67 0 4 1.70 1.46 0.28 -1.27
Inference - Integration 0.37 0.45 0 2 1.40 0.43 -0.64 -0.09 Inference - Background 0.49 0.47 0 2 1.64 0.33 -1.39 2.94
(Integration w/ Background) 0.46
Word Reading
Word Identification 0.92 0.96 27 92 67.88 9.06 -0.25 1.19 Word Attack 0.86 0.93 4 44 30.14 7.83 -0.64 0.05
TOWRE-SWD 0.69 - 21 90 64.29 9.61 -0.80 2.38
TOWRE-PDE 0.85 - 1 60 31.64 11.13 -0.15 -0.34
(SWE with PDE) 0.38
Memory
Note: PPVT-4=Peabody Picture Vocabulary Test-4; EVT-2=Expressive Vocabulary Test-2; TROG=Test for Reception of Grammar; SAT= Story Arrangement Task; TOWRE-SWE=Test of Word Reading Efficiency-Sight Word Reading Efficiency; TOWRE-PDE=Test of Word
Table 3. Correlations between extracted factor scores, Coefficient H, factor determinacies, model fit for each factor analysis, and variance components of extracted factors.
Reading
Comp Vocabulary Grammar
High-Level Language
Word
Reading Memory Factor Correlations
Vocabulary 0.730
Grammar 0.772 0.757
High-Level Language 0.628 0.513 0.671
Word Reading 0.597 0.614 0.585 0.344
Memory 0.658 0.639 0.785 0.480 0.516 ----
Model Fit
Coefficient H 0.96 0.98 0.95 0.87 0.97 0.96
Factor Determinacy 0.95 0.94 0.91 0.79 0.96 0.87
Skewness -0.66 -0.13 -0.67 -0.88 -0.49 -0.16
CFI 1.00 1.00 1.00 1.00 0.94 1.00
TLI 1.00 0.98 0.99 1.03 0.81 1.00
RMSEA 0.00 0.08 0.05 0.00 0.29 0.00
SRMR 0.00 0.01 0.01 0.01 0.02 0.02
Variance Components
Tau 0.10 0.15 0.13 0.06 0.10 0.12
Sigma Squared 0.81 0.74 0.71 0.57 0.82 0.64
ICC 0.11 0.17 0.15 0.09 0.11 0.16
Table 4. Quantile univariate regression coefficients and comparisons for predictors of reading comprehension
Quantile Coefficients p-value of Comparisons
0.2 0.5 0.8
0.2 vs. 0.5
0.2 vs. 0.8
0.5 vs. 0.8
Vocabulary 0.91 0.75 0.57 .104 .011 .029
Grammar 0.85 0.78 0.65 .578 .035 .008
High Langauage 0.77 0.68 0.57 .056 .002 .081
Word Reading 0.70 0.63 0.45 .126 .015 .161
Memory 0.60 0.57 0.45 .626 .610 .513
Table 5. OLS and Quantile multiple regression results for predictors of reading comprehension
OLS
Quantile Coefficients p-value of Comparisons
0.2 0.5 0.8
0.2 vs. 0.5
0.2 vs. 0.8
0.5 vs. 0.8
Intercept 0.00 -0.45 0.08 0.42
Vocabulary 0.27 0.23 0.38 0.32
Adjusted p <.001 .066 <.001 .001 .047 .345 .403
Grammar 0.26 0.25 0.19 0.24
Adjusted p .006 .094 .050 .079 .619 .962 .627
High-Level Language 0.27 0.33 0.23 0.26
Adjusted p <.001 .053 .021 .002 .260 .553 .705
Word Reading 0.16 0.22 0.12 0.02
Adjusted p .003 .046 .089 .762 .181 .036 .142
Memory 0.12 0.15 0.13 0.12
Adjusted p .100 .201 .115 .153 .849 .827 .931
Figure 1. Results of quantile regression for each separate predictor of reading comprehension 0 0.2 0.4 0.6 0.8 1 1.2 0. 1 0. 3 0. 5 0. 7 0. 9 0. 1 0. 3 0. 5 0. 7 0. 9 0. 1 0. 3 0. 5 0. 7 0. 9 0. 1 0. 3 0. 5 0. 7 0. 9 0. 1 0. 3 0. 5 0. 7 0. 9
Vocabulary Grammar High-Level Language Word Reading Memory
Quantile of Reading Comprehension
Co
effic
ie
Figure 2. Results of quantile multiple regression showing the unique relationship of each predictor to reading comprehension -0.2 0 0.2 0.4 0.6 0.8 0. 1 0. 3 0. 5 0. 7 0. 9 0. 1 0. 3 0. 5 0. 7 0. 9 0. 1 0. 3 0. 5 0. 7 0. 9 0. 1 0. 3 0. 5 0. 7 0. 9 0. 1 0. 3 0. 5 0. 7 0. 9
Vocabulary Grammar High-Level Language Word Reading Memory
Quantile of Reading Comprehension
C
oe
ffic
ie