Goose eggshell geometry
Š. Nedomová
1, J. Buchar
21
Department of Food Technology, Faculty of Agronomy, Mendel University in Brno,
Brno, Czech Republic
2
Department of Physics, Faculty of Agronomy, Mendel University in Brno,
Brno, Czech Republic
Abstract
Nedomová Š., Buchar J., 2014. Goose eggshell geometry. Res. Agr. Eng., 60: 100–106.
The paper presents a new approach of the eggshell geometry determination using and analysing the egg digital image and edge detection techniques. The detected points on the eggshell contour were fitted by the Fourier series. The obtained equations describing an egg profile were used to calculate the egg volume, surface area, and radius of curvature with much higher degree of precision in comparison with previously published approaches. The paper shows and quantifies the limitations of the common and frequent procedures.
Keywords: image analysis; goose’s egg; eggshell profile; radius of curvature; egg volume; egg surface area
Description of chicken egg shape is important for numerous applications and studies. Generally, when talking about avian eggs (both domestic and wild spe-cies), the knowledge of their geometric parameters is relevant to a number of studies, such as population and ecological morphology (Mänd 1998), predicting chick weight (Narushin et al. 2002), egg hatchabil-ity (Narushin, Romanov 2002a,b), eggshell qual-ity (Altuntaş, Şekeroğlu 2008; Nedomová et al. 2009), egg interior parameters, avian biology, taxon-omy, classification, reproduction, poultry selection, genetics, and processing. The knowledge of the egg’s shape is also necessary for the numerical simulation of the egg behaviour under mechanical loading (Per-ianu et al. 2010), at numerical analysis of different thermal treatments (Sabliov et al. 2002; Denys et al. 2003; Kumar et al. 2012), for the numerical simula-tion of diffusion processes (Fabbri et al. 2011), and for the solution of many other problems.
There is a natural variability in egg shape. High variability of egg shapes creates difficulties in their description. Egg shape evaluation can be performed
by two ways: (a) by mathematical equations, and (b) by different indices, which show the deviation of a true shape from some model object. Mathemati-cal description of an egg profile allows Mathemati-calculating the egg volume, surface area, long circumference length, normal projected area of the egg, radius of curvature and angle between the long axis and the tangent to the shell at any point.
Characterization of egg’s shape by use of two dices: (a) egg length to a max. width ratio (shape in-dex) and (b) the ratio of long and short sections of the longitudinal axis of the egg after division by the axis of max. diameter, was proposed by Schonwet-ter (1960). The most popular is the shape index:
SI= B
L×100 (%) where:
B – width of eggs
L – length of the eggs
101 of < 72, between 72 and 76, and > 76, respectively
(Sarica, Erensayin 2004).
The knowledge of the egg dimension enables to evaluate the geometric mean diameter (Dg), sphe-ricity (F), volume (V), surface area (S) of eggs using the following equations (Mohsenin 1970; Bar-yeh, Mangope 2003):
Dg=
( )
LB21
3 (1)
Φ=Dg
L ×100 (%) (2)
S=πDg2 (3)
V=π
6LB2 (4)
Narushin (2005) gave also a more accurate and available formula for V and S:
V = (0.6057 – 0.0018B)LB2 (5)
S = (3.155 – 0.013L + 0.0115B)LB (6) The dimensions of the eggs have been also used for the derivation of the mathematical form of the egg shape. The main results were achieved by Narushin (2001b) and Narushin and Romanov (2002a,b) who proposed the mathematical equa-tion for the profile of any avian egg:
y= ± Ln2+1× 2n n+1−x2
n=1.057 L B
⎛ ⎝⎜ ⎞⎠⎟
2.372 (7)
where:
x – coordinate along the longitudinal axis
y – the transverse distance to the profile
Even if there are many other functions describing the eggshell shape (Kitching 1997; Sabliov et al. 2002).
However, there are still at least two main problems: firstly, the supposed curve in the reported model (Eq. 7) will not always best resemble all eggs’ shapes; secondly, if the measurements of L and B with a ver-nier calliper cannot be fast and automatic, it will not be acceptable in poultry industry. The second of these problems is solved by Zhou et al. (2009). In the given paper the main attention is focused on the evaluation of egg volume and surface using the exact description of the egg profile. In order to achieve this exact description of the egg shape a new application is used. This method uses a graphical user interface,
which allowed the user to accurately determine the necessary dimensional properties of eggs from digi-tal photographs of the eggs.
The objective of this paper consists in the compar-ison of the results following from Eq. (7) with exact description of the eggshell contours obtained from digital photographs of the eggs. The main atten-tion is focused on the evaluaatten-tion of the radii of the curvatures of the curve describing eggshell profile. Even if the knowledge of these parameters is neces-sary to interpret forces at the contact between egg and another body at both static and dynamic load-ing (Chung Wei-Li et al. 2011), nearly no attention has been focused on this problem. The attention was also paid to the prediction of the exact values of the eggshell volume and surface using the Eqs (3)–(6).
MATERIAL AND METHODS
226 eggs from Landes geese were chosen for the experiment. Geese were kept in free range technolo-gy at a commercial breeding farm in Hodonín in the Czech Republic. Eggs were collected from 3-year-old geese. In order to describe the shape of egg samples the linear dimensions, i.e. length (L) and width (B), were measured with a digital calliper to the nearest 0.01 mm. These quantities were used for the evalu-ation of the shape index SI. The corresponding geo-metrical characteristics are given in Table 1.
In the second step the digital photos of the eggs were performed. The image analysis performed us-ing the Matlab software (ver. 7.12.0.635-R; Math-Works, Inc., Natick, USA) was used for the evalua-tion of the coordinates xi and yi of the egg contour. Instead of Cartesian coordinates the shape of the eggshell contour can be described using the polar coordinates r and j:
x = rcosj y = rsinj
The experimental points ri, ji were fitted by the Fourier series:
r=a0+ ⎡⎣aicos
( )
iwϕ +bisin( )
iwϕ ⎤⎦ i=1i=∞
∑
(8)where
a0, ai, bi, w – coefficients which were determined using of the Matlab software
Error= Ymeasured−Yfitted
Ymeasured
⎛ ⎝⎜
⎞
⎠⎟×100 (%) (9) where:
Ymeasured – y coordinate determined from the digital photo
Yfitted – y coordinate obtained from the Fourier series
The values of the radius of the curvature (R), egg surface (S) and the egg volume (V) are given by the equations of the differential geometry:
R= dx dϕ ⎛ ⎝⎜
⎞ ⎠⎟ 2
+ dy dϕ ⎛ ⎝⎜
⎞ ⎠⎟ 2 ⎡
⎣ ⎢ ⎢
⎤ ⎦ ⎥ ⎥ 3 2
dx dϕd
2y
dϕ2 −ddyϕd 2x
dϕ2
(10)
V=π r2
( )
ϕ φ1 φ2∫
sin2ϕdx( )
ϕdϕ dϕ, S=2π rsinϕ ddxϕ ⎛ ⎝⎜
⎞ ⎠⎟ 2
+ dy dϕ ⎛ ⎝⎜
⎞ ⎠⎟ 2
0
π
∫
dϕ(11)
V =π r2
( )
ϕφ1 φ2
∫
sin2ϕdx( )
ϕdϕ dϕ, S=2π rsinϕ ddxϕ ⎛ ⎝⎜
⎞ ⎠⎟
2
+ dy dϕ ⎛ ⎝⎜
⎞ ⎠⎟
2
0
π
∫
dϕThe next parameters which can be obtained are namely the area A of the egg normal projection and the long circumference length (l). These parame-ters are given by:
A=1
2
∫
r2dϕ l=∫
ds=∫
r dϕ (12) These parameters are given in Table 2.RESULTS AND DISCUSSION
The analysis of our data led to the conclusion that the first eight coefficients of the Fourier series are quite sufficient for the egg’s contour shape descrip-tion (the correladescrip-tion coefficient between measured and computed egg’s profiles lies between 0.98 and 1). Owing to some reasonable extent of this paper the values of these coefficients are not presented in this paper. They can be obtained upon request. In Fig. 1 an example of the egg’s contour curve is shown.
[image:3.595.65.534.103.276.2]This function is limited to very low values as can be seen in Fig. 2.
Table 1. Main geometric characteristics and mass of the tested eggs
Parameter Minimum Average Maximum STD
L (mm) 70.77 89.57 100.29 3.94
B (mm) 50.97 58.16 95.32 3.12
Dg (mm) 60.56 67.14 92.73 2.65
SI (%) 55.75 65.03 108.63 4.13
F 0.6774 0.7503 1.0567 0.0305
S (mm2) Eq. (3) 11,521.44 14,117.21 16,749.26 854.50
V (mm3) Eq. (4) 116,287.77 159,206.95 417,458.99 22,307.90
S (mm2) Eq. (5) 11,414.77 13,798.07 16,129.59 755.36
V (mm3) Eq. (6) 112,126.90 151,182.35 191,232.00 12,691.46
m (g) 126.15 163.69 215.35 14.44
L – egg length; B – egg width; SI – shape index; Dg – equivalent diameter; F – sphericity, S – eggshell surface; V – egg volume; STD – standard deviation
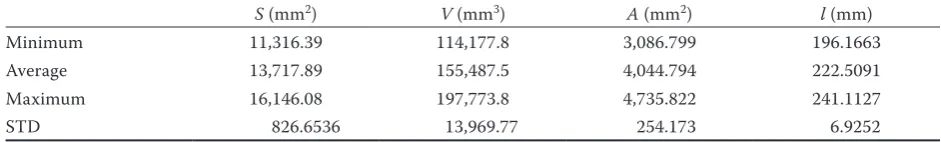
Table 2. Parameters given by the Eqs (11) and (12)
S (mm2) V (mm3) A (mm2) l (mm)
Minimum 11,316.39 114,177.8 3,086.799 196.1663
Average 13,717.89 155,487.5 4,044.794 222.5091
Maximum 16,146.08 197,773.8 4,735.822 241.1127
STD 826.6536 13,969.77 254.173 6.9252
[image:3.595.61.532.658.729.2]103
–40 –30 –20 –10 0 10 20 30 40
–60 –40 –20 0 20 40 60
W
id
th (mm)
Lenght (mm)
Fig. 1. Egg’s contour
0 0.1 0.2 0.3 0.4 0.5 0.6 0.7 0.8
–60 –40 –20 0 20 40 60
Er
ror (%)
Lenght (mm)
Fig. 2. Difference in the y coordinates of the egg’s contours
0 5 10 15 20 25 30
0 10 20 30 40 50 60 70 80 90
y
-c
oo
rdin
at
e (mm)
x-coordinate (mm)
Fig. 3. The egg’s contours computed from Eq. (2) and determined by the experimental data fitting
0 10 20 30 40 50 60 70
–60 –40 –20 0 20 40 60
Radiu
ls of
cu
rv
at
ur
e (mm)
x-coordinate (mm) Fig. 4. Radius of the curvature along the egg’s symmetry axis
In Fig. 3 the egg’s profile given by the Eq. (2) in Table 1 (Narushin approximation) is compared with that obtained from the digital photo. One can see that the difference is more pronounced than that shown in Fig. 1. The largest difference is ob-served near the sharp end. The knowledge of the mathematical description of the curve describing the egg’s contour enables to evaluate the radius of the curvature (Eq. 10). An example of this radius is given in the Fig. 4. The values of this radius were evaluated at the sharp and blunt ends of the egg. At the same time this radius was also evaluated at the point, xm, where the egg width reaches the value
B = 2y(xm). These radii of the curvature are dis-played in Fig. 5. A more detailed statistical analysis of the obtained results showed the independency of these curvature radii of the egg shape index SI. Val-ues of the egg curvature radii are given in Table 3.
11,000 12,000 13,000 14,000 15,000 16,000 17,000
55 60 65 70 75 80
Egg sur
fac
e (mm
2)
Egg shape index (%)
110,000 120,000 130,000 140,000 150,000 160,000 170,000 180,000 190,000 200,000
55 60 65 70 75 80
Egg volume (mm
3)
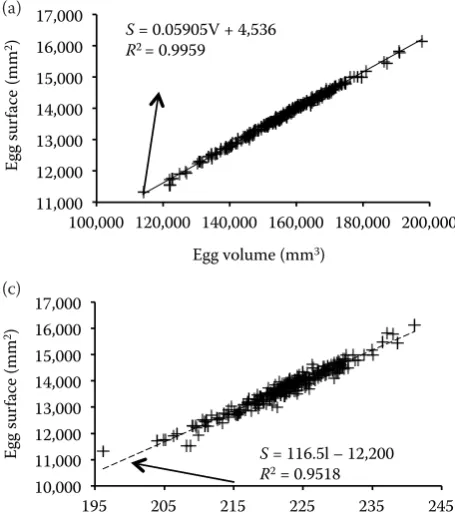
Egg shape index (%) At the same time there is a good correlation be-tween egg surfaces evaluated using Eq. (11) and egg surface S1 given by the Eq. (6) (Fig. 7a).
Owing to linear dependence of the egg volume on the egg surface (Fig. 7b) the knowledge of main egg
dimensions L and B is sufficient also for the predic-tion of this quantity.
The volume of the egg can also be determined by water displacement method using a sinker. The next egg characteristics which can be easily determined is
0 20 40 60 80 100 120 140
55 60 65 70 75 80
Radi
us of
cu
rv
at
ur
e (mm)
Egg shape index (%)
R1 (mm) R2 (mm) R3 (mm)
Fig. 5. Radii of the curvature for eggs of different shape
[image:5.595.66.531.87.348.2]R1–R3 – for explanation see Table 3
Table 3. Radii of the curvature
Minimum Average Maximum STD
R1 (mm) 12.57 15.71 21.68 1.387
R2 (mm) 14.64 21.10 26.84 1.844
R3 (mm) 41.15 61.25 125.20 9.624
xm (mm) 37.89 48.06 58.71 2.746
[image:5.595.65.317.465.754.2]R1 – radius at the sharp end; R2 – radius at the blunt end; R3 – radius of curvature in the equator plane, xm – x coordinate where the egg width reaches the value B = 2y(xm); STD – standard deviation
Fig. 6. Egg (a) surface and (b) volume as function of the egg shape
(a)
(b)
11,000 12,000 13,000 14,000 15,000 16,000 17,000
55 60 65 70 75 80
Egg sur
fac
e (mm
2)
Egg shape index (%)
110,000 120,000 130,000 140,000 150,000 160,000 170,000 180,000 190,000 200,000
55 60 65 70 75 80
Egg volume (mm
3)
105 the egg mass m and the long circumference length,
(Eq. 12). The dependence of the egg surface on the length (l) is shown in Fig. 7c. One can see that the correlation between egg mass and egg surface is rel-atively weak. The long circumference length can be used for very good estimation of the egg surface.
CONCLUSION
The analysis of the egg profile based on edge de-tection techniques was performed in this paper. The method described gives a representation of egg pro-file and such parameters as egg volume, surface, area, radius of curvature at any point on the egg surface.
The radii of the curvature at the important point of the egg profile (sharp end, blunt end and max. thick-ness) areindependent of the egg shape index.
The exact values of the egg surface and the egg volume were obtained. These quantities are also independent of the egg shape index. These quanti-ties can be successively estimated on the basis of Eqs (3)–(6) which are expressed in terms of the egg length and its width.
The surface area of the eggshells also exhibits good correlation with the egg long circumference length.
Generally, the eggshell surfaces can be estimated using the experimentally found values of the egg
volume (e.g. by the liquid displacement method) and/or long circumference length.
References
Altuntaş E., Şekeroğlu A., 2008. Effect of egg shape index on mechanical properties of chicken eggs. Journal of Food Engineering, 85: 606–612.
Baryeh E.A., Mangope B.K., 2003. Some physical properties of QP-38 variety pigeon pea. Journal Food Engineering,
56: 56–65.
Denys S., Pieters J.G., Dewettinck K., 2003. Combined CFD and experimental approach for determination of the surface heat transfer coefficient during thermal processing of eggs. Journal of Food Science, 68: 943–951.
Fabbri A., Cevoli C., Cocci E., Rocculi P., 2011. Deter-mination of the CO2 mass diffusivity of egg components by finite element model inversion. Food Research Inter-national, 44: 204–208.
Hamilton R.M.G., 1982. Methods and factors that affect the measurement of eggshell quality. Poultry Science, 61: 2022–2039.
Hoyt D.F., 1979. Practical methods of estimating volume and fresh weight of bird eggs. Auk, 96: 73–77.
[image:6.595.63.291.85.350.2]Li C.W., Chang J.C., Cheng C.W., Hsieh L.C., 2011.A novel non-destructive technology for inspecting eggshell cracks using impulsive response time.Food Science and Technology Research, 17: 1–10.
Fig. 7. The correlation between (a) values of egg surface area (Eqs 11 and 6), (b) the egg surface area vs. the egg volume (Eq. 11) and (c) egg surface vs. long circumference lenght
11,000 12,000 13,000 14,000 15,000 16,000 17,000
100,000 120,000 140,000 160,000 180,000 200,000
Egg su rf ac e (mm 2)
Egg volume (mm3)
S = 0.05905V + 4,536
R2 = 0.9959
11,000 12,000 13,000 14,000 15,000 16,000 17,000
11,000 13,000 15,000 17,000
Egg su rf ac e – nume ric S2 (mm 2)
Egg sufrace – estimation S1 (mm2)
S2 = 0.95S1 + 289.3
R2 = 0.9677
10,000 11,000 12,000 13,000 14,000 15,000 16,000 17,000
195 205 215 225 235 245
Egg su
rf
ac
e (mm
2)
Egg long circummference lenght (mm)
S = 116.5l – 12,200
R2 = 0.9518
11,000 12,000 13,000 14,000 15,000 16,000 17,000
100,000 120,000 140,000 160,000 180,000 200,000
Egg su rf ac e (mm 2)
Egg volume (mm3)
S = 0.05905V + 4,536
R2 = 0.9959
11,000 12,000 13,000 14,000 15,000 16,000 17,000
11,000 13,000 15,000 17,000
Egg su rf ac e – nume ric S2 (mm 2)
Egg sufrace – estimation S1 (mm2)
S2 = 0.95S1 + 289.3
R2 = 0.9677
10,000 11,000 12,000 13,000 14,000 15,000 16,000 17,000
195 205 215 225 235 245
Egg su
rf
ac
e (mm
2)
Egg long circummference lenght (mm)
S = 116.5l – 12,200
R2 = 0.9518 11,000 12,000 13,000 14,000 15,000 16,000
100,000 120,000 140,000 160,000 180,000 200,000
Egg su rf ac e (mm 2)
Egg volume (mm3)
S = 0.05905V + 4,536
R2 = 0.9959
11,000 12,000 13,000 14,000 15,000 16,000 17,000
11,000 13,000 15,000 17,000
Egg su rf ac e – nume ric S2 (mm 2)
Egg sufrace – estimation S1 (mm2)
S2 = 0.95S1 + 289.3
R2 = 0.9677
10,000 11,000 12,000 13,000 14,000 15,000 16,000 17,000
195 205 215 225 235 245
Egg su
rf
ac
e (mm
2)
Egg long circummference lenght (mm)
S = 116.5l – 12,200
R2 = 0.9518
(a) (b)
(c)
Kitching R., 1997. Pressurised eggshell analysis. Interna-tional Journal of Mechanical Sciences, 39: 391–396. Kumar V., Pheeng Wee A., Birla S., J Subbiah J.,
Thip-pareddi H., 2012. 3-D computational fluid dynamics model for forced air cooling of eggs placed in trays. Journal of Food Engineering, 108: 480–492.
Mänd R., 1998. Intrapopulational Variation of Avian Eggs. In: T. Sutt (ed.), Valgus, Tallinn Estonia.
Mohsenin N.N., 1970. Physical Properties of Plant and Ani-mal Material. New York, Gordon and Breach: 891. Narushin V. G., 1997. The avian egg: Geometrical
descrip-tion and calculadescrip-tion of parameters. Journal of Agricultural Engineering Research, 68: 201–205.
Narushin V.G., 2001a. Shape geometry of the avian egg. Journal of Agricultural Engineering Research, 79: 441–448. Narushin V.G., 2001b. What egg parameters predict best its shell strength? In: Proceedings of the IX. European Symposium on the Quality of Eggs and Egg Products. Kusadasi, Turkey: 349–355.
Narushin V.G., 2005. Production, modeling and education egg geometry calculation using the measurements of length and breadth. Poultry Science,84: 482–484.
Narushin V.G., Romanov M.N., 2002a. Physical character-istics of chicken eggs in relation to their hatchability and chick weight. World’s Poultry Science Journal, 58: 297–303. Narushin V.G., Romanov M.N., 2002b. Egg physical
characteristics and hatchability. World’s Poultry Science Journal, 58: 297–303.
Narushin V.G., Romanov M.N., Bogatyr V.P., 2002. Relationship between preincubation egg parameters and chick weight after hatching in layer breeds. Biosystems Enineering, 83: 373–381.
Nedomová Š., Severa L., Buchar J., 2009. Influence of hen egg shape on eggshell compressive strength. International Agrophysics, 23: 249–256.
Perianu C., De Keteleare B., Pluymers B., Desmet W., De Baerdermaker J., Decuypere E., 2010. Finite element approach for simulating the dynamic mechanical behaviour of a chicken egg. Biosystems Engineering, 106: 79–85. Romanoff A.L., Romanoff A.J., 1949. The Avian Egg. New
York, John Willey & Sons: 317.
Sabliov C.M., Farkas B.E., Keener K.M., Curtis P.A., 2002. Cooling of shell eggs with cryogenic carbon dioxide: a finite element analysis of heat transfer. Lebensmittel-Wissenshaft und Technologie, 35: 568–574.
Sarica M., Erensayin C., 2004. Poultry Products. Ankara, Bey-Ofset.
Schonwetter M., 1960. In: Meise W. (ed.), Handbuch der Oologie. Berlin, Akademie Verlag.
Zhou P., Zheng W., Zhao C., Shen C., Sun G., 2009. Egg volume and surface based on image analysis. In: Li D., Chunjiang Z. (eds), IFIP International Federation for Information Processing, Computer and Computing Technologies in Agriculture II, Boston, Springer, 295: 1647–1653.
Received for publication November 12, 2012 Accepted after corrections February 4, 2013
Corresponding author:
Prof. Ing. Jaroslav Buchar, DrSc, Mendel University in Brno, Faculty of Agronomy, Department of Physics, Zemědělská 1, 613 00 Brno, Czech Republic