The demographic development of human society is influenced by the economic, social and ecological development of the society and it influences at the same time the social life in the future periods (Jeníček 2010). So, economic and political changes affect strongly the demographic situation in the world and the czech society. A characteristic feature of the de-mography of advanced countries is the deterioration of the age structure and thereby the population aging. This trend shows itself also in the czech population. The share of the population of the third biological generation (over 65 year) starts to weight against the share of the population of the first biological
genera-tion (0–14 years) and the balanced age structure has changed into the regressive structure (Dufek and Minařík 2008, 2009).
Similarly, as the individual countries have their specif-ics in demographic development and there are certain differences among them, in the frame of one country – in its particular regions – a different demographic situation can happen (Spěšná 2009). it is necessary to pay a special attention to the demographic development analyses as they bring the information of the principle for the further economic development and prosperity of the given territory (Malečková et al. 2009; Šídlo and Tesárková 2009; Tesárková and Šídlo 2009).
Comparison of demographic development in the CR
and the EU countries
Komparace demografického vývoje v ČR a zemích EU
Libuše SVATOŠOVÁ
Faculty of Economics and Management, Czech University of Life Sciences,
Prague, Czech Republic
Abstract: Demographic development of human society is influenced by economic and political changes. The demographic development of most EU countries, including the czech republic, is characterized by the change of the age structure, the increase in the share of the third biological generation and thereby by aging of the population. These changes do not pro-ceed with the same intensity in all countries; there are differences in the development, both among the EU countries and also the regional ones in the frame of the country. The paper presents an evaluation of the demographic development in the EU countries and further in the particular cr regions. The aim is to judge the regional differentiation of this development and to find an analogy of the EU countries.
Key words: demographic development, structure of age, comparison of countries and regions
Abstrakt: Demografický vývoj lidské společnosti je ovlivňován ekonomickými i politickými změnami. Pro demografický vývoj většiny zemí EU a tedy i České republiky je charakteristická změna věkové struktury, zvýšení podílu třetí biologické generace a tím stárnutí populace. Tyto změny neprobíhají ve všech zemích se stejnou intenzitou, existují diference tohoto vývoje a to jak mezi zeměmi EU, tak i regionální v rámci země. V příspěvku je provedeno hodnocení demografického vývoje v zemích EU a dále v jednotlivých krajích Čr. cílem je posoudit regionální diferencovanost tohoto vývoje a nalézt obdobu se zeměmi EU.
Klíčová slova: demografický vývoj, věková struktura, komparace zemí a regionů
MEthodology And MAtERiAl
The aim of the study was to compare the demo-graphic development in the EU 27 countries, to define the groups of countries with a similar development, and to determine the cr position among these coun-tries. in the second stage, the individual cr regions were placed in the analysis with the aim to judge the regional differentiation of the demographical development and to determine the position of the regions among the EU countries.
The demographic situation of the EU countries and the cr regions was described by the help of seven indicators found out during the year 2008:
– natural increase per 1 000 population, expressed as the difference between the number of births and deaths in the given year
– total increase per 1 000 population (the difference between the number of births and deaths plus the migration balance in the given year)
– number of births per 1 000 population
– Medium length of men and women life (life ex-pectancy – an average number of years lived by a newborn within the maintenance of the present mortality rate)
– index of dependence of young expressed as the share of the population of the age group up to 15 years to the population of age 15–64 years – index of dependence of old (the share of the
popu-lation of age over 65 year to the popupopu-lation of the age of 15–64 years)
– index of Age (the share of the population over 65 years to the population of the age up to 15 years) (Koschin 2000)
The presented indicators were evaluated in the EU countries at first separately; subsequently the indica-tors were summarized in an aggregated one.
For the aggregation, as a basis, a point method was used when for each indicator a country (a region) is found, in which the relevant indicator reaches the maximum value (if the indicator value growth is a progressive phenomenon) or the minimum value (if the indicator value decrease is desirable). The selected indicator of this country has the value of 1 000 points. Then, other countries are scored from 0 to 1 000 according to how many pro milles their value amounts to of the maximum value. in the case that the base is the minimum value of the indicator, a reversal value of this ratio is made. Then, the sum of points characterizes the country´s level from the given view-point and enables to form an order, respectively groups of countries with a similar development (Jílek et al. 2001).
As a second possibility of the groups of countries formation, there was used the cluster analysis method. The aim of the mentioned analysis is to classify the given collection of units characterized by a group of characters, into several relatively homogenous groups (clusters), so that the objects inside the clusters would be as similar as possible and the units belonging to different clusters would be similar as least as possible. The result of the analysis depends on the choice of the variable, the chosen rate of distance among the objects and clusters, and on the chosen calculation algorithm. regarding the data character and the requirement of the formation of clusters of roughly the same size, the Ward method (hebák 2005), expressed from the matrix of Euclidean distances, was chosen.
Both the methods brought similar, however, not completely identical results. in some countries, a slight change in the order occurred. nevertheless, these changes were never fundamental. For the reason of a better clearness and comprehensibility as well as ease of calculation, the point method was used for the total evaluation.
REsUlts And disCUssion Comparison of particular indicators of demographic situation in the EU states
The highest variability is showed by the indicator of the natural increase of population. in this case, ireland significantly differs, with the value of the natural increase of population almost 10 inhabitants per 1 000 population which more than doubly exceeds the value of the natural increase of France, second in the order. The czech republic with the increase 0.97 per 1 000 population ranks to the centre in the countries order (13th place). Portugal, italy, Estonia, germany, romania, hungary, Lithuania, Latvia and Bulgaria have a negative increase in this period; it is considerable in hungary, Lithuania and Latvia; the highest level is reached in Bulgaria – it represents a decrease by almost 5 inhabitants per 1 000 popula-tion (Table 1).
in the number of births per 1 000 population, ireland with 16.2 live births per 1 000 population significantly differs. This indicator value moves in other countries in the range of 8.3–12.7. The lowest number of live births per 1 000 population is showed by germany (Figure 2).
The medium life length in all the EU countries is higher in women. This indicator is also less variable
here. The highest medium life length of women can be recorded in Spain and France (84.4); the lowest medium life length is in Latvia and romania (76.2). in men, the highest medium life length is in Sweden and in cyprus (78.8), the lowest is in Latvia and Lithuania (65.3).
[image:3.595.66.532.205.701.2]The age structure of the population can be evaluated according to the index of age and further according
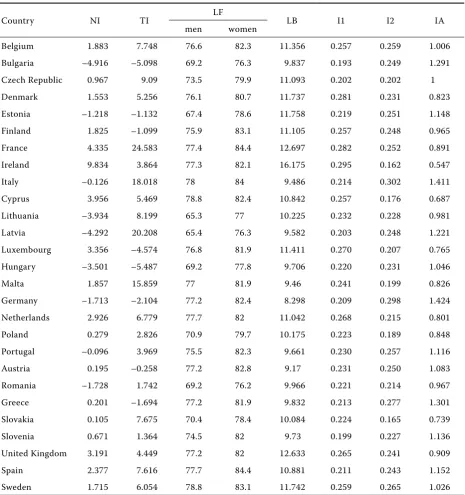
Table 1. Selected demographic indicators in the EU countries (2008)
country ni Ti LF LB i1 i2 iA
men women
Belgium 1.883 7.748 76.6 82.3 11.356 0.257 0.259 1.006
Bulgaria –4.916 –5.098 69.2 76.3 9.837 0.193 0.249 1.291
czech republic 0.967 9.09 73.5 79.9 11.093 0.202 0.202 1
Denmark 1.553 5.256 76.1 80.7 11.737 0.281 0.231 0.823
Estonia –1.218 –1.132 67.4 78.6 11.758 0.219 0.251 1.148
Finland 1.825 –1.099 75.9 83.1 11.105 0.257 0.248 0.965
France 4.335 24.583 77.4 84.4 12.697 0.282 0.252 0.891
ireland 9.834 3.864 77.3 82.1 16.175 0.295 0.162 0.547
italy –0.126 18.018 78 84 9.486 0.214 0.302 1.411
cyprus 3.956 5.469 78.8 82.4 10.842 0.257 0.176 0.687
Lithuania –3.934 8.199 65.3 77 10.225 0.232 0.228 0.981
Latvia –4.292 20.208 65.4 76.3 9.582 0.203 0.248 1.221
Luxembourg 3.356 –4.574 76.8 81.9 11.411 0.270 0.207 0.765
hungary –3.501 –5.487 69.2 77.8 9.706 0.220 0.231 1.046
Malta 1.857 15.859 77 81.9 9.46 0.241 0.199 0.826
germany –1.713 –2.104 77.2 82.4 8.298 0.209 0.298 1.424
netherlands 2.926 6.779 77.7 82 11.042 0.268 0.215 0.801
Poland 0.279 2.826 70.9 79.7 10.175 0.223 0.189 0.848
Portugal –0.096 3.969 75.5 82.3 9.661 0.230 0.257 1.116
Austria 0.195 –0.258 77.2 82.8 9.17 0.231 0.250 1.083
romania –1.728 1.742 69.2 76.2 9.966 0.221 0.214 0.967
greece 0.201 –1.694 77.2 81.9 9.832 0.213 0.277 1.301
Slovakia 0.105 7.675 70.4 78.4 10.084 0.224 0.165 0.739
Slovenia 0.671 1.364 74.5 82 9.73 0.199 0.227 1.136
United Kingdom 3.191 4.449 77.2 82 12.633 0.265 0.241 0.909
Spain 2.377 7.616 77.7 84.4 10.881 0.211 0.243 1.152
Sweden 1.715 6.054 78.8 83.1 11.742 0.259 0.265 1.026
ni = natural increase of population per 1 000 population; Ti = Total increase of population per 1 000 population; LF = Life expectancy; LB = Live births per 1 000 population; i1 = index of dependence of young; i2 = index of dependence of old; iA = index of age
to the index of the dependence of young and the in-dex of the dependence of old. The most favourable values of the index of age can be recorded in the economically strong countries of the EU as germany (1.42) and italy (1.41), but also in greece, Bulgaria and Latvia (1.3). A favourable value of this indicator is in ireland (0.54) and further in cyprus, Slovakia, Luxembourg, where the share of young people up to 15 years rises more significantly. A slight predominance of young generation is in the group of countries
as-sociating the netherlands, Denmark, Malta, Poland, the United Kingdom, Finland and Lithuania. The czech republic has a balanced proportion of these two generations.
The index of the dependence of young reaches the highest values in France, ireland and Denmark (0.28), the lowest in Slovakia and the czech republic (0.2). The index of dependence of old is the highest in italy and germany (0.3), the lowest in ireland and cyprus (0.17).
-6 -4 -2 0 2 4 6 8 10 12 Ir el an d Fr an ce C yp ru s Lu xe m bo ur g U ni te d K in gd om N eth er la nd s Sp ain B el gi um Malta Fi nl an d Sw ed en D en m ar k C ze ch R ep ub lic Sl ov en ia Polan d G re ec e A us tria Sl ov ak ia Po rtug al Ita ly Es to ni a G er m an y R om an ia H un ga ry Li th ua ni a Latvia B ul ga ria N at ur al in cr ea se p er 1 00 0 po pu la tio n -10 -5 0 5 10 15 20 25 30 Fr an ce La tv ia Ita ly M alta Cz ec h Re public Lithuan ia B el gi um Sl ov ak ia Spain Netherlan dsSweden Cyp
[image:4.595.65.516.216.434.2]ru s D en m ar k U ni te d K in gd om Po rtu ga l Ir el an d Po la nd R om an ia Sl ov en ia A us tri a Finlan d Es to nia G re ec e G er m an y Lu xe m bo ur g B ul ga ria H un ga ry To ta l i nc re as e pe r 1 00 0 po pu la tio n
[image:4.595.67.508.481.725.2]Figure 1. EU: natural increase of population (year 2008) Source: czech Statistical office, Eurostat
Comparison of demographic study in the EU states by the help of aggregated indicator
The foregoing part evaluated the selected demo-graphic indicators separately. To be able to describe the demographic situation of the particular states comprehensively and to create groups of states with a similar development, the cluster analysis method and the point method were used. regarding the fact that the results were similar and the classification in the groups did not differ, the following text presents the point method results from which also the order of particular states is evident.
on the base of this method, it was possible to de-termine four groups of countries (Table 2).
The first group is represented by ireland and France. These countries have a favourable demographic devel-opment. ireland has the highest values of the natural increase, the number of births, then the most fa-vourable index of age, the index of the dependence of young and the index of the dependence of old of all EU states. With the medium life length, it ranks among the first ten EU countries in the order. The total increase does not belong among the highest. Population increases are the consequence of a high birth rate that is reflected also in the favourable age structure of the population. France has the highest total population increase, a high natural increase, high values of the medium life length and an acceptable age structure of population.
[image:5.595.74.517.70.275.2]For countries associated in the second group, in which also the czech republic is included, for which a positive natural increase and a higher total increase,
Table 2. groups of countries with the similar demographic situation
group country
i. irelandFrance
ii.
cyprus Malta netherlands United Kingdom Denmark Slovakia Luxembourg Belgium Sweden Spain
czech republic
iii.
italy Poland Finland Portugal Slovenia Latvia Austria
iV.
romania Lithuania greece Estonia germany hungary Bulgaria
Source: czech Statistical office, Eurostat
0 0.2 0.4 0.6 0.8 1 1.2 1.4 1.6
Ir
el
an
d
C
yp
ru
s
Sl
ov
ak
ia
Lu
xe
m
bo
ur
g
N
et
he
rla
nd
s
D
en
m
ar
k
M
alta
Po
la
nd
Fr
an
ce
U
ni
te
d
K
in
gd
om
Fi
nl
an
d
R
om
an
ia
Li
th
ua
ni
a
C
ze
ch
R
ep
ub
lic
B
el
gi
um
Sweden Hun
ga
ry
A
us
tria
Po
rtu
ga
l
Sl
ov
en
ia
Es
to
ni
a
Sp
ai
n
La
tv
ia
Bulg
aria
G
re
ec
e
Ita
ly
G
er
m
an
[image:5.595.305.531.430.747.2]y
Figure 3. EU: index of age (year 2008) Source: czech Statistical office, Eurostat
The countries forming the third group can be evalu-ated as the countries with an average demographic situation, where only some indicators can be con-sidered as problematic. italy has a negative natural increase but, thanks to migration, also a high total population increase, a high medium life length and less favourable age structure of population. Poland has positive, though low values of the natural and total increase, a lower medium life length and a good age structure of population. Finland has a positive natural increase but a negative total increase, a high medium life length and a relatively good age structure of population. Portugal is characterized by a negative natural increase but a positive total increase of popu-lation, a high medium life length and less favourable age structure of population. Slovenia has positive, even if low values of the natural and total increase of population and a less favourable age structure of population. Latvia shows a negative natural increase of inhabitants, an unfavourable age structure, but a high total increase of population. Austria has a posi-tive natural increase, but a negaposi-tive total increase of population, a higher medium life length and a less favourable age structure of population. Austria has a positive natural increase but a negative total increase of population, a higher medium life length and a less favourable age structure of population.
The fourth group associates the countries in which the separately evaluated indicators of demographic development belong mostly to the substandard or even to the end of the countries order. All the mentioned countries except greece have a negative natural and
total increase, an average or below the average value of the medium life length and a worse age structure.
Classification of CR regions in complex evaluation of demographic situation
The czech republic as a whole was classed as the last in the second group of the EU countries. Thereby, an average situation was described. however, the situation in the particular cr regions, the same as in the particular EU countries, differs. The above evaluation helped to evaluate the differentiation of
0 1000 2000 3000 4000 5000 6000 7000 8000 Ir ela nd Fr an ce R eg io n ST C C yp ru s Malta N et he rla nd s U ni te d K in gd om R eg io n LI B R eg io n Pr ah a D en m ar k R eg io n PLZ R eg io n U ST Sl ov ak ia Lu xe m bo ur g B el gi um Sw ed en R eg io n K V R eg io n PU Spain C ze ch R ep ub lic R eg io n JM R eg io n JC R eg io n V Y S R eg io n H K Ita ly Po la nd Fi nl an d R eg io n O L R eg io n MS R eg io n ZL
Portugal Slov
[image:6.595.305.531.281.460.2]in ia Latv ia A us tri a R om an ia Li th ua ni a G re ec e Es to ni a G er m an y H un ga ry B ul ga ria Po in ts
[image:6.595.68.521.490.729.2]Figure 4. Demographic development – the EU and czech regions – aggregate (year 2008) Source: own calculations
Table 3. groups of the cr regions with similar demographic situation accordant with groups of the EU countries
group region
i. central Bohemia
ii. Liberec Prague Pilsen Ústí Karlovy Vary Pardubice South Moravia iii. South Bohemia Vysočina hradec Králové olomouc Moravia-Silesia zlín
the demographic development in the cr regions. Data about the cr regions were included into the model and the regions were classed in the above mentioned groups of the EU countries (Table 3).
The czech republic can be classified from the view-point of the demographic situation as the EU average. From the regions with a better than average state, mainly the region central Bohemia earmarks, with the favourable values of both the natural and the total increase of population, and also the age structure. regions classified in the second group can be evaluated as the average. in the regions of the third group, already some problematic indicators can be observed. Mostly it regards the low values of the natural and total increase and a less favourable age structure of population. nevertheless, the natural and the total increase of population are always positive. none of the cr regions was included in the fourth, the most problematic group (Figure 4).
ConClUsion
From the presented, it is evident that there is a dif-ference in the demographic development both in the EU countries and the cr regions. The demographic situation of the cr as a whole can be evaluated in comparison with the EU countries as the average or better than the average. regarding the classification of the cr regions in the evaluation, it can be stated that in fact the situation is not completely favour-able from all the observed view-points in any region. Even if the numbers of births increased in last years and the natural increase gets into positive figures, the fact is that the population aging shows itself still more and more. A similar situation is in most of the developed countries.
A positive finding is that none of the regions was classified in the last group of countries where the demographic development can be evaluated as un-favourable and, from the view-point of the future, as warning.
The paper was elaborated in the frame of the solution of the research intention MŠMT-MSM 6046070906,
the stage 6.2.1 “Modelling and prognostication of development of decisive indicators of economic and social development in the cr and in the context of the EU”.
REfEREnCEs
Demographic Yearbooks of cr (2009). czech Statistic office, Scientia, Praha.
Eurostat. Available at http//epp.eurostat.ec.europa.eu Dufek J., Minařík B. (2008): Ageing of czech population
and the development of load of productive population. Mendelova zemědělská a lesnická univerzita, Brno; iSBn 978-80-7375.
Dufek J., Minařík B. (2009): Age of population and the development of population ageing in the regions of the czech republic. Agricultural Economics – czech, 55: 259–270.
hebák P. et al. (2005): Vícerozměrné statistické metody (3) (Multidimensional statistic methods – 3). informa-torium, Prague; iSBn 80-7333-039-3
Jeníček V. (2010): World population – development, transi-tion. Agricultural Economics – czech, 56: 1–15. Jílek et al. (2001): základy sociálně ekonomické statistiky
(Bases of social-economic statistics ). VŠE, Prague. Koschin F. (2000): Demografie poprvé (Demography for the
first time). VŠE, Prague; iSBn 80-245-0125-2.
Malečková r., Mazouch P., Sivková o., Vojtková M. (2009): Aktuální populační prognózy České republiky – srovnání vstupních předpokladů (Actual population forecasts of the czech republic – comparison of basic assumptions). Demografie, 51: 77–86.
Spěšná D., Pospěch P., nohel F., Drlík J., Delin M. (2009): Aging of the agricultural workforce in relation to the agricultural labour market. Agricultural Economics – czech, 55: 424–435.
Šídlo, L., Tesárková, K. (2009): Aktuální populační prognózy České republiky – porovnání výsledků (Actual popula-tion forecasts of the czech republic – results collapopula-tion). Demografie, 51: 87–100.
Tesárková K., Šídlo L. (2009): Vybrané možnosti hodnocení populačních prognóz (Severeal methods of accuracy evaluation of population). Demografie, 51: 101–114.
Arrived on 4th March 2010
Contact address:
Libuše Svatošová, czech University of Life Sciences Prague, Kamýcká 129, 165 21 Prague 6-Suchdol, czech republic