Author(s): Geoffrey Bessardon, Colm Clancy, Conor Daly, Rónán Darcy, Emily Gleeson,
Alan Hally, Eoin Whelan
This article is provided by the author(s) and Met Éireann in accordance with publisher
policies. Please cite the published version.
Citation: Bessardon, G., Clancy C., Daly., C., Darcy, R., Gleeson, E., Hally, A., Whelan, E.
Met Éireann Updates. ALADIN-HIRLAM Newsletter 14: 70-78, 2020.
Met Éireann Updates
Geoffrey Bessardon, Colm Clancy, Conor Daly, Rónán Darcy, Emily Gleeson, Alan Hally, Eoin Whelan
1
Introduction
Cycle 40h1 of HARMONIE-AROME has been operational at Met Éireann since May 2018, with the short-range Irish Regional Ensemble Prediction System (IREPS) running since October 2018. Details of this config-uration may be found in a previous newsletter (Clancy et al., 2019). In August 2019, a technical upgrade to this operational NWP suite was carried out. This is described in detail in Section 2. In November, the SAPP system from ECMWF was made operational for the pre-processing of observations; details are given in Section 3. Recent work on model physiography is discussed in Section 4, while some information on MUSC development is provided in Section 5. Finally, updates on the MÉRA reanalysis project are given in Section 6.
2
Operational Upgrade
A technical upgrade to the operational suite (o-suite) was carried out in August 2019. The changes applied are summarised in Table 1 and are described in more detail below.
Table 1: Summary of changes in the technical upgrade
Model component Description
Dynamics Adjust vertical momentum equation
Dynamics Change spectral grid from linear to quadratic
Data assimilation Assimilate radiances from AMSU-A, MHS and IASI satellite instruments Data assimilation Assimilate METOP-C ASCAT winds
Ensemble Update SLAF coefficients, SLAFLAG values and surface perturbations
2.1 Forecastmodel
During winter 2018/2019 noisepatterns wereobserved inthe MSLP forecasts producedby ouroperational HARMONIE-AROME.Investigations revealedthatthesecould be removedby changingtwo parameters re-latedtotheformoftheverticalmomentumequation: i.e.changing{LGWADV,LRDBBC}fromtheirdefault {FALSE,TRUE}to{TRUE,FALSE}.TheselattervaluesarealreadyinuseatMétéoFranceandanumberof ALADINcountries.TheeffectsofthesechangescanbeclearlyseenfromexperimentsshowninFig.1. Longer testswerecarriedoutwiththesechanges,andshowednosignificantdifferencesinforecastquality.
Figure 1: Plots of MSLP before (left) and after (right) the changes made to HARMONIE-AROME (40h1.1) fol-lowing experiments with {LGWADV,LRDBBC} options. Left: default {FALSE,TRUE}. Right: {TRUE,FALSE}.
2.2 Data Assimilation
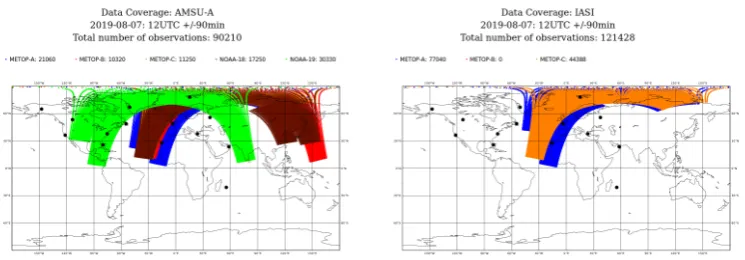
The technical upgrade also brought the assimilation of radiance data from the AMSUA-A, MHS and IASI instruments on board EUMETSAT and NOAA polar orbiting satellites. Met Éireann receives satellite data used in NWP via the EUMETSAT Advanced Retransmission Service (EARS) Regional Service. Figure 2 shows typical data coverage for AMSU-A and IASI observations.
Figure2: DatacoverageofAMSU-A(left)andIASI(right)observationsfor1200UTC7th August2019. The blackdotsindicatethelocationofEARSreceivingstations.
Itisassumedbymanydataassimilationalgorithmsthatobservationshaveunbiased(Gaussian)errors. However, itisknownthatsatelliteobservationerrorshavebiasesthatmustbecorrectedbeforeuseinNWP. HARMONIE-AROME uses a technique known as Variational Bias Correction (VarBC) (Auligné et al., 2007) to correct satelliteobservationbiases. VarBCcoefficientsarecalculatedoverasuitableperiod(typicallyonemonth)and thencorrectionsareappliedtoradianceobservationsaspartoftheHARMONIE-AROME3D-Varminimization process.FurtherdetailsontheapplicationofVarBCintheHARMONIE-AROMEsystemareavailableArriola etal. (2016). VarBCcoefficientsf orA MSU-A,M HSa ndI ASId ataa ssimilatedi nt heo perationaldomain werecalculatedduringAugust2018. Appropriateblacklistingofsatelliteswasappliedtakingorbittimesinto account.Astheoperationaldomainismainlyocean,radiancedataoverlandwasalsoblacklisted.Examplesof time-seriesoftheconvergenceofVarBCcorrectionsappliedtoradiancedataareshowninFig.3.
[image:3.595.112.485.385.515.2]Figure 3: Time-series of average first-guess departures for Metop-B MHS Channel 4 (left) and NOAA-18 AMSU-A Channel 9 are show. "Raw" (green dots, numbers) and bias corrected (orange dots) departures are illustrate the benefits of applying VarBC to the data.
[image:4.595.101.487.332.473.2] [image:4.595.99.491.539.685.2]producing 24 hour forecasts at 0000 UTC and 1200 UTC, assimilating radiance data also ran for the same period. Forecasts produced by both experiment were then validated using SYNOP and TEMP observations. There was a slight positive improvement in scores MSLP and results for near-surface parameters were neutral, Fig. 4. There were improvements in forecasts of geopotential heights and humidity parameters in the middle atmosphere, Fig.5.
Figure 4: Validation of MSLP forecasts compared to SYNOP observations (right) and the significance of these results (right). Control (conventional + ASCAT) statistics are shown in red and radiance experiment statistics are shown in green.
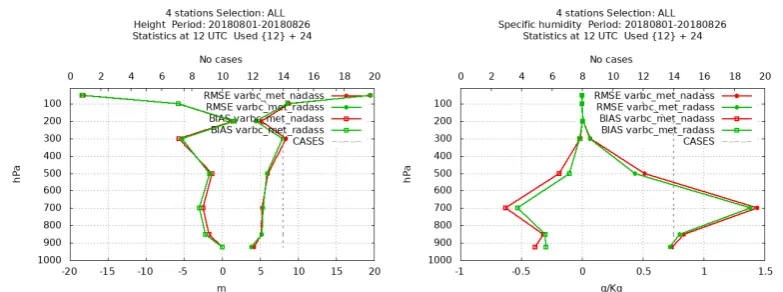
Figure 5: Validation of geopotential (left) andhumidity (right) forecasts compared toTEMP observations. Control(conventional +ASCAT)statistics areshowninredandradianceexperimentstatistics areshownin green.
2.3 Deterministic Verification
The deterministic configuration of the technical upgrade (e-suite) was put into parallel operational and cycled for a number of months to spin up the surface processes. The main parallel test period covered June and July 2019, with 48-hour forecasts beginning at 0000 UTC and 1200 UTC. Figure 6 shows sample surface verification scores for 10 m wind speed and 2 m temperature parameters. Some minor differences are visible but overall the average forecast quality is comparable, with no obvious degradation from the use of the quadratic grid. Verification of some vertical profiles is given in Fig. 7. Results are, again, broadly neutral. Perhaps the most notable feature is an improvement in upper level relative humidity (bottom panels), due to the assimilated radiance observations that provide information at these levels.
Figure6:Pointverificationoftheo-suite(red)andthee-suite(green)forthetestperiodinJuneandJuly2019. Forecastsbeginat0000UTC(left)and1200UTC(right).Parametersshownare10mwind-speed(above)and 2mtemperature(below).
2.4 EnsembleSystem
TestingonanumberofaspectsrelatedtotheIREPSconfigurationwasundertakeninordertopinpointpotential usefultechnicalupgradestotheo-suite. Theimplementationoftheperturbedanalysis(PertAna)approachof representinginitial conditionuncertaintywas investigated butdiscountedduetounacceptable noisepatterns developinginthefirstfewhoursoftheforecast.
Figure 7: Vertical profile verification of the o-suite (red) and the e-suite (green) for the test period in June and July 2019. Verification is for forecasts valid at 0000 UTC (left) and 1200 UTC (right). Parameters shown are geopotential (above) and relative humidity (below).
[image:6.595.104.490.476.654.2]forecasts which are valid at the same time. The SLAFLAG values determine the number of hours lag between the two forecasts. Table 2 shows the updates applied to the SLAF coefficients and SLAFLAG values.
Table 2: Previous and updated SLAF coefficient and SLAFLAG values for IREPS
Member Old SLAF coeff New SLAF coeff Old SLAFLAG New SLAFLAG
0 0.0 1.0 0 0
1 1.75 1.60 6 12
2 -1.75 -1.60 6 12
3 1.5 1.4 12 18
4 -1.5 -1.4 12 18
5 1.2 1.2 18 24
6 -1.2 -1.2 18 24
7 1.0 1.0 24 30
8 -1.0 -1.0 24 30
9 0.9 0.86 30 36
10 -0.9 -0.86 30 36
Perturbationsofthesnowdepthparameter,vegetationfraction,leafareaindex(LAI)andsoilthermalcoefficient weredeactivated.Themeanbias(Fig.8)in2mtemperature,10mwindspeedand2mrelativehumidity,shows the positive impact of these modifications.T he3 p arametersr esulti na l owerm eanb iasc omparedt othe reference experiment. This isparticularly importantfor 2 m temperature giventhat HARMONIE-AROME cycle40h1.1suffersfromanegative2mtemperaturebiasoverIreland.
Figure 8: Mean bias in 10 m wind speed, 2 m relative humidity and 2 m temperature for experiments related to modifications in the surface perturbations. The updated surface perturbation set-up is shown in black, a reference experiment is in blue and an experiment with no perturbations to the snow depth parameter is in orange.
Figure 9: Spread-skill scores for IREPS (orange) and IFSENS (black) for 10m-wind speed for the month of November 2019.
3
Implementation of SAPP
3.1 Introduction
Met Éireann has usedthe Automatic Data Extraction system (ADE) toproduce observational(BUFR) data readable byouroperationalNWP systems. The ADEwas developedinthe1990’sandisbasedon software developed by ECMWF supplementedby localadaptations andquality control functions. With the changes informats usedto transmitdata on theGTS (TACto BUFR)and theavailability ofnewobservational data streamsthe rigidityoftheADEdesignwas apparent andwashinderingprogress withour operationalNWP systemdevelopment.
InMay2016MetÉireann contactedECMWF staffrequesting accesstoacopyoftheirSAPP(Scalable Ac-quisitionandPre-Processing)System. Aseries ofvideomeetingsfollowedandMetÉireannhosteda SAPP workshopin2017whichwasattendedbyECMWFstaffandHIRLAMcolleagues. In2018ECMWFCouncil approved a newOptional Programme tomake SAPP available toMember andCo-operating States. During 2018and2019MetÉireannstaff(EoinWhelan,SarahGallagher,RónánDarcyandJamesBrennan)installed anddevelopedtheSAPPsystemforoperationaluse.
[image:7.595.110.492.271.417.2]ob-servations used in NWP. With SAPP more conventional obob-servations are now available for operational data assimilation. New observation types, such as wind profiler and GNSS, are also available for testing and planned use in the next version of IREPS.
3.2 Operational implementation
[image:8.595.109.490.266.374.2]ECMWF have provided the SAPP system as a virtual machine (VM). Two instances of SAPP (vsapp02a/b) have been installed in Met Éireann’s virtual environment and have been running in pre-operational mode since June 2019. Both VMs process conventional observational data received from the GTS. The extraction of data for use in operational NWP has been tailored to Met Éireann’s needs. A “short cut-off” (sc) stream has been implemented for use by IREPS and “nowcast” (nc) data stream has been implemented for a planned HAR-MONIE based nowcasting system to be developed in 2020. The use of BUFR data produced by SAPP was made operational for the 1200 UTC forecast on 19 November 2019.
Figure 10: Radiosonde temperature observations assimilated by IREPS on the 18th(left) using ADE BUFR and (right) on the 19thusing SAPP BUFR
4
Surface
A summary of recent preliminary work in the area of physiography, carried out by staff working at Met Éireann may be found at: https://hirlam.org/trac/attachment/wiki/Meetings/Surface/Surface201911/nwp-note-201907.pdf
As this is the first time we have looked at the physiography-related datasets over Ireland, we began by com-paring the sand and clay maps in HARMONIE-AROME Cycle 43 FAO, SOILGRIDS, HWSD) with a locally available dataset created by an Irish organisation called Teagasc. As the local dataset only covers the Republic of Ireland, with Northern Ireland excluded, it was necessary to blend the local dataset with the maps available over the HARMONIE-AROME experiment area for our tests. We also looked at the ECOCLIMAP-SG land cover dataset and LAI input.
A brief summary of our findings to date is given below. More extensive testing is planned for the coming months using off-line SURFEX. We are also looking for other local datasets that could potentially be of use and we are investigating the possibility of using machine learning to extract useful parameters from mapping imagery such as Google Street View and OpenStreetMap.
1. Soil & Clay: A the SOILGRID and SOILGRID-BLEND (where SOILGRID-BLEND = SOILGRID + local data) soil and clay maps are similar, and significantly different to the lower resolution FAO maps, the SOILGRID maps can be considered to be of superior quality. The SOILGRID-BLEND maps provide additional local information, not included in SOILGRID, and are therefore the preferred choice. Testing using SURFEX in offline mode has commenced to get a better handle on sensitivities.
being resolved. Initial comparisons between SG and a small subset of the Ordnance Survey Ireland Prime 2 dataset have been made but so far no 3D or offline SURFEX runs have been made. It is not trivial to map the cover types in Prime 2 to those in SG to aid comparisons so this work is on-going.
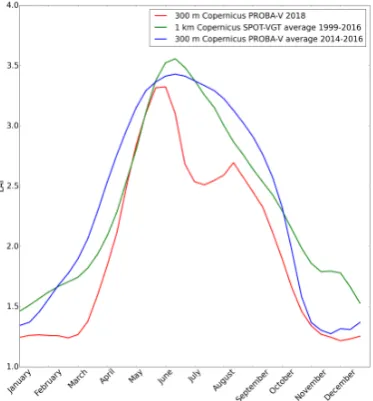
[image:9.595.203.390.269.470.2]3. Leaf Area Index: The climatologies of LAI used in HARMONIE-AROME are not sufficient for years that vary greatly from normal. An example of this occurred during the summer of 2018 when Ireland suffered a serious drought which resulted in the normally green island, turning a shade of brown. Figure 11 shows the large difference between the LAI in July 2018 and that of the climatologies used in HARMONIE-AROME and highlights the need for assimilating LAI data rather than using climatologies. Offline experiments are underway to investigate the differences between using satellite LAI for 2018 compared to multiyear climatologies.
Figure 11: Annual cycle of mean LAI over Ireland plotted using: 300 m LAI data for 2018 from the Copernicus PROBA-V satellite (red), the Copernicus satellite SPOT-VGT LAI data averaged over the period 1999-2016 (green), the Copernicus satellite 300 m LAI data averaged over the period 2014-2016 (blue).
5
MUSC
The scripts that we have developed to run test cases of MUSC in HARMONIE-AROME Cycle 43 are document on the hirlam.org wiki under https://hirlam.org/trac/wiki/HarmonieSystemDocumentation/MUSC. Stephen Out-ten, who works at NERSC in Norway, developed a virtual box version of MUSC. Details about the installation of this are also provided on the MUSC wiki page. Further test cases will be added over the coming months.
6
MÉRA
(https://www.met.ie/science/events/mera-workshop-2019) last May and invited presentations by representatives from Copernicus reanalysis projects were included on the programme. Presentation slides and the workshop proceedings are available on the website.
[image:10.595.100.498.139.299.2]A new Irish reanalysis project, MÉRA-2, is planned for the coming years which will involve use of ECMWF ERA5 boundary conditions, a new version of HARMONIE-AROME and other useful upgrades.
Figure 12: MÉRA users workshop May 2019, National Botanic Gardens, Dublin.
7
Summary and Outlook
The past year has seen some significant NWP developments at Met Éireann. Significant work in the area of NWP during 2019, including the assimilation of radiance data and the operational implementation of SAPP, should put Met Éireann on a good footing for the coming years.
Early in 2020 five members of IREPS will start to run operationally on KNMI’s HPCF with the other members continuing to run at ECMWF’s HPCF. The operational version of HARMONIE-AROME will be upgraded from cycle 40h1.1 to 43h2.1 in the third quarter of 2020. Other planned NWP developments include the implementation of an NWP based nowcasting system, the assimilation of GNSS data and the evaluation of locally received Mode-S observations.
8
References
Arriola, J.S., M. Lindskog, S. Thorsteinsson, and J. Bojarova, 2016: Variational Bias Correction of GNSS ZTD in the HARMONIE Modeling System, J. Appl. Meteor. Climatol., 55, 1259–1276, https://doi.org/10.1175/JAMC-D-15-0137.1
Auligné, T. , McNally, A. P. and Dee, D. P., 2007: Adaptive bias correction for satellite data in a numerical weather prediction system, Q.J.R. Meteorol. Soc., 133: 631–642. doi:10.1002/qj.56
Clancy, C., Daly, C., Darcy, R., Gleeson, E., Hally, A. and Whelan, E., 2019: Met Éireann Updates. ALADIN-HIRLAM Newsletter No. 12.
Gleeson, E., Whelan, E., and Hanley, J.: Met Éireann high resolution reanalysis for Ireland, Adv. Sci. Res., 14, 49–61, https://doi.org/10.5194/asr-14-49-2017, 2017