Proceedings of NAACL-HLT 2018, pages 1886–1895
Sentiment Analysis: It’s Complicated!
1*Kian Kenyon-Dean,1*Eisha Ahmed,1†Scott Fujimoto,1†Jeremy Georges-Filteau, 1†Christopher Glasz,1†Barleen Kaur,1†Auguste Lalande,1#Shruti Bhanderi, 1#Robert Belfer,1#Nirmal Kanagasabai,1#Roman Sarrazingendron,1#Rohit Verma,
and2Derek Ruths
1,2McGill University, Department of Computer Science
1 {first.last}@mail.mcgill.ca
Abstract
Sentiment analysis is used as a proxy to mea-sure human emotion, where the objective is to categorize text according to some prede-fined notion of sentiment. Sentiment anal-ysis datasets are typically constructed with gold-standard sentiment labels, assigned based on the results of manual annotations. When working with such annotations, it is common for dataset constructors to discard “noisy” or “controversial” data where there is significant disagreement on the proper label. In datasets constructed for the purpose of Twitter senti-ment analysis (TSA), these controversial ex-amples can compose over 30% of the origi-nally annotated data. We argue that the re-moval of such data is a problematic trend be-cause, when performing real-time sentiment classification of short-text, an automated sys-tem cannot know a priori which samples would fall into this category of disputed sen-timent. We therefore propose the notion of a “complicated” class of sentiment to categorize such text, and argue that its inclusion in the short-text sentiment analysis framework will improve the quality of automated sentiment analysis systems as they are implemented in real-world settings. We motivate this argu-ment by building and analyzing a new publicly available TSA dataset of over 7,000 tweets annotated with 5x coverage, named MTSA. Our analysis of classifier performance over our dataset offers insights into sentiment analysis dataset and model design, how current tech-niques would perform in the real world, and how researchers should handle difficult data. 1 Introduction
The goal of sentiment analysis is to determine the attitude or emotional state held by the author of
*These authors contributed equally to this work.
†These authors contributed equally to this work.
#These authors contributed equally to this work.
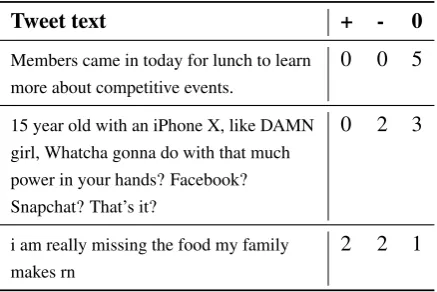
Tweet text + - 0
Members came in today for lunch to learn more about competitive events.
0 0 5
15 year old with an iPhone X, like DAMN girl, Whatcha gonna do with that much power in your hands? Facebook? Snapchat? That’s it?
0 2 3
i am really missing the food my family makes rn
[image:1.595.308.527.222.368.2]2 2 1
Table 1: Example tweets from our dataset over varying levels of annotator labellings; +, -,0 stand for POSI-TIVE, NEGAPOSI-TIVE, OBJECTIVE.
a piece of text. Automatic sentiment classifica-tion that can quickly garner user sentiment is use-ful for applications ranging from product market-ing to measurmarket-ing public opinion. The volume and availability of short-text user content makes auto-mated sentiment analysis systems highly attractive for companies and organizations, despite poten-tial complications arising from their short length and specialized use of language. The popularity of Twitter as a social media platform on which people can readily express their thoughts, feelings, and opinions, coupled with the openness of the plat-form, provides a large amount of publicly accessi-ble data ripe for analysis, being a well established domain for sentiment analysis as reflecting real-world attitudes (Pak and Paroubek, 2010; Bollen et al., 2011). In this paper, we look into Twit-ter sentiment analysis (TSA) as a suitable, core instance of general short-text sentiment analysis (Thelwall et al., 2010, 2012; Kiritchenko et al.,
2014;Dos Santos and Gatti,2014), and encourage the methods and practices presented to be applied across other domains.
Building a TSA model that can automatically
determine the sentiment of a tweet has received significant attention over the past several years. However, since most state-of-the-art TSA mod-els use machine learning to tune their parameters, their performance – and relevance to a real-world implementation setting – is highly dependent on the dataset on which they are trained.
TSA dataset construction has, unfortunately, received less attention than TSA model design. Many commonly used TSA datasets make as-sumptions that do not hold in a real-world imple-mentation setting. For example, it is a common practice for studies to discard tweets on which there is high annotator disagreement. While some argue that this is done to remove noise result-ing from poor annotator quality, this argument does not hold when considering that these datasets present high rates of unanimous annotator agree-ment1. This suggests that the problem is not poor
annotators, but, rather, difficult data that does not fall into the established categories of sentiment.
Consider the sample tweets in Table 1 drawn from our dataset, one with unanimous agreement on an OBJECTIVElabel, one with 60% agreement,
and one with complete disagreement. We observe that, as the amount of disagreement across anno-tations increases, so too does the clarity of what the tweet’s gold standard label really should be. Though the issues we raise may seem obvious, the absence of their proper treatment in the existing literature suggests the need to systematically con-sider their implications in sentiment analysis.
In this paper, we propose the inclusion of a COMPLICATEDclass of sentiment to indicate that
the text does not fall into the established categories of sentiment. We offer insights into the differ-ences between tweets that receive different levels of inter-annotator-agreement, providing empirical evidence that tweets with differing levels of agree-ment are qualitatively different from each other.
Our claims are supported by empirical analysis of a new TSA dataset, the McGill Twitter Senti-ment Analysis dataset (MTSA), which we release publicly with this work2. The dataset contains
7,026 tweets across five different topic-domains, annotated with 5x coverage. We release this dataset with the raw annotation results, and hope that researchers and organizations will be able to
1Annotator disagreement information has proven useful
in other areas of sentiment analysis (Wilson et al.,2005).
2Download at https://github.com/networkdynamics/ mcgill-tsa
analyze our dataset and build models that can be applied in real-world sentiment analysis settings.
2 Current Problems in TSA
The field of Twitter Sentiment Analysis (TSA) has seen a considerable productive work over the past several years, and several large reviews and sur-veys have been written to highlight the trends and progress of the field, its datasets, and the meth-ods used for building automatic TSA systems (Saif et al.,2013;Medhat et al.,2014;Mart´ınez-C´amara et al.,2014;Giachanou and Crestani,2016).
There are a variety of methods for construct-ing TSA datasets along a variety of domains, ranging from very specific (e.g., OMD (Shamma et al., 2009)) to general (e.g., SemEval 2013-2014 (Nakov et al., 2016)). While there is the popular Stanford Twitter corpus, constructed with noisy labellings (Go et al.,2009), the more com-mon method of constructing TSA datasets re-lies on manual annotation (usually crowd-sourced) of tweet sentiment to establish gold-standard la-bellings according to a pre-defined set of possi-ble label categories (often POSITIVE, NEGATIVE,
and NEUTRAL) (Shamma et al., 2009; Speriosu et al.,2011;Thelwall et al.,2012;Saif et al.,2013;
Nakov et al.,2016;Rosenthal et al.,2017). One of the earliest manually annotated TSA datasets, the Obama-McCain Debate (OMD) (Shamma et al.,2009) was released with the spe-cific annotator votes for each tweet, rather than a final specific label assignment. Nonetheless, most work on this dataset filters out tweets with less than two-thirds agreement (Speriosu et al.,2011;
Saif et al.,2013) (Table2). Unfortunately, many later dataset releases have not followed the exam-ple of the OMD; the designers of such datasets have opted instead to release only the resultant la-belling according to a motivated (but constraining) label-assignment schema, often removing tweets with high inter-annotator disagreement from the fi-nal dataset release (Saif et al.,2013;Nakov et al.,
2016;Rosenthal et al.,2017).
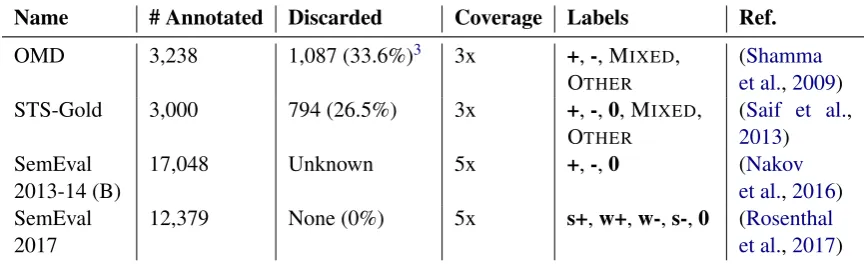
Name # Annotated Discarded Coverage Labels Ref.
OMD 3,238 1,087 (33.6%)3 3x +,-, MIXED,
OTHER
(Shamma et al.,2009) STS-Gold 3,000 794 (26.5%) 3x +,-,0, MIXED,
OTHER
(Saif et al.,
2013) SemEval
2013-14 (B) 17,048 Unknown 5x +,-,0 (et al.Nakov,2016) SemEval
[image:3.595.82.516.64.196.2]2017 12,379 None (0%) 5x s+,w+,w-,s-,0 (et al.Rosenthal,2017)
Table 2: Summary of some of the major TSA datasets used in recent work. Symbols+,-,0stand for POSITIVE, NEGATIVE, and NEUTRAL, respectively; prefixess,wstand for STRONGLYand WEAKLY.
should consider whether or not the choices made during dataset construction adequately reflect a situation in which automatic sentiment analysis systems would be used in real-world settings.
2.1 General Trends in TSA Datasets
In the SemEval 2017 Task 4 (Rosenthal et al.,
2017), a thorough 5x coverage annotation scheme is used (each tweet is annotated by at least five people). Annotations were made on a five-point scale, with categories STRONGLYNEGA -TIVE, WEAKLYNEGATIVE, NEUTRAL, WEAK -LYPOSITIVE, and STRONGLYPOSITIVE. If at
least three out of five of the annotators gave the same labelling, that was accepted as the final an-notation. Otherwise, the authors used an av-eraging scheme (mapping the labels to integers
−2,−1,0,1,2) to determine the final label, taking
the average of the labellings and rounding accord-ing to a specific criterion. This is highly problem-atic. For example, if a controversial tweet receives two STRONGLYNEGATIVE, two STRONGLYPOS -ITIVE, and one NEUTRALlabelling, it will have a
resultant label of NEUTRAL. Yet, the tweet would
certainly not be “neutral”, it would be qualitatively different from a tweet with unanimous agreement on a NEUTRAL labelling. In Section 5, we
pro-vide empirical results supporting this claim, dis-covering that high-disagreement data is qualita-tively different from high-agreement data.
Nakov et al. (2016) provide a thorough explo-ration into the specific design decisions and con-siderations made during the construction of the 2013-2014 SemEval shared task for short-text sen-timent analysis. In Subtask B, annotators
de-3Note that the entire OMD dataset was released with
an-notator votes, but most studies remove that proportion tweets where there was not at least two-thirds agreement on label.
termined the overall polarity of a piece of text, according to a ternary labelling scheme between POSITIVE, NEGATIVE, or NEUTRAL. The final
label of the sentence was “determined based on the majority of the labels” according to 5x cov-erage. The designers thus discarded sentences where there was no majority annotator agreement, since such sentences “are likely to be controversial cases” (p. 40); they do not report how much data was discarded.
Saif et al.(2013) constructed a new dataset, the STS-Gold, by taking into account several limita-tions of the TSA datasets they reviewed. In their study, 3,000 tweets were labelled with 3x cover-age. Any tweet without unanimous agreement on the label was discarded; this decision was justi-fied by the argument that they did not want “noisy data” in their dataset. Thus, they discarded 794 tweets, or 26.5% of their originally annotated data. While we argue that this is a problematic design decision, we note that discarding data in this way successfully isolated unanimous-agreement from majority-agreement data, thus avoiding conflating tweets with different levels of agreement, unlike in the 2013-14 and 2017 SemEval tasks.
The annotation scheme for the STS-Gold re-solves one of the problems in the SemEval 2017 Task, as it provides an option for labelling a MIXED category, capturing tweets bearing
mul-tiple conflicting sentiments. It also provides the OTHER category for tweets where it is “difficult
to decide on a proper label”. Interestingly, the dichotomy between the high frequency of high-disagreement tweets (794 total) compared to the low frequency of tweets unanimously labelled as OTHER(4 total) is consistent with our findings on
The challenges and possible approaches to man-ual sentiment annotation have been previously dis-cussed byMohammad(2016), who offers impor-tant insights into how questions and problem de-scriptions should be posed to annotators.
2.2 Summary of TSA Problems
Based on analysis of the design choices of the three datasets described above, and on the thor-ough overview of other datasets found in (Saif et al., 2013), we conclude that there are two pri-mary limitations in the standard TSA datasets.
First, the lack of distinction between data with majority- vs. unanimous-agreement on the anno-tated label (Nakov et al., 2016; Rosenthal et al.,
2017). In the analysis (Sections3.3 and6) of our TSA dataset, we observe a clear qualitative differ-ence between majority-agreement and unanimous-agreement data, suggesting that these sets of data should not necessarily be treated in the same way. Second, the systematic removal of controver-sial (or, high-disagreement) data (Saif et al.,2013;
Nakov et al.,2016). We argue that this tendency is problematic because any automatic sentiment analysis system to be implemented in a real-world setting cannot knowa prioriwhich tweets will be “noisy” or “controversial”. An automatic senti-ment analysis system trained on such a dataset will inevitably mislabel such tweets as they appear in a real-world implementation setting.
We therefore suggest that the following paradigm become the norm in the field: in re-leasing sentiment analysis datasets, researchers should provide the specific annotations obtained
for each sample (as was done by Shamma et al.
(2009)), in addition to the resultant labelling based on the label-assignment scheme they decide upon. Additionally, data with high levels of annotator
disagreement should not be discarded, rather, it
should be included in dataset releases.
3 Building the MTSA Dataset
The absence of a TSA dataset containing raw annotations and sufficient coverage to identify sources of annotator disagreement necessitated the creation of a new annotated dataset. Here, we provide an overview of the development of a new McGill TSA (MTSA) dataset composed of 7,026 tweets annotated with 5x coverage.
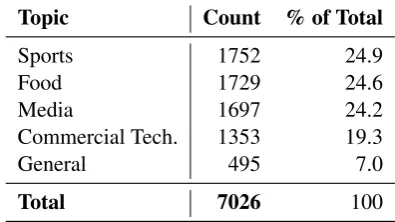
Topic Count % of Total
Sports 1752 24.9
Food 1729 24.6
Media 1697 24.2
Commercial Tech. 1353 19.3
General 495 7.0
[image:4.595.316.514.64.175.2]Total 7026 100
Table 3: Distribution of annotated tweets by topic.
3.1 Data Collection
Tweets were collected from Twitter’s streaming API, filtered for English tweets that contained at least one English token, that were posted by users in North American time-zones. Each tweet had to contain at least one keyword from a topic cloud relating toFood (example keywords: “weight”, “breakfast”, “protein”), Media (“cin-ema”, “gameofthrones”, “reggae”), Commercial
Technology (“microsoft”, “laptop”, “iphone”), or
Sports (“spurs”, “hockey”, “habs”). Using this
topic cloud and a diverse set of keywords per topic (average of 38 hand-selected keywords per topic), we collected tweets with the intent to represent the general sentiment surrounding a specific topic, while reducing the bias that would result by rely-ing on a srely-ingle topic or keyword. A further subset of tweets (categorized as General) was collected from the stream, without any keyword filters, in order to further broaden the representative scope of our dataset.
We additionally filtered out tweets containing external links or images, arguing that analysis of these multimodal tweets is a separate problem, be-longing to the domain of Multimodal Sentiment Analysis (Poria et al., 2016; Soleymani et al.,
2017). After the entire filtering process4was
com-plete, we obtained 7,026 tweets across the differ-ent topics, which would be annotated with 5x cov-erage. The distribution of these tweets is seen be-low in Table3.
3.2 Data Annotation
Data annotation was crowd-sourced using the CrowdFlower platform5. All qualified
Crowd-Flower contributors had the opportunity to com-plete the task, which was presented as: carefully
4See supplemental material for full enumeration of the
specific filters used and the keywords used for each topic.
read the tweet, determine whether or not it ex-presses sentiment (e.g., OBJECTIVE or not), if
it does, categorize the sentiment as being either POSITIVE, NEGATIVE, or COMPLICATED. In the
instructions, COMPLICATEDwas presented as the
preferable option when the sentiment expressed in the tweet was ambiguous, mixed or could be in-terpreted as both positive and/or negative. After a one-line description of the meaning of each cate-gory, the contributor was presented with examples of tweets belonging in each category before start-ing the task.
In order to be considered qualified to complete the task, the contributor had to correctly answer at least 8 of 10 test questions, which we manu-ally selected and labelled. When a user failed a test question, they were presented with the correct answer and a corresponding justification to ensure that they understood the task.
We experimented with the inclusion of test questions from the COMPLICATED category
dur-ing screendur-ing, and found that this was a major source of protest among high-quality annotators. Indeed, it may be paradoxical to expect annotators to agree on tweets that cause significant disagree-ment. Furthermore, due to the heterogeneous na-ture of this class, such test questions would risk biasing the annotators’ notion of the category. As such, we limited our test questions to OBJECTIVE,
POSITIVE, and NEGATIVEtweets.
Users who successfully passed the initial test questions annotated a maximum of 400 tweets. Of those tweets, 10% were additional hidden test questions to continuously assess the quality of the annotators; an accuracy of at least 80% on these test questions was the threshold for including their annotations in the dataset. In the end, a total of 35,926 tasks were completed by 181 trusted con-tributors, resulting in 7,026 annotated tweets.
3.3 Dataset Analysis
The annotated tweets are categorized by four agreement levels: Unanimous (5 out of 5 agreed on the label), Consensus (exactly 4 out of 5 agreed), Majority (exactly 3 out of 5 agreed), or
Disputed(maximum 2 out of 5 agreed). The
dis-tribution of agreement rates was consistent across topics (see supplemental material), thus the entire dataset is merged for the remainder of the analysis.
Annotator agreement distribution. Tweets
with at leastConsensusagreement compose 64%
0 10 20 30 40 50 60 70 80 90 100
Proportion of tweets (%)
All
Unanimous Consensus Majo
rity Disputed
Objective Positive
Negative Complicated
[image:5.595.309.524.64.235.2]None
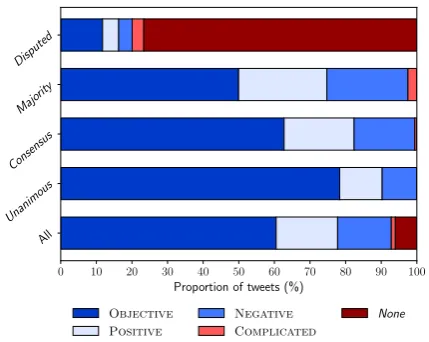
Figure 1: Most frequent annotation by annotator agree-ment rates. Of the 553Disputedtweets, only 129 had a single most frequent annotation.
of the dataset (4505 tweets), and tweets with at least Majority agreement compose 92% of the dataset (6473 tweets; see Table4). The decision to discard tweets with significant annotator disagree-ment, as previously done in TSA research, would result in the loss of 8% to 34% of the annotated tweets in our dataset, depending on whether to filter to a minimumMajorityorConsensus agree-ment, respectively. Interestingly, these numbers are consistent with the proportion of discarded tweets in previous literature (Table2).
Sentiment and annotator agreement. Tweets
that caused more disagreement among the hu-man annotators were found to be more sentiment-laden (majority label of POSITIVE, NEGATIVE, or
COMPLICATED; Figure1). Objective tweets
com-posed 78% (1892 tweets), 63% (1311), and 50% (983) of theUnanimous,Consensus, andMajority
subsets of annotated tweets, respectively.
COMPLICATED label usage. Use of the COM -PLICATEDlabel by annotators was infrequent, and
of those tweets with high inter-annotator agree-ment, almost exclusively limited to tweets that ex-pressed clear, mixed sentiment. For example, the single tweet that received a unanimous COMPLI -CATEDannotation had clear mixed sentiment: “the
iPhone 6s is so big and hard to use but I still like it”. There were a total of 13 tweets with at least
Consensus agreement for the COMPLICATED
la-bel (see supplemental material). These specific tweets largely corresponded to the MIXED label
used in previous TSA datasets (Shamma et al.,
Agreement Count % of Total
Unanimous 2415 34.4
Consensus 2090 29.7
Majority 1968 28.0
Disputed 553 7.9
[image:6.595.321.510.63.176.2]Total 7026 100
Table 4: Annotator agreement rates.Unanimousstands for 100% annotator agreement,Consensus 80%, Ma-jority60%, andDisputed<60%.
tweets that did not clearly fall clearly within OB -JECTIVE, POSITIVE, and NEGATIVE categories
were not consistently identified as COMPLICATED
by annotators. Rather, those tweets were a source of significant disagreement.
4 Classifying Tweet Sentiment
Here, we present the construction of shallow clas-sifier and the experiments performed to study the phenomenon of annotator disagreement. Our ob-jective was not to build a state-of-the-art classifier with optimal accuracy rates, rather, we sought to understand how the inclusion or exclusion of tweet subsets based on annotator disagreement impacts classification accuracy.
4.1 Preprocessing and Feature Extraction
To use machine learning methods with textual data, it is necessary to represent the data in a vector space such that each sample has the same dimen-sionality, despite varying sequence lengths. We concatenated three different standard feature ex-traction methods to build vector representations of tweets: N-Grams (unigrams and bigrams), mean word embedding (GLoVE embeddings built from twitter data (Pennington et al.,2014)6), and
Senti-WordNet scores (Baccianella et al.,2010).7
4.2 Experimental Design
As described in Section 2, most recent work in TSA has agglomerated tweets together based on the majority labelling. For example, a tweet an-notated with aMajorityagreement labelling (e.g., 3 OBJECTIVEand 2 NEGATIVE) would be given
the label OBJECTIVE, just as one withUnanimous
6https://nlp.stanford.edu/projects/glove/
7See supplemental material for full elaboration of the
pre-processing decisions and features extracted.
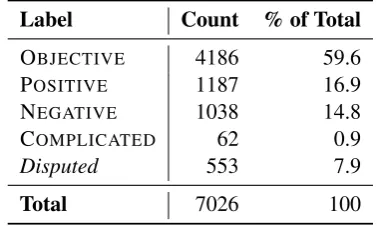
Label Count % of Total
OBJECTIVE 4186 59.6
POSITIVE 1187 16.9
NEGATIVE 1038 14.8
COMPLICATED 62 0.9
Disputed 553 7.9
Total 7026 100
Table 5: Distribution of tweets across classes, where the label given is the result of majority vote.
agreement on an OBJECTIVElabelling. In our
ex-periments with our collected dataset (Section 3) we seek to determine whether or not there is a qualitative difference between high- versus low-agreement data.
Experiment I. In the first experiment setting,
we agglomerate tweets according to the tradi-tional practice for assigning labels based on an-notations (Section2); e.g., we remove tweets with at least aMajorityvoted label as COMPLICATED,
and remove the Disputed tweets (that is, we re-move 8.75% of our annotated data for these exper-iments), creating a 3-class classification problem. We experiment over four different sets of our data in this scenario: the full dataset (minus the COM -PLICATED 8.75%); tweets with exactly Majority
agreement; tweets with exactlyConsensus agree-ment; and tweets with exactlyUnanimous agree-ment on the label (see Figure1for the label distri-butions over each of these subsets). Additionally, when making predictions on a specific subset, we present results from training solely on the subset versus training on all of the data in this setting.
Experiment II. In the second experiment
set-ting, we sought to determine the impact of includ-ing controversial samples, makinclud-ing a 4-class classi-fication problem. Samples that were labelled with at least Majority agreement on a COMPLICATED
label, and samples withDisputedagreement, were all assigned the label COMPLICATED. We thus
used the entirety of our dataset for this experi-ment, where the COMPLICATED class accounted
for 8.75% (615) of the samples, with the rest of the samples being given the majority-vote labelling.
Methods. For both experiments, we use a
[image:6.595.97.266.64.160.2]fea-All Majority Consensus Unanimous
0.0 0.2 0.4 0.6 0.8 1.0
W
eighted
Mean
F1
Sco
re
All Majority Consensus Unanimous
0.0 0.2 0.4 0.6 0.8 1.0
Macro
Mean
F1
Sco
[image:7.595.78.522.64.244.2]re
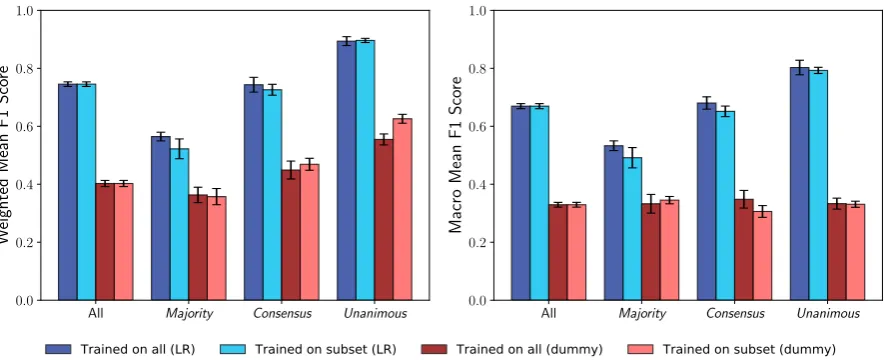
Figure 2: Experiment I.Weighted- and macro-F1-scores, obtained by testing logistic regression (LR) and a strat-ified random guesser (dummy) on the different agreement-level subsets, as described in Section4.2. Black bars indicate plus/minus one standard deviation from the mean, as computed from the accuracies obtained across each of the 5 cross-validated folds.
ture ablation, whether or not to balance the train set classes, and different models (SVM with lin-ear or RBF kernel, Random Forests, Naive Bayes, and K-Nearest-Neighbors), proved that this model variant was the best. We compare to a stratified random guesser, which predicts according to the distribution of classes in the training set (e.g., if 50% of the training set has samples labelled as OBJECTIVE, it will guess OBJECTIVE50% of the
time). To account for possible variance in the re-sults, we use 5-fold cross validation over the full dataset, where the accuracy reported is the average over the specific scores obtained on each fold.
4.3 Evaluation
We evaluate with weighted- and macro-F1-scores to assess classifier performance. F1-score is a common way to measure classifier performance in sentiment analysis as it computes the harmonic mean between precision and recall. In multi-class classification, we obtain a one-versus-all F-score,
Fc, for each classcin our set of possible classes,
C. Weighted F-score weights each F-score by its
support in the test set; if there are ncsamples in
the test set belonging to classc, then the weighted
F-score is expressed byFweightedin Equation1.
Fweighted =
1 (Pnc)
X
c∈C
ncFc (1)
Naturally, the weighted F-score is influenced by the frequency of samples in a class; so, in our case, it is biased toward the OBJECTIVEclass due to its
large frequency compared to the other classes (Ta-ble5; Figure1). Thus, we also report the macro F-score, which averages the F-scores for each class without considering their support, expressed by
Fmacroin Equation2. This score evaluates model
performance isolated from the class distribution, allowing us to determine if a change in accuracy is the result of simply a change in distribution of classes or a change in model generalization ability.
Fmacro=
1 |C|
X
c∈C
Fc (2)
5 Results
In Figure2, we present the results for Experiment I (Section 4.2). We note that the presented accu-racy is higher when evaluated with weighted F-score versus macro F-F-score. Since both weighted-and macro-F1-score increase as we move along to higher agreement subsets, we conclude that the ac-curacy improvement is not solely due to a change in distribution of classes. Rather, there must be a qualitative difference between high- vs. low-agreement tweets, otherwise the accuracy would have been the same across agreement levels.
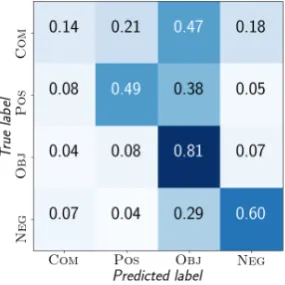
In Figure 3, we present the normalized confu-sion matrix obtained from Experiment II. We ob-serve that the model poorly classifies COMPLI -CATED tweets. Although the model uses
bal-anced class weights for training, it predicts OB -JECTIVE the majority of the time, where each
-Trained on all Trained on subset
Test subset Precision Recall F1-Score Precision Recall F1-Score
All 0.681 0.660 0.669 – – –
Majority 0.552 0.524 0.533 0.502 0.488 0.491
Consensus 0.689 0.674 0.680 0.680 0.633 0.652
Unanimous 0.789 0.821 0.803 0.843 0.761 0.793
[image:8.595.122.477.65.155.2]Table 6: Experiment I. Macro-F1 score results for precision, recall, and F1-score, as shown visually in Figure2. These are the mean scores across the 5 cross-validated folds. Bold numbers indicate the improvement of training on all data versus just the subset being tested upon.
Figure 3:Experiment II.Normalized confusion matrix from using logistic regression.
Label Precision Recall F1
COMPLICATED 0.199 0.138 0.163
POSITIVE 0.599 0.605 0.602
OBJECTIVE 0.766 0.806 0.786
NEGATIVE 0.510 0.487 0.498
Total –weighted 0.650 0.667 0.658 Total –macro 0.518 0.509 0.512
Table 7:Experiment II.Results across evaluation met-rics, as shown visually in Figure3. Results are com-puted by agglomerating all predictions made across each of the 5 cross-validated folds.
TIVE. The final weighted-F1-score and
macro-F1-scores, were, respectively: 65.8% and 51.2% with logistic regression, and 41.1% and 24.7% with the stratified random guesser. This large difference between weighted and macro is largely due to the poor classifier performance on the COMPLICATED
class.
6 Discussion
The interpretation of expressed sentiment is an in-herently subjective exercise, the gold-standard of
which is the sentiment perceived by other humans. Thus, it is crucial to better understand sentiment annotation itself to inform future classifier design.
Annotator disagreement is not human error.
Our results show that annotator disagreements cannot simply be attributed to human error. There is a clear decrease in classifier performance when testing on subsets of tweets with lower annota-tor agreement (Figure 2), suggesting that tweets across these subsets are qualitatively different from each other. From a probabilistic perspective, this means that samples that obtain high annota-tor agreement are generated by a different real-world function than those that obtain low annota-tor agreement. This perspective is further justified by the fact that classifier performance is roughly the same when training on the full dataset versus when training just on the specific agreement level subsets. Future work should explore how to han-dle this data, and we recommend reporting results on the different subsets by agreement-level.
On defaulting to the majority label. When
each tweet is assigned a gold-standard label ac-cording to the majority annotation, we demon-strated that there are qualitative differences be-tween tweets with Majority, Consensus, and
Unanimous agreement. As exemplified by the
sample tweets in Table1, the differences between the two tweets with a majority OBJECTIVE
anno-tation is reflected in the inter-annotator disagree-ment. We have shown that the subtleties in senti-ment expression are masked by simply taking the majority label, and future work would involve fac-toring in these varying levels of agreement on la-bels during the model design process.
Standards for sentiment analysis datasets. To
[image:8.595.102.245.227.370.2]in dataset design and development. First, future datasets should be released with the raw annota-tor label assignments without discarding any an-notated data. This would allow other researchers to experiment with different means of handling annotation-disagreement during the model design process. Secondly, we argue that sufficient resolu-tion of short-text sentiment annotaresolu-tions requires at least 5x coverage. Our dataset, MTSA, of 7,026 tweets was constructed with 5x annotation cov-erage, a resolution at which we can just begin to distinguish these subsets of tweets. Higher cov-erage may be needed still to identify and under-stand these annotator disagreements. In contrast, the differences between these two subsets would be masked using the 3x coverage commonly found in other datasets.
Identifying ambiguous data. Results from
Ex-periment II, and analysis of our COMPLICATED
tweets, reveal that detecting high-disagreement tweets is a difficult task for both classifiers and hu-mans. The poor performance of human annotators on identifying ambiguous tweets in our study, and the fact that high disagreement affected up to one third of the samples across TSA datasets, suggests that “complicatedness” is a real phenomenon. The optimal way to handle and identify this data re-quires further research. It is, however, an essen-tial problem to solve, as real-world implementa-tions of automated sentiment analysis systems will inevitably be confronted with such data. Such a system may be able to leverage the raw annota-tions during training, which is why we release the MTSA dataset with the raw annotation results in-cluded, and suggest all others do this as well.
7 Conclusion
In this paper, we highlight the need to better en-gage with how humans actually annotate data in short-text sentiment analysis dataset construction by constructing the new McGill Twitter Senti-ment Analysis (MTSA) dataset. Future work in-volves leveraging raw human annotations to im-prove sentiment analysis classifiers, and finding ways to better detect and understand the “compli-cated” property in these samples that cause high annotator disagreement. Additionally, we encour-age researchers to use MTSA in the development of other methods for short text sentiment analysis, including unsupervised, lexicon-based, and rule-based methods.
Acknowledgements
This work was the product of a class project pur-sued collectively by students in the COMP 767 graduate seminar in Social Media Analytics at McGill University, taught by Derek Ruths. This work was funded by the Discovery Grant Acceler-ator Supplement 2017-05165.
References
Stefano Baccianella, Andrea Esuli, and Fabrizio Sebas-tiani. 2010. Sentiwordnet 3.0: An enhanced lexical resource for sentiment analysis and opinion mining. InLREC. volume 10, pages 2200–2204.
Johan Bollen, Huina Mao, and Alberto Pepe. 2011. Modeling public mood and emotion: Twitter sen-timent and socio-economic phenomena. ICWSM 11:450–453.
C´ıcero Nogueira Dos Santos and Maira Gatti. 2014. Deep convolutional neural networks for sentiment analysis of short texts. InCOLING. pages 69–78. Anastasia Giachanou and Fabio Crestani. 2016. Like it
or not: A survey of twitter sentiment analysis meth-ods. ACM Computing Surveys (CSUR)49(2):28. Alec Go, Richa Bhayani, and Lei Huang. 2009.
Twit-ter sentiment classification using distant supervision. CS224N Project Report, Stanford1(2009):12.
Svetlana Kiritchenko, Xiaodan Zhu, and Saif M Mo-hammad. 2014. Sentiment analysis of short infor-mal texts. Journal of Artificial Intelligence Research 50:723–762.
Eugenio Mart´ınez-C´amara, M Teresa Mart´ın-Valdivia, L Alfonso Urena-L´opez, and A Rturo Montejo-R´aez. 2014. Sentiment analysis in twitter. Natural Language Engineering20(1):1–28.
Walaa Medhat, Ahmed Hassan, and Hoda Korashy. 2014. Sentiment analysis algorithms and applica-tions: A survey. Ain Shams Engineering Journal 5(4):1093–1113.
Saif Mohammad. 2016. A practical guide to senti-ment annotation: Challenges and solutions. In Pro-ceedings of the 7th Workshop on Computational Ap-proaches to Subjectivity, Sentiment and Social Me-dia Analysis. pages 174–179.
Preslav Nakov, Sara Rosenthal, Svetlana Kiritchenko, Saif M Mohammad, Zornitsa Kozareva, Alan Ritter, Veselin Stoyanov, and Xiaodan Zhu. 2016. Devel-oping a successful semeval task in sentiment analy-sis of twitter and other social media texts. Language Resources and Evaluation50(1):35–65.
Jeffrey Pennington, Richard Socher, and Christo-pher D. Manning. 2014. GloVe: Global Vectors for Word Representation. InEmpirical Methods in Nat-ural Language Processing (EMNLP). pages 1532– 1543.
Soujanya Poria, Erik Cambria, Newton Howard, Guang-Bin Huang, and Amir Hussain. 2016. Fusing audio, visual and textual clues for sentiment analysis from multimodal content. Neurocomputing174:50– 59.
Sara Rosenthal, Noura Farra, and Preslav Nakov. 2017. Semeval-2017 task 4: Sentiment analysis in twitter. In Proceedings of the 11th International Workshop on Semantic Evaluation (SemEval-2017). pages 502–518.
Hassan Saif, Miriam Fernandez, Yulan He, and Harith Alani. 2013. Evaluation datasets for Twitter sen-timent analysis: a survey and a new dataset, the STS-Gold. In CEUR Workshop Proceedings. vol-ume 1096, pages 9–21.
David A Shamma, Lyndon Kennedy, and Elizabeth F Churchill. 2009. Tweet the debates: understanding community annotation of uncollected sources. In Proceedings of the first SIGMM workshop on Social media. ACM, pages 3–10.
Mohammad Soleymani, David Garcia, Brendan Jou, Bj¨orn Schuller, Shih-Fu Chang, and Maja Pantic. 2017. A survey of multimodal sentiment analysis. Image and Vision Computing65:3–14.
Michael Speriosu, Nikita Sudan, Sid Upadhyay, and Ja-son Baldridge. 2011. Twitter polarity classification with label propagation over lexical links and the fol-lower graph. InProceedings of the First workshop on Unsupervised Learning in NLP. Association for Computational Linguistics, pages 53–63.
Mike Thelwall, Kevan Buckley, and Georgios Pal-toglou. 2012. Sentiment strength detection for the social web. Journal of the Association for Informa-tion Science and Technology63(1):163–173.
Mike Thelwall, Kevan Buckley, Georgios Paltoglou, Di Cai, and Arvid Kappas. 2010. Sentiment strength detection in short informal text. Journal of the As-sociation for Information Science and Technology 61(12):2544–2558.