SemEval-2014 Task 9: Sentiment Analysis in Twitter
Sara RosenthalColumbia University
[email protected] Preslav Nakov
Qatar Computing Research Institute
Alan Ritter
Carnegie Mellon University
[email protected] Veselin Stoyanov
Johns Hopkins University
Abstract
We describe the Sentiment Analysis in Twittertask, ran as part of SemEval-2014. It is a continuation of the last year’s task that ran successfully as part of SemEval-2013. As in 2013, this was the most popu-lar SemEval task; a total of 46 teams con-tributed 27 submissions for subtask A (21 teams) and 50 submissions for subtask B (44 teams). This year, we introduced three new test sets: (i) regular tweets, (ii) sarcas-tic tweets, and (iii) LiveJournal sentences. We further tested on (iv) 2013 tweets, and (v) 2013 SMS messages. The highest F1-score on (i) was achieved byNRC-Canada at 86.63 for subtask A and by TeamX at 70.96 for subtask B.
1 Introduction
In the past decade, new forms of communica-tion have emerged and have become ubiquitous through social media. Microblogs (e.g., Twitter), Weblogs (e.g., LiveJournal) and cell phone mes-sages (SMS) are often used to share opinions and sentiments about the surrounding world, and the availability of social content generated on sites such as Twitter creates new opportunities to au-tomatically study public opinion.
Working with these informal text genres presents new challenges for natural language pro-cessing beyond those encountered when work-ing with more traditional text genres such as newswire. The language in social media is very informal, with creative spelling and punctuation, misspellings, slang, new words, URLs, and genre-specific terminology and abbreviations, e.g., RT for re-tweet and #hashtags1.
This work is licensed under a Creative Commons At-tribution 4.0 International Licence. Page numbers and pro-ceedings footer are added by the organisers. Licence details: http://creativecommons.org/licenses/by/4.0/
1Hashtags are a type of tagging for Twitter messages.
Moreover, tweets and SMS messages are short: a sentence or a headline rather than a document.
How to handle such challenges so as to automat-ically mine and understand people’s opinions and sentiments has only recently been the subject of research (Jansen et al., 2009; Barbosa and Feng, 2010; Bifet et al., 2011; Davidov et al., 2010; O’Connor et al., 2010; Pak and Paroubek, 2010; Tumasjan et al., 2010; Kouloumpis et al., 2011).
Several corpora with detailed opinion and sen-timent annotation have been made freely avail-able, e.g., the MPQA newswire corpus (Wiebe et al., 2005), the movie reviews corpus (Pang et al., 2002), or the restaurant and laptop reviews cor-pora that are part of this year’s SemEval Task 4 (Pontiki et al., 2014). These corpora have proved very valuable as resources for learning about the language of sentiment in general, but they do not focus on tweets. While some Twitter sentiment datasets were created prior to SemEval-2013, they were either small and proprietary, such as the i-sieve corpus (Kouloumpis et al., 2011) or focused solely on message-level sentiment.
Thus, the primary goal of our SemEval task is to promote research that will lead to better un-derstanding of how sentiment is conveyed in So-cial Media. Toward that goal, we created the Se-mEval Tweet corpus as part of our inaugural Sen-timent Analysis in Twitter Task, SemEval-2013 Task 2 (Nakov et al., 2013). It contains tweets and SMS messages with sentiment expressions an-notated with contextual phrase-level and message-level polarity. This year, we extended the corpus by adding new tweets and LiveJournal sentences.
Another interesting phenomenon that has been studied in Twitter is the use of the #sarcasm hash-tag to indicate that a tweet should not be taken lit-erally (Gonz´alez-Ib´a˜nez et al., 2011; Liebrecht et al., 2013). In fact, sarcasm indicates that the mes-sage polarity should be flipped. With this in mind, this year, we also evaluate on sarcastic tweets.
In the remainder of this paper, we first describe the task, the dataset creation process and the eval-uation methodology. We then summarize the char-acteristics of the approaches taken by the partici-pating systems, and we discuss their scores. 2 Task Description
As SemEval-2013 Task 2, we included two sub-tasks: an expression-level subtask and a message-level subtask. Participants could choose to partici-pate in either or both. Below we provide short de-scriptions of the objectives of these two subtasks.
Subtask A: Contextual Polarity Disambiguation
Given a message containing a marked in-stance of a word or a phrase, determine whether that instance is positive, negative or neutral in that context. The instance bound-aries were provided: this was a classification task, not an entity recognition task.
Subtask B: Message Polarity Classification
Given a message, decide whether it is of positive, negative, or neutral sentiment. For messages conveying both positive and negative sentiment, the stronger one is to be chosen.
Each participating team was allowed to submit results for two different systems per subtask: one constrained, and one unconstrained. A constrained system could only use the provided data for train-ing, but it could also use other resources such as lexicons obtained elsewhere. An unconstrained system could use any additional data as part of the training process; this could be done in a super-vised, semi-supersuper-vised, or unsupervised fashion.
Note that constrained/unconstrained refers to the data used to train a classifier. For example, if other data (excluding the test data) was used to develop a sentiment lexicon, and the lexicon was used to generate features, the system would still be constrained. However, if other data (excluding the test data) was used to develop a sentiment lexi-con, and this lexicon was used to automatically la-bel additional Tweet/SMS messages and then used with the original data to train the classifier, then such a system would be considered unconstrained. 3 Datasets
In this section, we describe the process of collect-ing and annotatcollect-ing the 2014 testcollect-ing tweets, includ-ing the sarcastic ones, and LiveJournal sentences.
Corpus Positive Negative Objective / Neutral
Twitter2013-train 5,895 3,131 471
Twitter2013-dev 648 430 57
Twitter2013-test 2,734 1,541 160
SMS2013-test 1,071 1,104 159
Twitter2014-test 1,807 578 88
Twitter2014-sarcasm 82 37 5
[image:2.595.305.531.62.155.2]LiveJournal2014-test 660 511 144
Table 1: Dataset statistics for Subtask A.
3.1 Datasets Used
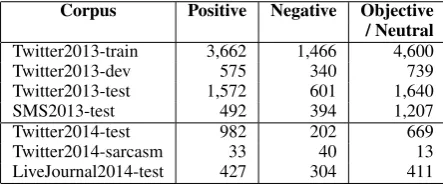
For training and development, we released the Twitter train/dev/test datasets from SemEval-2013 task 2, as well as the SMS test set, which uses mes-sages from the NUS SMS corpus (Chen and Kan, 2013), which we annotated for sentiment in 2013. We further added a new 2014 Twitter test set, as well as a small set of tweets that contained the #sarcasm hashtag to determine how sarcasm affects the tweet polarity. Finally, we included sentences from LiveJournal in order to determine how systems trained on Twitter perform on other sources. The statistics for each dataset and for each subtask are shown in Tables 1 and 2.
Corpus Positive Negative Objective / Neutral Twitter2013-train 3,662 1,466 4,600
Twitter2013-dev 575 340 739
Twitter2013-test 1,572 601 1,640
SMS2013-test 492 394 1,207
Twitter2014-test 982 202 669
Twitter2014-sarcasm 33 40 13
LiveJournal2014-test 427 304 411
Table 2: Dataset statistics for Subtask B.
3.2 Annotation
We annotated the new tweets as in 2013: by iden-tifying tweets from popular topics that contain sentiment-bearing words by using SentiWordNet (Baccianella et al., 2010) as a filter. We altered the annotation task for the sarcastic tweets, displaying them to the Mechanical Turk annotators without the #sarcasm hashtag; the Turkers had to deter-mine whether the tweet is sarcastic on their own. Moreover, we asked Turkers to indicate the degree of sarcasm as (a) definitely sarcastic, (b) probably sarcastic, and (c) not sarcastic.
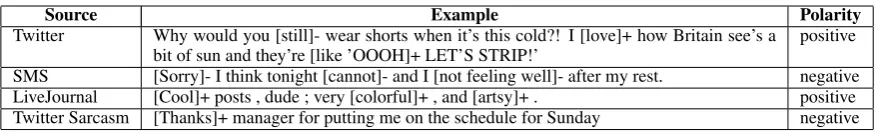
[image:2.595.307.529.404.496.2]Source Example Polarity Twitter Why would you [still]- wear shorts when it’s this cold?! I [love]+ how Britain see’s a
[image:3.595.80.521.60.126.2]bit of sun and they’re [like ’OOOH]+ LET’S STRIP!’ positive SMS [Sorry]- I think tonight [cannot]- and I [not feeling well]- after my rest. negative LiveJournal [Cool]+ posts , dude ; very [colorful]+ , and [artsy]+ . positive Twitter Sarcasm [Thanks]+ manager for putting me on the schedule for Sunday negative
Table 3: Example of polarity for each source of messages. The target phrases are marked in [. . .], and are followed by their polarity; the sentence-level polarity is shown in the last column.
3.3 Tweets Delivery
We did not deliver the annotated tweets to the par-ticipants directly; instead, we released annotation indexes, a list of corresponding Twitter IDs, and a download script that extracts the correspond-ing tweets via the Twitter API.2 We provided the tweets in this manner in order to ensure that Twit-ter’s terms of service are not violated. Unfor-tunately, due to this restriction, the task partici-pants had access to different number of training tweets depending on when they did the download-ing. This varied between a minimum of 5,215 tweets and the full set of 10,882 tweets. On av-erage the teams were able to collect close to 9,000 tweets; for teams that did not participate in 2013, this was about 8,500. The difference in training data size did not seem to have had a major impact. In fact, the top two teams in subtask B (coooolll and TeamX) trained on less than 8,500 tweets. 4 Scoring
The participating systems were required to per-form a three-way classification for both subtasks. A particular marked phrase (for subtask A) or an entire message (for subtask B) was to be classi-fied aspositive,negativeorobjective/neutral. We scored the systems by computing a score for pre-dicting positive/negative phrases/messages. For instance, to compute positive precision, ppos, we
find the number of phrases/messages that a sys-tem correctly predicted to be positive, and we di-vide that number by the total number it predicted to be positive. To compute positive recall, rpos,
we find the number of phrases/messages correctly predicted to be positive and we divide that number by the total number of positives in the gold stan-dard. We then calculate F1-score for the positive class as follows Fpos = 2(pppos∗pos+rrpospos). We carry
out a similar computation forFneg, for the
nega-tive phrases/messages. The overall score is then
F = (Fpos+Fneg)/2.
2https://dev.twitter.com
We used the two test sets from 2013 and the three from 2014, which we combined into one test set and we shuffled to make it hard to guess which set a sentence came from. This guaranteed that participants would submit predictions for all five test sets. It also allowed us to test how well sys-tems trained on standard tweets generalize to sar-castic tweets and to LiveJournal sentences, with-out the participants putting extra efforts into this. The participants were also not informed about the source the extra test sets come from.
We provided the participants with a scorer that outputs the overall scoreFand a confusion matrix for each of the five test sets.
5 Participants and Results
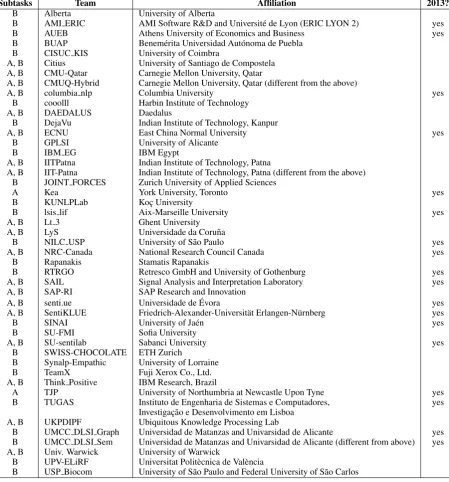
The results are shown in Tables 4 and 5, and the team affiliations are shown in Table 6. Tables 4 and 5 contain results on the two progress test sets (tweets and SMS messages), which are the official test sets from the 2013 edition of the task, and on the three new official 2014 testsets (tweets, tweets with sarcasm, and LiveJournal). The tables fur-ther show macro- and micro-averaged results over the 2014 datasets. There is an index for each re-sult showing the relative rank of that rere-sult within the respective column. The participating systems are ranked by their score on the Twitter-2014 test-set, which is the official ranking for the task; all remaining rankings are secondary.
Most of the submissions were constrained, with just a few unconstrained: 7 out of 27 for subtask A, and 8 out of 50 for subtask B. In any case, the best systems were constrained. Some teams par-ticipated with both a constrained and an uncon-strained system, but the unconuncon-strained system was not always better than the constrained one: some-times it was worse, somesome-times it performed the same. Thus, we decided to produce a single rank-ing, including both constrained and unconstrained systems, where we mark the latter accordingly.
5.1 Subtask A
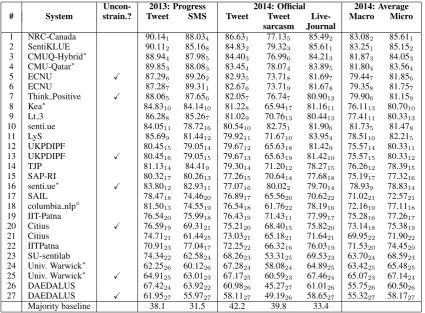
Table 4 shows the results for subtask A, which at-tracted 27 submissions from 21 teams. There were seven unconstrained submissions: five teams sub-mitted both a constrained and an unconstrained run, and two teams submitted an unconstrained run only. The best systems were constrained. All participating systems outperformed the majority class baseline by a sizable margin.
5.2 Subtask B
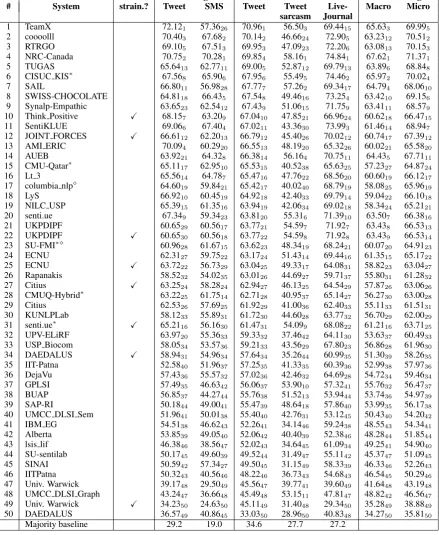
The results for subtask B are shown in Table 5. The subtask attracted 50 submissions from 44 teams. There were eight unconstrained submis-sions: six teams submitted both a constrained and an unconstrained run, and two teams submitted an unconstrained run only. As for subtask A, the best systems were constrained. Again, all participating systems outperformed the majority class baseline; however, some systems were very close to it.
6 Discussion
Overall, we observed similar trends as in SemEval-2013 Task 2. Almost all systems used supervised learning. Most systems were con-strained, including the best ones in all categories. As in 2013, we observed several cases of a team submitting a constrained and an unconstrained run and the constrained run performing better.
It is unclear why unconstrained systems did not outperform constrained ones. It could be because participants did not use enough external data or because the data they used was too different from Twitter or from our annotation method. Or it could be due to our definition of unconstrained, which labels as unconstrained systems that use additional tweets directly, but considers unconstrained those that use additional tweets to build sentiment lexi-cons and then use these lexilexi-cons.
As in 2013, the most popular classifiers were SVM, MaxEnt, and Naive Bayes. Moreover, two submissions used deep learning,coooolll(Harbin Institute of Technology) andThinkPositive (IBM Research, Brazil), which were ranked second and tenth on subtask B, respectively.
The features used were quite varied, includ-ing word-based (e.g., word and character n -grams, word shapes, and lemmata), syntactic, and Twitter-specific such as emoticons and abbrevia-tions. The participants still relied heavily on lex-icons of opinion words, the most popular ones being the same as in 2013: MPQA, SentiWord-Net and Bing Liu’s opinion lexicon. Popular this year was also the NRC lexicon (Mohammad et al., 2013), created by the best-performing team in 2013, which is top-performing this year as well.
Preprocessing of tweets was still a popular tech-nique. In addition to standard NLP steps such as tokenization, stemming, lemmatization, stop-word removal and POS tagging, most teams ap-plied some kind of Twitter-specific processing such as substitution/removal of URLs, substitu-tion of emoticons, word normalizasubstitu-tion, abbrevi-ation lookup, and punctuabbrevi-ation removal. Finally, several of the teams used Twitter-tuned NLP tools such as part of speech and named entity taggers (Gimpel et al., 2011; Ritter et al., 2011).
Uncon- 2013: Progress 2014: Official 2014: Average # System strain.? Tweet SMS Tweet Tweet Live- Macro Micro
sarcasm Journal
1 NRC-Canada 90.141 88.034 86.631 77.135 85.492 83.082 85.611
2 SentiKLUE 90.112 85.168 84.832 79.323 85.611 83.251 85.152
3 CMUQ-Hybrid∗ 88.94
4 87.985 84.403 76.996 84.213 81.873 84.053
4 CMU-Qatar∗ 89.85
3 88.083 83.454 78.074 83.895 81.804 83.564
5 ECNU X 87.296 89.262 82.935 73.718 81.697 79.447 81.856
6 ECNU 87.287 89.311 82.676 73.719 81.678 79.358 81.757
7 Think Positive X 88.065 87.656 82.057 76.747 80.9012 79.906 81.159
8 Kea∗ 84.83
10 84.1410 81.228 65.9417 81.1611 76.1113 80.7010
9 Lt 3 86.288 85.267 81.029 70.7613 80.4413 77.4111 80.3313
10 senti.ue 84.0511 78.7216 80.5410 82.751 81.906 81.735 81.478
11 LyS 85.699 81.4412 79.9211 71.6710 83.954 78.5110 82.215
12 UKPDIPF 80.4515 79.0514 79.6712 65.6318 81.429 75.5714 80.3311
13 UKPDIPF X 80.4516 79.0515 79.6713 65.6319 81.4210 75.5715 80.3312
14 TJP 81.1314 84.419 79.3014 71.2012 78.2715 76.2612 78.3915
15 SAP-RI 80.3217 80.2613 77.2615 70.6414 77.6818 75.1917 77.3216
16 senti.ue∗ X 83.80
12 82.9311 77.0716 80.022 79.7014 78.939 78.8314
17 SAIL 78.4718 74.4620 76.8917 65.5620 70.6222 71.0221 72.5721
18 columbia nlp 81.50
13 74.5519 76.5418 61.7622 78.1916 72.1619 77.1118
19 IIT-Patna 76.5420 75.9918 76.4319 71.4311 77.9917 75.2816 77.2617
20 Citius X 76.5919 69.3121 75.2120 68.4015 75.8220 73.1418 75.3819
21 Citius 74.7121 61.4425 73.0321 65.1821 71.6421 69.9522 71.9022
22 IITPatna 70.9123 77.0417 72.2522 66.3216 76.0319 71.5320 74.4520
23 SU-sentilab 74.3422 62.5824 68.2623 53.3125 69.5323 63.7024 68.5923
24 Univ. Warwick∗ 62.25
26 60.1226 67.2824 58.0824 64.8925 63.4225 65.4825
25 Univ. Warwick∗ X 64.91
25 63.0123 67.1725 60.5923 67.4624 65.0723 67.1424
26 DAEDALUS 67.4224 63.9222 60.9826 45.2727 61.0126 55.7526 60.5026
27 DAEDALUS X 61.9527 55.9727 58.1127 49.1926 58.6527 55.3227 58.1727
[image:5.595.86.512.61.374.2]Majority baseline 38.1 31.5 42.2 39.8 33.4
Table 4:Results for subtask A.The∗ indicates system resubmissions (because they initially trained on
Twitter2013-test), and the indicates a system that includes a task co-organizer as a team member. The
systems are sorted by their score on the Twitter2014 test dataset; the rankings on the individual datasets are indicated with a subscript. The last two columns show macro- and micro-averaged results across the three 2014 test datasets.
Finally, note that for both subtasks, the best sys-tems on the Twitter-2014 dataset are those that per-formed best on the 2013 progress Twitter dataset: NRC-Canadafor subtask A, andTeamX(Fuji Xe-rox Co., Ltd.) for subtask B.
It is interesting to note that the best results for Twitter2014-test are lower than those for Twitter2013-test for both subtask A (86.63 vs. 90.14) and subtask B (70.96 vs 72.12). This is so despite the baselines for Twitter2014-test be-ing higher than those for Twitter2013-test: 42.2 vs. 38.1 for subtask A, and 34.6 vs. 29.2 for subtask B. Most likely, having access to Twitter2013-test at development time, teams have overfitted on it. It could be also the case that some of the sentiment dictionaries that were built in 2013 have become somewhat outdated by 2014.
Finally, note that while some teams such as NRC-Canada performed well across all test sets, other such as TeamX, which used a weighting scheme tuned specifically for class imbalances in tweets, were only strong on Twitter datasets.
7 Conclusion
We have described the data, the experimental setup and the results for SemEval-2014 Task 9. As in 2013, our task was the most popular one at SemEval-2014, attracting 46 participating teams: 21 in subtask A (27 submissions) and 44 in sub-task B (50 submissions).
We introduced three new test sets for 2014: an in-domain Twitter dataset, an out-of-domain Live-Journal test set, and a dataset of tweets contain-ing sarcastic content. While the performance on the LiveJournal test set was mostly comparable to the in-domain Twitter test set, for most teams there was a sharp drop in performance for tic tweets, highlighting better handling of sarcas-tic language as one important direction for future work in Twitter sentiment analysis.
Uncon- 2013: Progress 2014: Official 2014: Average # System strain.? Tweet SMS Tweet Tweet Live- Macro Micro
sarcasm Journal
1 TeamX 72.121 57.3626 70.961 56.503 69.4415 65.633 69.995
2 coooolll 70.403 67.682 70.142 46.6624 72.905 63.2312 70.512
3 RTRGO 69.105 67.513 69.953 47.0923 72.206 63.0813 70.153
4 NRC-Canada 70.752 70.281 69.854 58.161 74.841 67.621 71.371
5 TUGAS 65.6413 62.7711 69.005 52.8712 69.7913 63.896 68.848
6 CISUC KIS∗ 67.56
8 65.906 67.956 55.495 74.462 65.972 70.024
7 SAIL 66.8011 56.9828 67.777 57.262 69.3417 64.794 68.0610
8 SWISS-CHOCOLATE 64.8118 66.435 67.548 49.4616 73.254 63.4210 69.156
9 Synalp-Empathic 63.6523 62.5412 67.439 51.0615 71.759 63.4111 68.579
10 Think Positive X 68.157 63.209 67.0410 47.8521 66.9624 60.6218 66.4715
11 SentiKLUE 69.066 67.404 67.0211 43.3630 73.993 61.4614 68.947
12 JOINT FORCES X 66.6112 62.2013 66.7912 45.4026 70.0212 60.7417 67.3912
13 AMI ERIC 70.094 60.2920 66.5513 48.1920 65.3226 60.0221 65.5820
14 AUEB 63.9221 64.328 66.3814 56.164 70.7511 64.435 67.7111
15 CMU-Qatar∗ 65.11
17 62.9510 65.5315 40.5238 65.6325 57.2327 64.8724
16 Lt 3 65.5614 64.787 65.4716 47.7622 68.5620 60.6019 66.1217
17 columbia nlp 64.60
19 59.8421 65.4217 40.0240 68.7919 58.0825 65.9619
18 LyS 66.9210 60.4519 64.9218 42.4033 69.7914 59.0422 66.1018
19 NILC USP 65.3915 61.3516 63.9419 42.0634 69.0218 58.3424 65.2121
20 senti.ue 67.349 59.3423 63.8120 55.316 71.3910 63.507 66.3816
21 UKPDIPF 60.6529 60.5617 63.7721 54.597 71.927 63.438 66.5313
22 UKPDIPF X 60.6530 60.5618 63.7722 54.598 71.928 63.439 66.5314
23 SU-FMI∗ 60.96
28 61.6715 63.6223 48.3419 68.2421 60.0720 64.9123
24 ECNU 62.3127 59.7522 63.1724 51.4314 69.4416 61.3515 65.1722
25 ECNU X 63.7222 56.7329 63.0425 49.3317 64.0831 58.8223 63.0427
26 Rapanakis 58.5232 54.0235 63.0126 44.6927 59.7137 55.8031 61.2832
27 Citius X 63.2524 58.2824 62.9427 46.1325 64.5429 57.8726 63.0626
28 CMUQ-Hybrid∗ 63.22
25 61.7514 62.7128 40.9537 65.1427 56.2730 63.0028
29 Citius 62.5326 57.6925 61.9229 41.0036 62.4033 55.1133 61.5131
30 KUNLPLab 58.1233 55.8931 61.7230 44.6028 63.7732 56.7029 62.0029
31 senti.ue∗ X 65.21
16 56.1630 61.4731 54.099 68.0822 61.2116 63.7125
32 UPV-ELiRF 63.9720 55.3633 59.3332 37.4642 64.1130 53.6337 60.4933
33 USP Biocom 58.0534 53.5736 59.2133 43.5629 67.8023 56.8628 61.9630
34 DAEDALUS X 58.9431 54.9634 57.6434 35.2644 60.9935 51.3039 58.2635
35 IIT-Patna 52.5840 51.9637 57.2535 41.3335 60.3936 52.9938 57.9736
36 DejaVu 57.4336 55.5732 57.0236 42.4632 64.6928 54.7234 59.4634
37 GPLSI 57.4935 46.6342 56.0637 53.9010 57.3241 55.7632 56.4737
38 BUAP 56.8537 44.2744 55.7638 51.5213 53.9444 53.7436 54.9739
39 SAP-RI 50.1844 49.0041 55.4739 48.6418 57.8640 53.9935 56.1738
40 UMCC DLSI Sem 51.9641 50.0138 55.4040 42.7631 53.1245 50.4340 54.2042
41 IBM EG 54.5138 46.6243 52.2641 34.1446 59.2438 48.5543 54.3441
42 Alberta 53.8539 49.0540 52.0642 40.4039 52.3846 48.2844 51.8544
43 lsis lif 46.3846 38.5647 52.0243 34.6445 61.0934 49.2541 54.9040
44 SU-sentilab 50.1745 49.6039 49.5244 31.4947 55.1142 45.3747 51.0945
45 SINAI 50.5942 57.3427 49.5045 31.1549 58.3339 46.3346 52.2643
46 IITPatna 50.3243 40.5646 48.2246 36.7343 54.6843 46.5445 50.2946
47 Univ. Warwick 39.1748 29.5049 45.5647 39.7741 39.6049 41.6448 43.1948
48 UMCC DLSI Graph 43.2447 36.6648 45.4948 53.1511 47.8147 48.8242 46.5647
49 Univ. Warwick X 34.2350 24.6350 45.1149 31.4048 29.3450 35.2849 38.8849
50 DAEDALUS 36.5749 40.8645 33.0350 28.9650 40.8348 34.2750 35.8150
[image:6.595.79.519.71.607.2]Majority baseline 29.2 19.0 34.6 27.7 27.2
Table 5:Results for subtask B.The∗indicates system resubmissions (because they initially trained on
Twitter2013-test), and the indicates a system that includes a task co-organizer as a team member. The
systems are sorted by their score on the Twitter2014 test dataset; the rankings on the individual datasets are indicated with a subscript. The last two columns show macro- and micro-averaged results across the three 2014 test datasets.
In the 2015 edition of the task, we might also remove the constrained/unconstrained distinction. Finally, as there are multiple opinions about a topic in Twitter, we would like to focus on detect-ing the sentiment trend towards a topic.
Acknowledgements
Subtasks Team Affiliation 2013?
B Alberta University of Alberta
B AMI ERIC AMI Software R&D and Universit´e de Lyon (ERIC LYON 2) yes
B AUEB Athens University of Economics and Business yes
B BUAP Benem´erita Universidad Aut´onoma de Puebla
B CISUC KIS University of Coimbra
A, B Citius University of Santiago de Compostela A, B CMU-Qatar Carnegie Mellon University, Qatar
A, B CMUQ-Hybrid Carnegie Mellon University, Qatar (different from the above)
A, B columbia nlp Columbia University yes
B cooolll Harbin Institute of Technology
A, B DAEDALUS Daedalus
B DejaVu Indian Institute of Technology, Kanpur
A, B ECNU East China Normal University yes
B GPLSI University of Alicante
B IBM EG IBM Egypt
A, B IITPatna Indian Institute of Technology, Patna
A, B IIT-Patna Indian Institute of Technology, Patna (different from the above) B JOINT FORCES Zurich University of Applied Sciences
A Kea York University, Toronto yes
B KUNLPLab Koc¸ University
B lsis lif Aix-Marseille University yes
A, B Lt 3 Ghent University
A, B LyS Universidade da Coru˜na
B NILC USP University of S˜ao Paulo yes
A, B NRC-Canada National Research Council Canada yes
B Rapanakis Stamatis Rapanakis
B RTRGO Retresco GmbH and University of Gothenburg yes
A, B SAIL Signal Analysis and Interpretation Laboratory yes
A, B SAP-RI SAP Research and Innovation
A, B senti.ue Universidade de ´Evora yes
A, B SentiKLUE Friedrich-Alexander-Universit¨at Erlangen-N¨urnberg yes
B SINAI University of Ja´en yes
B SU-FMI Sofia University
A, B SU-sentilab Sabanci University yes
B SWISS-CHOCOLATE ETH Zurich
B Synalp-Empathic University of Lorraine
B TeamX Fuji Xerox Co., Ltd.
A, B Think Positive IBM Research, Brazil
A TJP University of Northumbria at Newcastle Upon Tyne yes
B TUGAS Instituto de Engenharia de Sistemas e Computadores, yes
Investigac¸˜ao e Desenvolvimento em Lisboa A, B UKPDIPF Ubiquitous Knowledge Processing Lab
B UMCC DLSI Graph Universidad de Matanzas and Univarsidad de Alicante yes B UMCC DLSI Sem Universidad de Matanzas and Univarsidad de Alicante (different from above) yes A, B Univ. Warwick University of Warwick
B UPV-ELiRF Universitat Polit`ecnica de Val`encia
[image:7.595.80.530.155.638.2]B USP Biocom University of S˜ao Paulo and Federal University of S˜ao Carlos
References
Stefano Baccianella, Andrea Esuli, and Fabrizio Se-bastiani. 2010. SentiWordNet 3.0: An enhanced lexical resource for sentiment analysis and opinion mining. InProceedings of the Seventh International Conference on Language Resources and Evaluation, LREC ’10, Valletta, Malta.
Luciano Barbosa and Junlan Feng. 2010. Robust sen-timent detection on Twitter from biased and noisy
data. In Proceedings of the 23rd International
Conference on Computational Linguistics: Posters, COLING ’10, pages 36–44, Beijing, China.
Albert Bifet, Geoffrey Holmes, Bernhard Pfahringer, and Ricard Gavald`a. 2011. Detecting sentiment
change in Twitter streaming data. Journal of
Ma-chine Learning Research, Proceedings Track, 17:5– 11.
Tao Chen and Min-Yen Kan. 2013. Creating a live, public short message service corpus: the NUS
SMS corpus. Language Resources and Evaluation,
47(2):299–335.
Dmitry Davidov, Oren Tsur, and Ari Rappoport. 2010. Semi-supervised recognition of sarcasm in Twitter
and Amazon. InProceedings of the Fourteenth
Con-ference on Computational Natural Language
Learn-ing, CoNLL ’10, pages 107–116, Uppsala, Sweden.
Kevin Gimpel, Nathan Schneider, Brendan O’Connor, Dipanjan Das, Daniel Mills, Jacob Eisenstein, Michael Heilman, Dani Yogatama, Jeffrey Flanigan, and Noah A. Smith. 2011. Part-of-speech tagging for Twitter: Annotation, features, and experiments. In Proceedings of the 49th Annual Meeting of the Association for Computational Linguistics: Human Language Technologies, ACL-HLT ’11, pages 42– 47, Portland, Oregon, USA.
Roberto Gonz´alez-Ib´a˜nez, Smaranda Muresan, and Nina Wacholder. 2011. Identifying sarcasm in Twit-ter: a closer look. InProceedings of the 49th Annual Meeting of the Association for Computational Lin-guistics: Human Language Technologies - Short
Pa-pers, ACL-HLT ’11, pages 581–586, Portland,
Ore-gon, USA.
Bernard Jansen, Mimi Zhang, Kate Sobel, and Abdur Chowdury. 2009. Twitter power: Tweets as elec-tronic word of mouth. J. Am. Soc. Inf. Sci. Technol., 60(11):2169–2188.
Efthymios Kouloumpis, Theresa Wilson, and Johanna Moore. 2011. Twitter sentiment analysis: The
good the bad and the OMG! In Proceedings of
the Fifth International Conference on Weblogs and Social Media, ICWSM ’11, Barcelona, Catalonia, Spain.
Christine Liebrecht, Florian Kunneman, and Antal Van den Bosch. 2013. The perfect solution for
de-tecting sarcasm in tweets #not. In Proceedings of
the 4th Workshop on Computational Approaches to
Subjectivity, Sentiment and Social Media Analysis, pages 29–37, Atlanta, Georgia, USA.
Saif Mohammad, Svetlana Kiritchenko, and Xiaodan Zhu. 2013. NRC-Canada: Building the state-of-the-art in sentiment analysis of tweets. In Proceed-ings of the Seventh international workshop on Se-mantic Evaluation Exercises, SemEval-2013, pages 321–327, Atlanta, Georgia, USA.
Preslav Nakov, Sara Rosenthal, Zornitsa Kozareva, Veselin Stoyanov, Alan Ritter, and Theresa Wilson. 2013. SemEval-2013 task 2: Sentiment analysis in
Twitter. InSecond Joint Conference on Lexical and
Computational Semantics (*SEM), Volume 2: Pro-ceedings of the Seventh International Workshop on Semantic Evaluation, SemEval ’13, pages 312–320, Atlanta, Georgia, USA.
Brendan O’Connor, Ramnath Balasubramanyan, Bryan Routledge, and Noah Smith. 2010. From tweets to polls: Linking text sentiment to public opinion
time series. In Proceedings of the Fourth
Inter-national Conference on Weblogs and Social Media, ICWSM ’10, Washington, DC, USA.
Alexander Pak and Patrick Paroubek. 2010. Twit-ter based system: Using TwitTwit-ter for disambiguating
sentiment ambiguous adjectives. InProceedings of
the 5th International Workshop on Semantic Evalu-ation, SemEval ’10, pages 436–439, Uppsala, Swe-den.
Bo Pang, Lillian Lee, and Shivakumar Vaithyanathan. 2002. Thumbs up?: Sentiment classification using
machine learning techniques. InProceedings of the
Conference on Empirical Methods in Natural Lan-guage Processing - Volume 10, EMNLP ’02, pages 79–86.
Maria Pontiki, Harris Papageorgiou, Dimitrios Gala-nis, Ion Androutsopoulos, John Pavlopoulos, and Suresh Manandhar. 2014. SemEval-2014 task 4:
Aspect based sentiment analysis. InProceedings of
the 8th International Workshop on Semantic Evalu-ation, SemEval ’14, Dublin, Ireland.
Alan Ritter, Sam Clark, Mausam, and Oren Etzioni. 2011. Named entity recognition in tweets: An
ex-perimental study. InProceedings of the Conference
on Empirical Methods in Natural Language Pro-cessing, EMNLP ’11, pages 1524–1534, Edinburgh, Scotland, UK.
Andranik Tumasjan, Timm Sprenger, Philipp Sandner, and Isabell Welpe. 2010. Predicting elections with Twitter: What 140 characters reveal about
politi-cal sentiment. In Proceedings of the Fourth
Inter-national Conference on Weblogs and Social Media, ICWSM ’10, Washington, DC, USA.
Janyce Wiebe, Theresa Wilson, and Claire Cardie. 2005. Annotating expressions of opinions and
emo-tions in language. Language Resources and