Abstract—This paper presents the defect reduction in a surface mounting process using a combination of statistical process control and design of experiments techniques. Such process is used to produce the flexible printed circuit. It consists of three sub-processes; solder printing, mounting and reflowing process. The potential defects, including component missed position and non-component, were selected using the pareto diagram. Then, the main effects to these defects were introduced. For quickly response to these defects, the potential effects and their possible levels were firstly determined from the production data in the past. It was found that there were four potential factors which were the vision parameters, the number of fiducial marks, the reflowing profile and the number of push up pins. The improvement was performed using the main effect determination and found that the defect rate was reduced from 17,234 PPM to 8,141 PPM. After that the influential factors affecting to these defects were analyzed by applying 2k factorial experiments and the conventional statistical analysis. It was found that there were three potential factors which were the design aperture, the reflowing profile and the number of push up pins. It included an interaction effect between the number of push up pins and the number of fiducial marks. On the constrained response surface optimization a multiple linear regression model in a concept of the path of steepest descent, then, was applied to determine the suitable level of each factor. With the suitable level found, it was found that the variation of process was reduced providing the reduction of the defect rate to 6,265 PPM and seemed to better than the conventional statistical analysis.
Index Terms — Design of Experiment, Multiple Linear Regression, Constrained Response Surface Analysis, Flexible Printed Circuit, Surface Mounting
I. INTRODUCTION
URRENTLY, there is a fierce competition in the smart component manufacturing industry. The manufacturers
Manuscript received January 6, 2011. This work was supported by the National Research University Project of Thailand Office of Higher Education Commission. Furthermore, the authors would like to thank Department of Industrial Engineering, Faculty of engineering, Thammasat University for their financial and academic support in conducting this research.
* N. Suradom is with the Industrial Statistics and Operational Research Unit (ISO-RU), Department of Industrial Engineering, Faculty of Engineering, Thammasat University, 12120, THAILAND [Phone: (662)529-1804-11; Fax: (662)529-1812; e-mail: [email protected], [email protected]; [email protected]].
S. Homrossukon is an Assistant Professor, ISO-RU, Department of Industrial Engineering, Faculty of Engineering, Thammasat University, 12120, THAILAND.
P. Luangpaiboon is an Associate Professor, ISO-RU, Department of Industrial Engineering, Faculty of Engineering, Thammasat University, 12120, THAILAND.
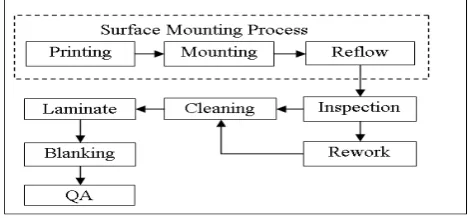
[image:1.595.307.545.300.409.2]need to maintain their potential for serving the customer demand by establishing the faster the production time and/or the lower the production costs. The case of interest is the manufacturing of flexible printed circuit [1]. This part will be assembled in hard disk drive device. The product of interest has only one connector part and four solder coating areas. Its production consists of eight processes as shown in Fig. 1.
Fig. 1 Production Process of Flexible Printed Circuit
Currently, the capability and the defect rate of this process are 2880pieces/hour and 17,234 PPM, respectively. These result in higher cost for rework process and lower productivity. The reduction of defect rate, the reduction of the cost and the increase the competition will be. In this case, this research will aim to reduce the potential defect. As there are a lot of types of defect found; therefore, the potential defects will be determined by applying the statistical process control technique. There will be a numbers of factors affecting to the defects of interest. In this case, constrained response surface optimization and the conventional statistical analysis will be conducted as it is the effective technique used to improve the quality of the general production process [2]-[3].
II. PRELIMINARY DETERMINATION
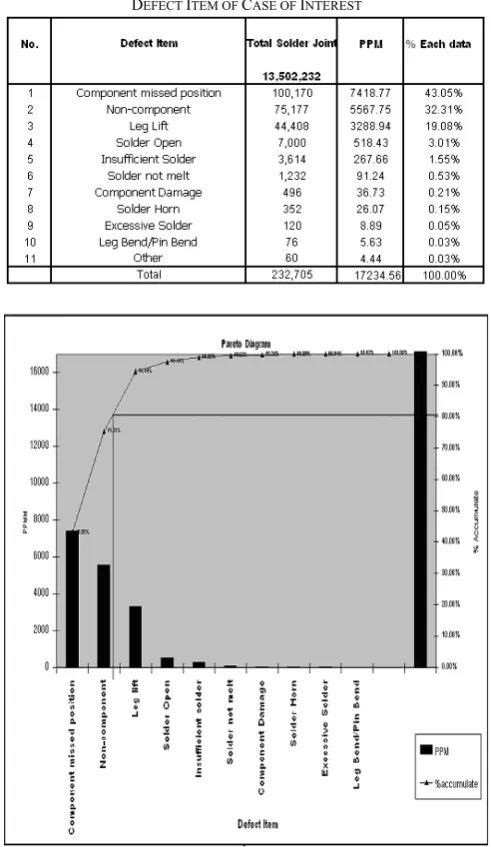
The data of defect were summarized as shown in Table I. It was found that the highest defect item was component missed position. In order to reduce the most defects, the pareto diagram was applied as shown in Fig. 2. It was found that there were three main defects of interest including component missed position, non-component, and leg lift. These defects were found in surface mounting processes which are the first three processes shown in Fig. 1. All components are assembled to the product at these processes only. Therefore, this work will mainly focus on the surface mounting process.
Surface Mounting Process Improvement via
Constrained Response Surface Optimization and
Conventional Statistical Analysis
N. Suradom*, S. Homrossukon and P. Luangpaiboon, Member, IAENG
A. Process Flow
Surface mounting consists of three consecutively processes as shown in Fig. 1. It starts with the printing process. In this process, the solder paste is printed on an opening area of flexible printed circuit board. Then, the finished part from printing process will be sent to mounting process. At this stage, the components will be mounted on an opening area by a mounter machine which is a pick and place type. Final process of surface mounting is reflowing process. The solder paste is melted by heating air in this process. The melted paste will connect the components with flexible printed circuit board.
TABLEI
DEFECT ITEM OF CASE OF INTEREST
Fig. 2 Pareto Diagram of Defects
B. Process Factor Analyses
The brainstorming activity among Process Engineer, Production and Quality Assurance members announced 10 possible factors affecting to the defects of interest. Four possible factors were found for solder printing process including printing speed (A), design aperture (B), metal mask thickness (C), and positioning during recognition (I). Five more possible factors were found for mounting process including the mounting height (D), the vision parameter (E),
the number of push up pins (F), the number of fiducial marks (G), and the pick up and mount speed (H). Finally, one more possible factor for reflowing process which is reflowing profiles (J).
C. Preliminary Analyses
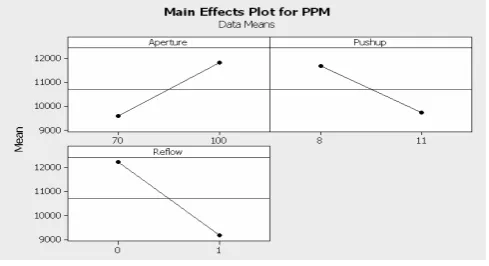
[image:2.595.45.291.215.639.2]Brain storming and preliminary analyses were performed by multidisciplinary team using two groups of production data in the past. The preliminary analyses focused on the main effects and the feasible ranges of production only. By ignoring the interaction effects between factors, it was found that there were four potential factors affecting to the process including factors E, F, G, and J. The main effects of these factors were plotted as shown in Fig. 3 and 4. Then, the selected level for process improvement was proposed as shown in Table II. The improvement via the preliminary analyses and brainstorming found that the defect rate was reduced for 52%. Even though the defect rate was reduced remarkably but it shall be reduced more if the factor of process was analyzed by the technique of design of experiment [2].
[image:2.595.307.545.313.449.2]Fig. 3 Main effect plots of production data group I
Fig. 4 Main effect plot of the production data group II
TABLEII
DEFECT ITEM OF CASE OF INTEREST POSSIBLE EFFECTED FACTORS AND
THEIR LEVEL
Factors Decision Variables
Operating Conditions Current Preliminary Analyses
E Vision Parameter Outer and
Inner Level Outer Level F Number of Push up Pins 9 11 G Number of Fiducial Marks 4 2
J Reflow Profile Ramp-Soak-Spike
Ramp-To-Spike
[image:2.595.315.538.488.594.2]III. METHODOLOGY FOR PROCESS IMPROVEMENT Most industrial processes have some process variables. For example, a response in a chemical reactor might be concentration of product and the process variables affecting this concentration might be temperature and pressure of a chemical plant. The process variables such as speed of lathe and advance of cutting tool in machining can be adjusted by plant operators or by automatic control mechanisms to enhance the efficiency of the machine. Care must be taken to operate industrial processes within safe limits, but optimal conditions are rarely attained and increased international competition means that deviations from the optimum can have serious financial consequences. In many cases the optimum changes with time and there is a need for a routine mode of operation to ensure that the process always operates at optimal or near-optimal conditions.
On the theory and practice of Response Surface Methodology (RSM) or EVolutionary OPerations (EVOP), it is assumed that the mean response () is related to values of the process variables (1, 2, …, k) by an unknown function f [3-6]. The functional relationship between the mean response and k process variables can be written as = f(), if denotes a column vector with elements 1, 2, …, k. Estimation of such surfaces, and hence identification of near optimal settings for process variables is an important practical issue with interesting theoretical aspects. The procedure begins with a factorial experiment around the prevailing operating condition. A sequence of first order models and line searches are justified on the basis that such a plane would be fitted well as a local approximation to the true response. The estimated coefficients for the first order model are determined using the principles of least squares. A sequence of runs is carried out by moving in the direction of steepest ascent. When curvature is detected, another factorial experiment is conducted. This is used either to estimate the position of the optimum or to specify a new direction of steepest ascent.
A. Constrained Response Surface Optimization (CRSO) In order to optimize the response that might be influenced by several process variables, various sequential procedures via statistic tools are then used. One among those is the multiple regression analysis. It is used to determine the relationship between the influential variable of x’s and the dependent variable or response of y that is modelled as a linear or nonlinear model. Multiple regression fits a nonlinear relationship between the value of x’s and the corresponding conditional mean of y and has been used to describe nonlinear phenomena. Although Multiple regression fits a nonlinear model to the data, it is linear as a statistical estimation problem, in the sense that the regression model is linear in the unknown parameters which are estimated from the experimental data.
Multiple regression models are usually fit using the method of least squares. The least-squares method, published by Legendre and Gauss, minimises the variance of the unbiased estimators of the coefficients. Multiple regression analysis played an important role in the development of regression analysis, with a greater emphasis on issues of design and inference. The aim of regression analysis is to formulate a model of the expected value of a dependent variable y in terms of the value of an influential
variable (or vector of influential variables) of x’s. In multiple linear regression, the model
0 1
k
i i i
y
x
is used, where ε is an unobserved random error with mean zero conditioned on a scalar influential variables of x’s. In this model, for each unit increase in the value of x, the conditional expectation of y increases by units of . Conveniently, these models are all linear from the point of view of estimation, since the regression model is linear in terms of the unknown parameters of β0, β1, .... Therefore, for least squares analysis, the computational and inferential problems of multiple regressions can be completely addressed using the multiple regression techniques. This is done by treating x, x2, ... as being distinct independent variables in a multiple regression model.
The procedure of steepest ascent is that a hyper plane is fitted to the results from the initial 2k (fractional) factorial designs. The direction of steepest ascent on the hyper plane is then determined by using principles of least squares and experimental designs. The next run is carried out at a point which is some fixed distance in this direction and further runs are carried out by continuing in this direction until no further increase in yield is noted. When the response first decreases another 2k design is carried out, centred on the preceding design point. A new direction of steepest ascent is estimated from this latest experiment. Provided at least one of the coefficients of the hyper plane is statistically significantly different from zero, the search continues in this direction. Once the first order model is determined to be inadequate, the area of optimum is identified via a finishing strategy [7].
Many response surface problems involve the analysis of several responses or product specifications. However, they can be categorised in to the major and minor responses when compared. In this research, the main objective is to focus on the only one response of y1 and the remaining of y2 will turn to be only the constraints that need to be met their acceptable ranges. The method of constrained response surface optimization (CRSO) is then applied for this study. Either linear or non linear programming methods will be fitted to measure the most suitable to the problems. Moreover, the boundary limitations of the process variables are also determined as model constraints. The details of sequential procedure for setting up the optimum value via a relationship of significant variables and responses are followed [8-9].
1. Fit various multiple regression models associated with influential variables and its response and formulate the most suit model as a problem objective.
2. Fit various multiple regression models associated with influential variables and its response and formulate the most suit model as a problem constraint to meet its specification.
3. Complete the models above with the limitation of feasible ranges of the process variables of x and form a model as follow.
Minimize ˆy1
Subject to x and ˆy2the requirement, where ˆy1
and ˆy2 are estimated major and minor responses,
4. Solving a model via a generalised reduced gradient method to find the optimal levels of process variables 5. Possibly adjust the obtained levels of process variables to
implement the surface mounting process.
B. Conventional Statistical Analysis
A conventional statistical analysis based on experimental designs is a combination of the experiments for observing and finding the causes that effect to the outputs by changing the input variables. Principles of experimental design have three main steps. First step is a randomization to provide the opportunities of data collecting for each of the equal distribution of uncontrolled factors. The second step is the replication to repeat the experiment for each data resulting in the elimination of the effects of the uncontrolled factors. The third step is blocking which is the group of collected data on the range to reduce the effect of uncontrollable factors. In this paper, the preliminary goal is to find out the main effects and the interaction between each factor that effect to the outputs or the quality of surface mounting. Therefore, the factorial experiment is applied.
A full factorial experiment is an experiment whose design consists of two or more factors, each with discrete possible values or levels, and whose experimental units take on all possible combinations of these levels across all such factors. A factorial experiment allows for estimation of experimental error in two ways. The experiment can be replicated and often be exploited. Replication is more common for small experiments and is a very reliable way of assessing experimental error. When the number of factors is large, replication of the design can become operationally difficult. In these cases, it is common to only run a single replicate of the design. In this paper, a factorial experiment is selected and has only single replication for estimated experiment error.
Conventional statistical analysis is a strategy to gather empirical knowledge, i.e. knowledge based on the analysis of experimental data and not on theoretical models. It can be applied whenever you intend to investigate a phenomenon in order to gain understanding or improve performance. Building a design means, carefully choosing a small number of experiments that are to be performed under controlled conditions. There are four interrelated steps in building a design [10]:
1. Define an objective to the investigation, e.g. better understand or sort out important variables or find optimum.
2. Define the variables that will be controlled during the experiment (design variables), and their levels or ranges of variation.
3. Define the variables that will be measured to describe the outcome of the experimental runs (response variables), and examine their precision.
4. Among the available standard designs, choose the one that is compatible with the objective, the number of design variables and precision of measurements, and has a reasonable cost.
Standard designs are well-known classes of experimental designs. They can be generated automatically as soon as you have decided on the objective, the number and nature of design variables, the nature of the responses and the number of experimental runs you can afford. Generating such a design will provide you with a list of all experiments you must perform, to gather enough information for your
purposes. It is widely used in research and development, where a large proportion of the resources go towards solving optimization problems.
IV. EXPERIMENT RESULT AND ANALYSES
This section will present the methodology used to reduce the potential defect found in surface mounting processes. The work resumed by declaring the process flow of mounting. Then, the possible parameters affecting to such processes will be considered. After that 2k factorial design will be used to analyze the parameters which mainly effect to the processes of interest. Finally, the suitable level of the affected parameter will be determined and process will be arranged according to this level to conform the result.
A. Factor Levels Determination
The design of experiment will be resumed by applying 2k factorial design to screen the potential factor affecting to the process of interest. Therefore, there will be two factor levels, low and high, for each parameter. The factor of positioning during recognition (I) is a fixed factor since it is a machine specification which cannot be adjusted according to the manufacturer. Therefore, the number of variable factor was reduced from 10 to 9. The design of factor levels were based on the process specification and the production data from the past and their values were shown in Table III.
TABLEIII
PROCESS VARIABLES AND THEIR FEASIBLE RANGES
Factor unit Feasible ranges
Lower Upper Current Printing Speed (A) mm/sec 20 100 40 Design Aperture (B) % 70 100 95 Metal Mask Thickness
(C) m
80 150 150
Mounting Height (D) mm -0.5 +0.5 0.0 Vision Parameter (E) - OL OL and
IL
OL and IL Number of Push up
Pins (F)
pins 8 11 9
Number of Fiducial
Marks (G) marks 2 4 4
Pick up and Mount Speed (H)
% 10 100 80
Reflow Profile (J) - RSS RTS RSS Note: OL is outer level, IL is inner level, RSS is Ramp-Soak-Spike and RTS is Ramp-To-Spike
B. Experimental Result and Analyses
Fig. 5 Experimental Results from Doubled Replicates From Fig. 5, it was found that data was random and independent off each others. The influential factors were defined from the normal probability plot. The relative magnitudes of the effect were compared and evaluated their statistical significance. If the design points do not fall near the line usually significantly important effects, important effects are larger and apart from the fitted line than less important effects. Less important effects seem to be smaller and centered close to zero. The replicate experiment was then performed.
[image:5.595.47.292.69.226.2]The normal probability plot of effects using a significant level of 0.05 for these experiments was shown in Fig. 6. These experiments were analyzed using a general linear form of analysis of variance (ANOVA). The result shows that there were 3 main factors including design aperture (B), number of push up pins (F), and reflow profile (J). For interaction effects, there was interaction between F and G. The details of analyses were shown in Table IV.
Fig. 6 Normal Probability Plot of Effects
TABLEIV
ANOVA WITH ALL MAIN EFFECTS AND 2-WAY INTERACTIONS FOR THE 29
FULL FACTORIAL DESIGNS WITH DOUBLE REPLICATES
Sources of Variation
P-value Sources of Variation
P-value
A 0.707 B* J 0.254
B 0.014 C* D 0.221
C 0.337 C*E 0.224
D 0.063 C*F 0.511
E 0.087 C*G 0.860
F 0.033 C*H 0.936
G 0.517 C*J 0.517
H 0.647 D*E 0.985
J 0.001 D*F 0.663
A* B 0.981 D*G 0.664
A* C 0.244 D*H 0.751
A* D 0.624 D*J 0.935
A* E 0.390 E*F 0.591
A* F 0.298 E*G 0.218
A* G 0.387 E*H 0.187
A* H 0.524 E*J 0.620
A* J 0.127 F*G 0.001
B* C 0.380 F*H 0.765
B* D 0.110 F*J 0.237
B* E 0.303 G*H 0.468
B* F 0.608 G*J 0.060
B* G 0.384 H*J 0.229
B* H 0.835
[image:5.595.305.550.318.451.2]In order to determine the appropriate setting of the decision variables, the main and interaction were plotted and were illustrated in Fig. 7 and 8. From the factor analyses, it was found that the proper levels of factors from main effect plot including the design aperture (B), the number of push up pins (F) and reflow profile (J) were set at 70, 11, and 1, respectively. The proper levels factor from the interaction plot in Fig. 8 of the number of push up pins (F) with number of fiducial marks (G) was set at 11 and 2, respectively.
[image:5.595.51.287.461.613.2]Fig. 7 Significant Main Effect Plot
Fig. 8 Significant Interaction Effect Plot
[image:5.595.306.548.479.582.2]Fig. 9 Multiple Linear Regression Analysis of a Preliminary Experiment and its ANOVA Table
From the mathematical programming models then formulation to minimize the desired response value of defect rate is followed.
Minimize ŷ1 = 12091 + 74.48B – 648.8F – 3074.8J Subject to
70 < B < 100 8 < F < 11 0 < J < 1
; where ŷ1 denotes the defect rate.
From regression equation shown as above, the factor of reflowing profile was set as Ramp-To-Spike. For the calculation, Ramp-To-Spike is defined as upper level of this factor and has the value equal to 1. Then, the remaining factors could be solved.
It was found that proper level of design aperture (B) is equal to 67.25 and proper level of number of push up pins (F) is equal to 13.97. For design aperture (B), its minimum level is 70; therefore, the possible proper level of design aperture (B) shall be set at 70. For number of push up pins (F), the maximum level is 11. Therefore, the possible proper level of push up pins shall be set at 11.
V. CONCLUSION
From the design of experiment, the process settings for all influential factors are shown in Table V. The performance after the improvement can be evaluated from the defect rate, part per million PPM.
TABLEV
COMPARISONS OF INFLUENTIAL VARIABLE LEVELS AFTER THE FIRST
IMPROVEMENT
Factors Decision Variables Operating Conditions
Previous Improvement
B Design aperture 90 70
F Number of push up
pins 9 11
J Reflow profile Ramp-Soak-Spike
Ramp-To-Spike
Response PPM (average) 17234 6265
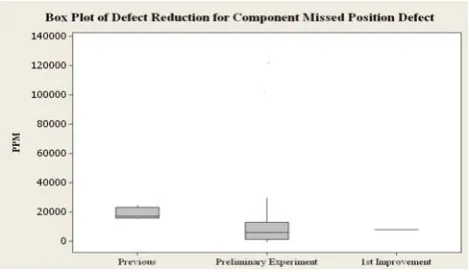
Comparing the improvement among two alternatives of the conventional statistical analysis and design of experiment (preliminary experiment) and the constrained response surface optimization (1st Improvement), it was found that two main defects were reduced. The reduction of component missed position defect was shown in Fig. 10 whereas the reduction of non-component defect was shown in Fig. 11.
From the results, the preliminary analyses by considering only main effect could improve the process by reducing the defect rate for 52% from the origin (Table II). With the experiment using full factorial design, the process was further improved as the average defect rate was reduced for 63.6% from the origin (Table V).
Fig. 10 Box Plot of Defect Reduction for Component Missed Position Defect
[image:6.595.310.545.350.486.2]REFERENCES
[1] F.C. Clyde, Jr., “Printed Circuits Handbook,” 3rd Ed, California:
McGraw-Hill, 1988.
[2] D.C. Montgomery, “Design and Analysis of Experiments,” 5th Ed
New York: John Wiley & Sons, 2001.
[3] R.H. Myers and D.C. Montgomery, “Response Surface Methodology: Process and Product Optimization using Designed Experiments,” John Wiley & Sons, Inc, 1995.
[4] G.E.P. Box and K.B. Wilson, “On the Experimental Attainment of Optimum Conditions,” Journal of the Royal Statistical Society, Series. B, vol. 13, 1951, pp. 1-45.
[5] G.E.P. Box and N.R. Draper, “Evolutionary Operation, A Statistical Method for Process Improvement,” John Wiley & Sons, Inc, 1969. [6] G.E.P. Box, “Evolutionary Operation: a Method for Increasing
Industrial Productivity,” Applied Statistics, vol. 6, 1957, pp. 81-101. [7] P. Luangpaiboon, “Proposed Finishing Strategies Based on
Experimental Designs for Process Optimization,” Thammasat International Journal of Science and Technology, pp. 39-45, 2001. [8] P. Luangpaiboon and P. Sermpattarachai, “Response Surface
Optimization via Steepest Ascent, Simulated Annealing and Ant Colony Optimization Algorithms,” Proceedings of the DSI International Conference 2007, Bangkok, Thailand, 2007.
[9] P. Luangpaiboon, Y. Suwankham, and S. Homrossukon (2010), “Constrained Response Surface Optimization for Precisely Atomising Spraying Process”, IAENG Transactions on Engineering Technologies, Vol. 5, pp. 286-300.