Abstract— Using a portable biopotential amplifier (Electroneurograph), the evoked response of the Ulnar nerve has been recorded from patients with moderate to acute diabetic neuropathic conditions. The ENG signals are again simulated and the features of these signals are extracted using Prony’s feature extraction method. The poles and resonance frequencies of ENG signals are used as features. A multilayer feed forward neural network classifier is applied to these features for the classification of Neuropathic Conditions. Identification of moderate to acute diabetic neuropathic conditions at various stages is the primary significance of this technique which helps the doctor for better diagnosis and to go for advanced treatment.
Index Terms— Electroneurograph, Ulnar nerve, Diabetic neuropathy, Prony’s method, Artificial neural network.
I. INTRODUCTION
iabetic neuropathy is the most common and troublesome complication of diabetes mellitus leading to great morbidity and resulting in a huge economic burden for diabetes care. Diabetic patients have a greater risk factor of developing nervous disorders when compared with non-diabetic subjects. The presence of other vascular complications such as peripheral vascular disease in diabetes increases the risk of diabetic foot complications. However, the progression of neuropathy can be reduced by early detection and intervention [1].
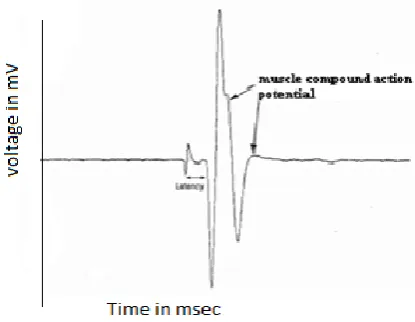
Nerve conduction studies, primarily nerve conduction velocities are considered as one of the most sensitive indices of the severity of diabetic neuropathy. Electroneurography is the recording and study of action potential propagation along peripheral nerves. Neurological examination of peripheral nerve function refers to the nerve conduction study which is based on evoked potential. Evoked potentials are obtained when electric pulses are passed through the excitable tissues like nerves and muscles. For nerve conduction studies the parameters of the evoked responses required are the amplitude, latency and area of the responses recorded.
Manuscript received July 17, 2012; revised August 03, 2012. V. Sajith, Associate Professor, University of Kerala,
Ph: +91 9446404444, e-mail:[email protected]) A. Sukeshkumar, Retired Principal, University of Kerala, e-mail: [email protected])
Jinto Jacob, University of Kerala, email:[email protected])
Fig. 1. Typical Normal Ulnar nerve
With this method it is very easy to conduct study of neurological examinations like conduction velocity measurement. An economic, versatile, compact and portable biopotential amplifier has been designed and implemented for measuring the latency to calculate the conduction velocity of ulnar and median nerves of patients with diabetic neuropathic conditions [2]. The specific application is developed according to the requirements of the experimental research practice on the study of compound action potentials of nerves in the field of neurophysiology [3]. Early detection of conduction failure of ulnar nerve in patients with diabetic type 1 and 2 is possible using conduction velocity measurement[4]. For the identification of various neuropathic conditions a mathematical model of the evoked response of diabetic patients using discrete state space modeling is done[5]. This paper establishes the identification of moderate to acute diabetic neuropathic conditions of simulated ulnar nerve response using prony’s method.
Many methods and algorithms from signal processing theory have been proposed, described and implemented over the past few years to extract feature from signals such as total least squares based Prony’s modeling algorithm[6], autoregressive model[7],wavelet transform[8], multiple signal classification (MUSIC) algorith[9]. Drawback of these techniques mentioned above is the significant amounts of computation and processing time for extracting the features and the classifications technique employed.
Identification of Moderate to Acute Diabetic
Neuropathic Conditions of Simulated Ulnar
Nerve Response using Prony’s Method
V. Sajith, A. Sukeshkumar and Jinto Jacob
The objective of the present work is to apply Prony’s method to represent the ENG signal as a sum of exponentials in order to classify certain ENG identification based on the calculation of the resonance frequencies and the accompanied poles. Resonance complex frequencies of a signal can be used as useful feature for signal discrimination and identification.
The advantage of Prony’s method is its simplicity and applicability in real time where a big amount of data may exist. The resonance frequencies computed were classified using multilayer feed forward network classifier models to determine the different classifications of diabetics.
The paper is organized as follows. Section II introduces the method proposed. Section III describes the preprocessing procedure used in this work. Section IV gives a review on the feature extraction method of the proposed work. Section V gives the classifier model used. Section VI discusses implementation procedure. Section VII discusses simulation results.
II.METHODOLOGY A. Normal method
In order to study the function of neurons it is usually the practice to stimulate the nerve and study the action potentials generated by it. The nerve can be stimulated to greater activity by either electrical or chemical stimulation. Here we are interested only in electrical stimulation which is easily controllable. The electrical stimulation can be either constant voltage or constant current. It actually involves passing an appropriate electric current through a region of tissue and thereby causing the neurons in the area to be depolarized.
The nerve stimulation techniques are performed with a variable stimulus generator. The stimulus frequency, stimulus intensity and stimulus duration must be known, adjustable and have an ON / OFF control.
The input portion of the instrumentation amplifier which is named head stage is designed separately and the inputs from the electrodes are given to the head stage by means of shielded coaxial cable. Also the electroneurograph is properly shielded and grounded to minimize the noise effect.
Offset control is provided for base line shift. The stimulating and recording electrodes were placed in appropriate positions and evoked responses were recorded. The block diagram of the recording setup is shown in figure 2.
The normal method adopted for the measurement of conduction velocity is by stimulating at two different points along the nerve and measuring the latency for each electrical response recorded from the muscle. For each stimulation, the time between the start of the stimulus and the onset of
The length of nerve segment is obtained by measuring on the surface of the skin the distance between the cathodes when placed for each stimulation. The conduction velocity is obtained by dividing the nerve length between the two stimulating points by difference in latency which is usually expressed in meters per second. It has been observed that a mean conduction velocity of 55.71 m/sec and a standard deviation of 3.01m/sec was measured for the normal Ulnar nerve[3].The electrode positions for the recordings and responses of the Ulnar nerve and are shown in fig.2.
[image:2.595.313.521.547.708.2]Fig. 2.Recordical setup
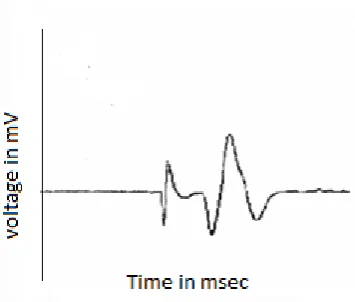
Figure 3 shows the Ulnar nerve response of a normal patient. Figure 4 depicts the Ulnar nerve response of a moderate diabetic patient and Figure 5 shows the Ulnar nerve response of an acute diabetic patient.
Fig. 4. Nerve action potential-moderate
Fig. 5. Nerve action potential-acute
Fig. 6 .Proposed system B. Proposed method
[image:3.595.65.243.54.205.2]The different stages of the proposed methods to identify diabetic neuropathy based on ENG signals are depicted in Fig. 6. It mainly consists of four stages: ENG database, Preprocessing stage, Feature extraction stage, Classification stage. The digital ENG signals are taken using above setup and are stored to form database. These signals are first preprocessed to remove baseline wander, power line interference and high frequency noise. Now Prony’s method is applied to extract feature from ENG signals [10]. Finally, neural network classifier models are used to test those features and the diagnosis is made.
III. PREPROCESSINGSTAGE
All ENG data’s have been filtered to remove the noise that may influence the signal including, baseline wander, artifact, and power line interference. The presence of these noise sources in the signal may mislead the feature extraction and classification.
Butterworth high pass filter is designed to remove these low bands of frequencies. The cutoff frequencies of the high pass filter is selected as 150 Hz.
IV. REVIEWONPRONY’SMETHOD
Prony’s method[10] is a technique for modeling sampled data as a linear combination of damped exponentials as given below
Where n= 1,2,3,…N (N-samples),
Ts is the sampling period, Ak is the amplitude, αk is the damping factor, ώk is the angular velocity, Φk is the initial Phase and k is the exponential code.
The Prony’s method evaluates the model parameters by solving two sets of linear equations. To find the first set of linear equations, let us consider the polynomial having the zk as its roots:
With a(0)=1.
Using Eq. (2) and with proper manipulations on relations (1), this results as
With n=M+1,M+2,…N.
In (3), using the position ,
the right-hand side contains the polynomial F(z) evaluated at its root zk, then:
With n = M + 1,M + 2,. . . ,N. The (N-M) relations (5) constitute a linear equation system in M unknowns, i.e. the a(m) coefficients.
Using N = 2M samples the system (5) represents an M equation system with the same number of unknowns. For practical situations there exists a non-trivial solution due to Nyquist-Shannon digital sampling theorem, the number of data points N usually exceeds the minimum number needed to fit a model of exponentials, i.e. N >2M. In this over determined data case, the linear equation (5) must be modified to:
The estimation problem bases on the minimization of the total squared error, e(n):
With the knowledge of the a(m) coefficients, the roots zk of the characteristic polynomial (2) can be calculated. The damping factors and frequencies of each component may be evaluated from these known roots. Finally to calculate the amplitudes and phases of each component it is necessary to solve the second set of linear equations (1) in the unknown’s hk. The poles and the accompanied resonance complex frequencies, fk of the ENG signal can be directly calculated as ,zk/Ts.
V.CLASSIFICATIONSTAGE
There is several classification models like Artificial Neural Network- Nearest Neighbor, Linear Discriminate Analysis and Support Vector Machines are used for the diagnosis. In this work we have used ANN for the classification.
Multilayer feed forward network named the multilayer perceptron(MLPs) is employed as a class of neural networks .Usually, MLP is made up of several layers of neurons. Each layer is fully connected to the next one. MLP consists of two phases, the training phase and the testing phase. During the training phase, the features are applied at the input and the corresponding desired classes are at the output of MLP classifier. A training algorithm is executed to adjust the weights and the bias until the actual output of the MLP matches the desired output and performance satisfaction is reached. In the test phase, a set of test features, which are not part of training features, are applied to the trained MLP classifier to test the classification of the unknown features.
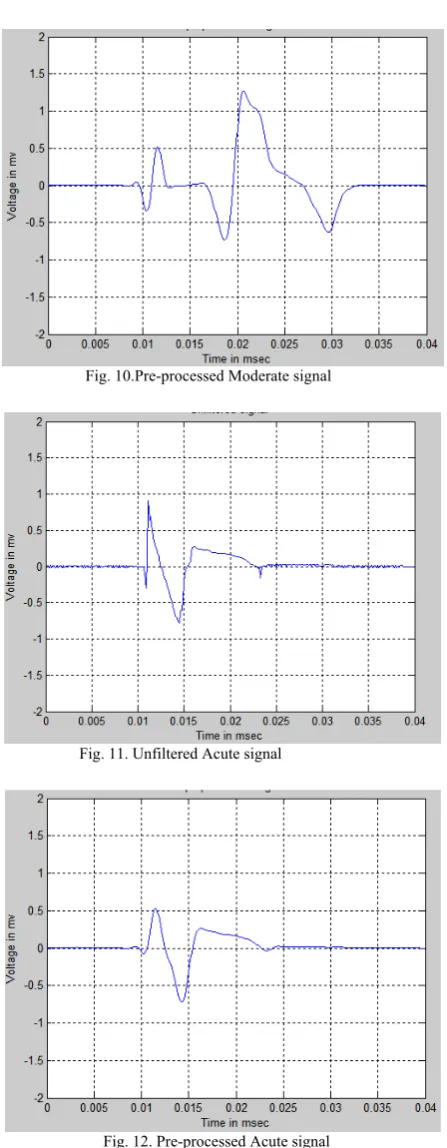
VI. IMPLEMENTATIONPROCEDURE Initially, signals were filtered using a Butterworth high pass filter with cutoff frequency of 150 Hz to reduce the noise. Figure 7, shows a normal signal corrupted with baseline drift and power line interference noise. In Figure 8, shows a noise free signal as a result of applying the Butterworth high pass filter. Similarly figure 9 and figure 11 corresponds to moderate and acute. Figure 10 and figure 12 are their preprocessed waveforms.
Fig. 7. Unfiltered Normal signal
Fig. 8. Pre-processed Normal signal
Fig. 10.Pre-processed Moderate signal
Fig. 11. Unfiltered Acute signal
Fig. 12. Pre-processed Acute signal
[image:5.595.57.281.36.611.2]Testing and training sets are separately formed. The numbers of testing and training samples are shown in Table I. We randomly select the given number of training and testing evoked responses of ulnar nerve from the selected recordings.
TABLE I:- NUMBER OF SAMPLES USED FOR STUDY
Type of signal Training samples Testing samples
Normal 10 50
Moderate 10 50
Acute 10 50
In our experiments, we used the multilayer perceptron(MLP) as the pattern classifiers. The original data set was separately divided into training and testing groups. Two factors that might affect the efficiency of MLP are the number of hidden layer neurons and synapses initial weigh. Experiments were performed to test the effects of the initial weight and the number of hidden layer neurons parameter.
The performances of the classification are evaluated in terms of sensitivity, specificity, and overall accuracy. Sensitivity and specificity are used to evaluate the ability of the classification system to discriminate one class against the other. The sensitivity is calculated as the proportion of positive samples correctly assigned to the positive class. The specificity is the proportion of negative samples correctly assigned to the negative class. The overall accuracy is the fraction of the total number of simulated responses correctly classified.
VII. EXPERIMENTAL RESULTS
[image:5.595.56.280.56.305.2]The classification results using MLP is given in Table II. The diagonal elements in the table are the number of correctly classified response of specific ENG types using the proposed method. In Table 2, MLP neural network generally provides adequate recognition throughout all categories.
TABLE II: - CLASSIFICATION RESULT
Actual/Classified Normal Moderate Acute Normal 50 0 0 Moderate 0 50 0
Acute 0 0 50
Table III shows the sensitivity, specificity, and overall accuracy of the extracted feature set with MLP classifiers. The results are computed when the number of MLP hidden layer neurons is 55. Average of specificity is 100% for MLP classifier. Also the average of overall accuracy is 100%.
TABLE III: - SENSITIVITY, SPECIFICITY AND OVERALL ACCURACY
Type Average (%)
Sensitivity Normal Moderate Acute
100 100 100 Specificity Normal Moderate
Acute
100 100 100
Overall accuracy 100
VIII.CONCLUSION
The results of this study have significance in diagnosis of diabetic neuropathy at various stages. This also helps the doctor to identify the level of diabetics and take immediate remedial steps.
[image:5.595.299.549.525.622.2]ACKNOWLEDGMENT
The authors take this opportunity to acknowledge generous support and feedback extended by the Principal, College of Engineering, Trivandrum and my colleagues.
REFERENCES
[1] ViswanathanVijaj, Seena Rajasekar, Mamtha Nair, Snehalatha Chamukutan, Bhoopathy R, Ramachandran Ambady ,“Nerve conduction abnormalities in different stages of glucose intolerance,” Neurology India, October 2004.
[2] V.Sajith, A Sukeshkumar, “Design and Intra-operative Studies of an Economic Versatile Portable Biopotential Recorder,” 13th ICBME conference proceedings, Singapore, December 3-6, 2008.
[3] V.Sajith, A. Sukesh Kumar, “Studies on Conduction Velocity of Ulnar and Median Nerves in Patients with Moderate to Acute Diabetic Neuropathic Conditions,” ICOICT 2009, International Conference on Optoelectronics, Information and Communication Technologies, India, February 2009.
[4] V.Sajith, A. Sukesh Kumar, “Early Detection of Conduction Failure of Ulnar Nerve in patients with Diabetic Type 1 and Type 2,” World Academy of Science, Engineering and Technology 54, PP. 1347 to 1350., 2009.
[5] V.Sajith, A. Sukesh Kumar, “Mathematical Model of the Nerve Evoked Response Recorded Using Electroneurograph in Diabetic Patients using State Space Modeling – A New Approach,” International Conference on Modeling and Simulation (MS09), PP. 293 to 296., 1-3 December, 2009.
[6] SW Chen.,“Two-stage discrimination of cardiac arrhythmias using a total least squares-based prony’s modeling algorithm,” IEEE Transaction on Biomedical Engineering, vol. 47, pp. 1317-1326, 2000. [7] DingfeiGe, Narayanan Srinivasan, Shankar Krishnan., “Cardiac
arrhythmia classification using autoregressive modeling,” in Biomedical Engineering OnLine,1(1):5, pp. 1585-1588, 2002.
[8] Inan, O.T., Giovangrandi, L. and Kovacs, G.T.A., “Robust neural network based classification of premature ventricular contractions using wavelet transform and timing interval features,” IEEE Transaction on Biomedical Engineering,, vol. 53, no. 12, pp. 2507-2515, 2006.
[9] Ahmad R. Naghsh-Nilchi and A. Rahim Kadkhodamohammadi, “Cardiac Arrhythmias Classification Method Based on MUSIC, Morphological Descriptors, and Neural Network,” EURASIP Journal on Advances in Signal Processing, Article no. 202, Volume II, 2008. [10] T. Lobos, J. Rezmer, P. Schegner, “Parameter Estimation of Distorted
Signals Using Prony’s Method, “IEEE Bologna Power Tech Conference, Bologna/Italien, 2003.
Sajith Vijayaraghavan, received the B.Tech Degree in Electronics and Communication from University of Kerala, India, in 1990, M.Tech degree in Biomedical Engineering from Indian Institute of Technology (IIT), Bombay, India, in 1996 and currently working towards Ph.D. at University of Kerala, India. He was faculty in the Department of Electronics and Communication, TKM College of Engineering Kollam, from 1991 – 2003. He was the Joint Director of Institute of Human Resource Development, Director, Kerala State Science and Technology Museum and Director, Vocational Higher Secondary Education Department, Govt. of Kerala during the year 2004 – 2007. Currently working as Associate Professor in Electronics and Communication Engineering Department, College of Engineering, Trivandrum, Kerala, India. He is a Senior Member of IEEE, Life member of Indian Society for Technical Education (ISTE) and member of All India Biomedical Engineers Association. He was the recipient of “Rab Larry K Wilson Regional Student Activities Award” of IEEE Region 10, Received “Young Scientist Award in Engineering” and “Young Scientist Fellowship” from the Department of Science and Technology, Govt. of Kerala. Received the “Best Paper Award 2009” in Biomedical Engineering in the International Conference ICOICT 2009 held in Trivandrum, India. Presented papers in International Conferences at Singapore, France, Austria apart from various Conferences in India.
A. Sukesh Kumar, received B.Tech in 1976 from University of Kerala, M.Tech. in 1988 from Jadaypur University and PhD in 1999 from Bharathiyar University. He worked as UG and PG Dean at College of Engineering Trivandrum and worked as Principal, College of Engineering, Sreekrishnapuram, Palakkad. He was Director of LBS Centre for Science & Technology, Govt. of Kerala undertaking and Centre for Continuing Education, Govt. of Kerala Undertaking (CCEK). He also worked as Principal Rajadhani Institute of Technology, Attingal, Trivandrum. Received “Best Paper Award” in Biomedical Engineering at 21st National Conference (NSC 97) and 22nd National Conference (NSC 98). He published 128 papers in conferences/Journals. Presented Papers in International conferences at Singapore, Malaysia, France and Egypt apart from various conferences in India.