ORIGINAL RESEARCH
SPINE
Cervical Spinal Cord DTI Is Improved by Reduced FOV with
Specific Balance between the Number of Diffusion Gradient
Directions and Averages
XA. Crombe,XN. Alberti,XB. Hiba,XM. Uettwiller,XV. Dousset, andXT. Tourdias
ABSTRACT
BACKGROUND AND PURPOSE: Reduced-FOV DTI is promising for exploring the cervical spinal cord, but the optimal set of parameters needs to be clarified. We hypothesized that the number of excitations should be favored over the number of diffusion gradient directions regarding the strong orientation of the cord in a single rostrocaudal axis.
MATERIALS AND METHODS: Fifteen healthy individuals underwent cervical spinal cord MR imaging at 3T, including an anatomic 3D-Multi-Echo Recombined Gradient Echo, high-resolution full-FOV DTI with a NEX of 3 and 20 diffusion gradient directions and 5 sets of reduced-FOV DTIs differently balanced in terms of NEX/number of diffusion gradient directions: (NEX/number of diffusion gradient directions⫽3/20, 5/16, 7/12, 9/9, and 12/6). Each DTI sequence lasted 4 minutes 30 seconds, an acceptable duration, to cover C1–C4 in the axial plane. Fractional anisotropy maps and tractograms were reconstructed. Qualitatively, 2 radiologists rated the DTI sets blinded to the sequence. Quantitatively, we compared distortions, SNR, variance of fractional anisotropy values, and numbers of detected fibers.
RESULTS:Qualitatively, reduced-FOV DTI sequences with a NEX ofⱖ5 were significantly better rated than the full-FOV DTI and the reduced-FOV DTI with low NEX (N⫽3) and a high number of diffusion gradient directions (D⫽20). Quantitatively, the best trade-off was reached by the reduced-FOV DTI with a NEX of 9 and 9 diffusion gradient directions, which provided significantly fewer artifacts, higher SNR on trace atb⫽750 s/mm2and an increased number of fibers tracked while maintaining similar fractional anisotropy values and
dispersion.
CONCLUSIONS: Optimized reduced-FOV DTI improves spinal cord imaging. The best compromise was obtained with a NEX of 9 and 9 diffusion gradient directions, which emphasizes the need for increasing the NEX at the expense of the number of diffusion gradient directions for spinal cord DTI contrary to brain DTI.
ABBREVIATIONS:CSC⫽cervical spinal cord; FA⫽fractional anisotropy; f-FOV⫽full-FOV; MERGE⫽Multi-Echo Recombined Gradient Echo; NDGD⫽number of diffusion gradient directions; r-FOV⫽reduced-FOV
C
ervical spinal cord (CSC) assessment in daily clinical routines still essentially relies on a qualitative evaluation of conven-tional MR imaging sequences. Nonetheless, addiconven-tional sequences could provide more sensitive information about CSC alterations,notably in inflammatory, traumatic, and neurodegenerative dis-eases.1-5Among the sequences, diffusion tensor imaging,
classi-cally based on single-shot echo-planar imaging, could provide valuable qualitative information and quantitative surrogate biomarkers.
While DTI has been widely investigated in the brain, its use for CSC imaging is still challenging and is restricted to preclinical and monocentric clinical studies. Several reasons for these limitations include the CSC being a small structure, prone to distortions;
Received February 23, 2016; accepted after revision April 25.
From the Centre Hospitalier Universitaire de Bordeaux (A.C., V.D., T.T.), Service de NeuroImagerie Diagnostique de The´rapeutique, Bordeaux, France; Institut National de la Sante´ et de la Recherche Me´dicale U1215 (A.C., V.D., T.T.), Physiopathologie de la Plasticite´ Neuronale, Bordeaux, France; Institut de Bio-Imagerie de Bordeaux (A.C., N.A., B.H., V.D., T.T.), Universite´ de Bordeaux, Bordeaux, France; Centre de Re´sonance Magne´tique des Syste`mes Biologiques (N.A., B.H.), Centre National de la Recherche Scientifique Unité Mixte de Recherche 5536, Bordeaux, France; Institut de Neurosciences Cognitives et Inte´gratives d’Aquitaine (B.H.), Centre National de la Recherche Scientifique Unité Mixte de Recherche 5287, Bordeaux, France; and GE Healthcare (M.U.), Ve´lizy–Villacoublay, France.
The work was supported by public grants from the French Agence Nationale de la Recherche within the context of the Investments for the Future program refer-enced ANR-10-LABX-57 named TRAIL (Translational Research and Advanced Imag-ing Laboratory) and ANR-10-LABX-43 named BRAIN (Bordeaux Region Aquitaine Initiative for Neurosciences).
Paper previously presented in part at: Annual Meeting of the French Society of Radiology, October 19, 2014; Paris, France; and Annual Meeting of the French Soci-ety of Neuroradiology, April 8, 2015; Paris, France.
Please address correspondence to Amandine Crombe, Service de Neuroimagerie Diagnostique et The´rapeutique, Hopital Pellegrin, CHU de Bordeaux, Place Ame´lie Raba-Leon, 33076 Bordeaux cedex, France; e-mail: [email protected]
Indicates open access to non-subscribers at www.ajnr.org
susceptibility artifacts, especially with a long echo-planar readout train; flow artifacts; and physiologic motion artifacts.
Among the various methods that have been implemented on MR imaging systems to improve DTI quality, reduced field-of-view (r-FOV) is particularly promising. It consists of reducing the FOV in the phase- or frequency-encoding direction to shorten the echo-planar readout train and attenuate susceptibility- and mo-tion-related artifacts.6-11Because the CSC is a small longitudinal
structure, r-FOV is especially suitable for its exploration. One of the r-FOV techniques uses a 2D echo-planar radiofrequency pulse to excite a rectangular FOV, with contiguous multisections. The k-space is then more rapidly acquired for the same spatial resolu-tion, which decreases single-shot EPI artifacts together with in-herent fat suppression.6
On qualitative analysis, this CSC r-FOV diffusion-weighted imaging method obtained from 3 orthogonal diffusion gradient directions has already demonstrated its ability to better detect anatomic details, with fewer ghosting and blurring artifacts,12
while apparent diffusion coefficient values were stable compared with conventional full-FOV CSC DWI (f-FOV).
However, there is no recommendation regarding the optimal set of parameters to perform r-FOV DTI in CSC. Some consensus has been reached (regarding the b-value, voxel size, number of excitations, number of diffusion gradient directions [NDGD], and bandwidth13), but these recommendations concern f-FOV
DTI with parallel imaging, whose sequence scheme is different from the r-FOV scheme. The smaller voxel size in r-FOV inher-ently leads to a decrease of the signal-to-noise ratio. Classic strat-egies to recover SNR consist of increasing the NEX and/or the NDGD. Unlike brain DTI, for which the NDGD should be pre-ferred over the NEX, there is no consensus about the best pair of NEX/NDGD for CSC DTI to handle with the complex fiber ori-entation. One might even hypothesize that the best trade-off of NEX/NDGD could be obtained by favoring NEX (unlike for brain DTI) because the CSC is particularly affected by artifacts and pres-ents a single prominent orientation. It is difficult to rely on phan-tom studies or theoretic analyses for such optimization in the CSC, which could not take into account CSF pulsations, heart-beats, or patient respiratory motions.
Therefore, the purpose of this study was to compare different sets of r-FOV CSC DTI, depending on different pairs of NEX and NDGD, and a standard f-FOV DTI. To do so, we used an empiric nonsequential optimization approach, in which both NEX and NDGD were modified simultaneously, with the only constraint being maintaining the same clinically acceptable scan duration. To evaluate image quality, we proposed a prac-tical clinical approach with a standardized bench test for qual-itative and quantqual-itative evaluations derived from ROIs and tractography.
MATERIALS AND METHODS
Patient Population
Fifteen healthy volunteers (6 women, 9 men; age range, 22–30 years) were prospectively included at Bordeaux University Hos-pital after written informed consent was obtained. This study was approved by the local ethics committee review board.
Imaging Methods
All scans were obtained on a 3T MR imaging scanner (Discovery MR750W; GE Healthcare, Milwaukee, Wisconsin) equipped with high-performance gradients (maximum slew rate of 200 mT/ m/ms and maximum strength of 44 mT/m) and a dedicated pos-terior coil with 40 elements and a 19-channel phased array head-neck spine coil.
Subjects were asked to breathe normally and not to swallow or cough during the acquisition. They were positioned with a slight flexion of the head and with well immobilized to reduce involun-tary movements.
All sequences were performed in the axial plane with an an-teroposterior phase-encoding direction and used similar geome-try to perform fair comparisons. Pulse triggering was not used, to limit the scan time.
Conventional Imaging. The protocol included an anatomic sag-ittal T2-weighted spin-echo and a 3D Multi-Echo Recombined Gradient Echo sequence (MERGE; GE Healthcare) acquired in the same axial plane as the DTI sequences (ie, perpendicular to the long axis of the upper cervical spine). 3D-MERGE provides good white and gray matter differentiation with good SNR and was considered the anatomic reference. One hundred eight sections with a resolution of 0.8⫻0.8⫻0.8 mm3covering a 140⫻140
mm2FOV were acquired in 8 minutes. Other sequence
parame-ters were the following: TR/TE, 10/5 ms; flip angle, 7°; turbo fac-tor, 36.
f-FOV DTI. Conventional CSC DTI corresponded to the DTI usually performed at our institutions,14which was optimized
be-forehand according to the literature.15,16Parallel imaging was
used (array spatial sensitivity encoding technique) with an accel-eration factor of 2. The single-shot EPI parameters were the fol-lowing: NDGD, 20 directions;b⫽0 s/mm2and b⫽750 s/mm2;
matrix, 96⫻ 96; FOV, 120⫻ 120 mm2; in-plane resolution,
1.25⫻1.25 mm2; section thickness, 5 mm; TR/TE, 5600/75 ms;
and NEX, 3. This sequence covered the CSC from C1 to C7 within 6 minutes 50 seconds.
r-FOV DTI. For each subject, r-FOV DTI was acquired by using 5 schemes with different combinations of NDGD and NEX for each direction, starting from a sequence with many directions (NDGD⫽20) and few excitations (NEX⫽3) up to an opposite scenario obtained with the minimum number of directions to calculate a diffusion tensor (NDGD⫽6) and a maximum num-ber of excitations (NEX⫽12). Each scheme lasted about 4 min-utes 30 seconds, to cover the upper cervical spine from C1 to C4. The 5 schemes of the single-shot EPI sequence were as follows in terms of NEX/NDGD: 3N/20D, 5N/16D, 7N/12D, 9N/9D, 12N/ 6D. The directions were noncollinear and generated according to the recommendations of Jones et al17for the optimization of
gra-dient vector orientations (TR/TE, 3600/75 ms). The other param-eters were fixed and corresponded to those applied for the f-FOV sequence to compare r-FOV and f-FOV, notably regarding voxel size (r-FOV was 96⫻48 with a matrix of 120⫻60 mm2; in-plane
resolution was 1.25⫻1.25 mm2, with a 5-mm section thickness).
Postprocessing. Because our goal was to identify the best set of parameters for a DTI sequence used for clinical applications, we postprocessed the images with the tools that are accessible on clinical systems. Therefore, the DTI dataset processing and the qualitative and ROI-based analyses were performed on an AW server Workstation 5 (GE Healthcare). Tractography-based analyses were performed with Olea Sphere software (Olea Medi-cal, La Ciotat, France).
All the raw images were corrected for motion artifacts and eddy current distortion with the algorithm implemented on the DTI analysis software (GE Healthcare).
Radiologic Assessment
Qualitative Analysis. Two radiologists (A.C. and N.A., with, re-spectively, 4 and 7 years of experience in MR imaging) randomly evaluated the quality of each of the 6 DTI sequences (f-FOV, r-FOV 3N/20D, r-r-FOV 5N/16D, r-r-FOV 7N/12D, r-r-FOV 9N/9D, r-FOV 12N/6D) blinded to the nature of the sequence. They de-termined a score based on a 4-point scale, adapted from Zaha-rchuk et al12as follows: 1⫽nondiagnostic, 2⫽poor, 3⫽
mod-erate, 4 ⫽ good. This score was based on anatomic details, artifacts, distortion, and perceived SNR from fractional anisot-ropy (FA) maps alone and fused with 3D-MERGE. In case of disagreement between the 2 radiologists, consensus was obtained
after discussion with a third experienced neuroradiologist (T.T., with 14 years of experience).
Number of Sections with Artifacts. The number and the types of artifacts or nondiagnostic sections for each DTI sequence (flow artifacts, motion artifacts, susceptibility artifacts, major distor-tion) were reported and expressed as the percentage of sections with artifacts of the total number of sections.
Quantitative Comparisons of FA Values Based on ROI Analysis. For this part of the study, 1 neuroradiologist (A.C.), still blinded to the sequence, manually delineated ROIs on 4 sections passing through the middle of the vertebral bodies C1, C2, C3, and C4. ROIs were positioned twice with good reproducibility (intraclass correlation coefficient, 0.788; 95% CI, 0.353– 0.943).
Measurements were obtained on the following areas: 1) gray matter: left and right anterior horn of the cord (GM); 2) white matter: left and right corticospinal tract (WM); and 3) a full section of the cervical spinal cord (Fig 1). ROIs were ini-tially placed on the axial 3D-MERGE image and then propa-gated on coregistered FA maps. If needed, ROIs were slightly manually adjusted to account for FA map distortion. Because of partial volume effects at the interface between the CSF and spinal cord with about 2 pixels showing intermediate FA val-ues, measurements on the full section of the spinal cord were
[image:3.594.67.515.44.340.2]conducted on a smaller ROI eroded by 2 pixels. The FA values of each ROI were extracted, with right and left measurements being averaged (Fig 1B).
1) Quantifications of residual distortion: The residual distor-tion after eddy current correcdistor-tion was quantified by a ratio that we called the “distortion ratio” calculated as follows:
Distortion Ratio⫽
⎪(S(Full Section⫺Merge)⫺S(Full Section⫺FA)⎪
S(Full Section⫺Merge) ⫻100 ,
whereSis the surface of the full section of the cervical spinal cord. The distortion ratio was calculated at the 4 cervical levels and then averaged to obtain 1 single distortion ratio value per patient for each sequence. It ranges from zero when there is no distortion in the FA map compared with the reference anatomic MERGE se-quence, and it increases when distortions are more pronounced. 2) Signal-to-noise ratio: Because multichannel coil and paral-lel imaging were used to collect DTI data, SNR cannot be exactly assessed.18 In addition, background noise was not always
in-cluded within the r-FOV DTI acquisition. Therefore, we esti-mated spinal cord SNR at B0 andb⫽750 s/mm2as the ratio
be-tween the signal of the full section of the cord and the SD measured within the same neck muscle (longissimus capitis). SNRB0and SNRb750were assessed at the 4 cervical levels and then
averaged to obtain single SNRB0and SNRb750values per patient
and per DTI sequence.
3) Variability of FA measurements: Because a current issue with CSC DTI is its lack of precision and its variability, even among healthy subjects, we aimed at estimating variations among healthy volunteers. For this purpose, we measured FA on the full section and WM and GM at the 4 levels, and we calculated the mean and SD of these 4 values.
4) Quantitative comparisons based on tractography analysis:
Raw data were postprocessed with Olea Sphere software. Motion correction was performed. We drew 2 seed ROIs that included the entire section of the spine at the C1 and C3 levels. We measured the number of fibers detected between these 2 ROIs, per patient and per DTI sequence. The following parameters were used for stopping the tractography: FA minimum ⫽ 0.25, maximum an-gle⫽41.4°, fiber minimum length⫽20 mm.
Statistical Analyses
All statistical analyses were performed with GraphPad Prism Software, Version 6 (GraphPad Software, San Diego, Cali-fornia). Gaussian distributions were tested with a Shapiro-Wilk normality test. To compare the qualitative scores, distortion ratio, SNRB0, SNRb750, mean
FA values per topography, and number of detected fibers by tractography, we used 1-way ANOVA (with a post hoct test) or the Kruskal-Wallis test (with a post hoc Dunn test), de-pending on the distribution of the variables. For artifact compar-isons, contingency tables were built, and we compared sequences with the Fisher exact test to account for the small size of the sam-ple. We performed a Bartlett test to assess whether the FA values of each DTI set had equal variance, after verification of the Gaussian distribution.P⬍.05 was significant.
RESULTS
No incidental pathologic finding was observed in these young subjects, notably, no degenerative disc disease.
Qualitative Analysis
Figure 2shows the superimposition of the FA map with the ana-tomic reference 3D-T2-MERGE at the 4 levels of interest (C1–C4) and a sagittal reconstruction for the f-FOV and the 5 r-FOV schemes, with the same FA color scale.
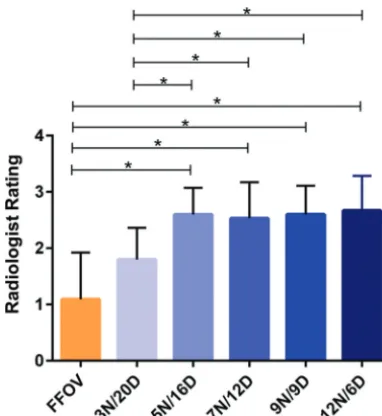
On qualitative radiologic assessment, the 5 r-FOV DTI se-quences with a NEX ofⱖ5 were not scored differently from each other but were significantly better evaluated than the f-FOV im-ages (3N/20D) (1.1⫾0.8) or the r-FOV images (3N/20D) (1.8⫾ 0.56). There was no qualitative difference between the f-FOV se-quence and the r-FOV 3N/20D sese-quence (Fig 3).
Specifically, the 2 radiologists consistently observed fewer dis-tortions, less misregistration in the anteroposterior direction, and less blurring for the r-FOV sequences with a NEX of⬎5 than for the 2 other sequences. The r-FOV images obtained with 5N/16D, 7N/12D, 9N/9D, and 12N/6D provided CSC morphology closer to the anatomic reference as opposed to the f-FOV or the r-FOV 3N/20D images (Figs 2and3).
Number of Sections with Artifacts
The dataset with the highest number of sections with artifacts was r-FOV 3N/20D (31.6%) followed by f-FOV (22.7%), while the
[image:4.594.58.373.44.272.2]r-FOV sequences with a NEX ofⱖ5 were significantly better; the r-FOV 9N/9D was the one with fewest artifacts (13.3%) (Fig 4).
Artifacts were mainly due to CSF flow on B0 images and resid-ual distortions after eddy current correction (the latter being par-ticularly seen on f-FOV and r-FOV 3N/20D), notably at the lower level of the acquisition volume (C4).
Quantitative Comparisons Based on ROI Analysis
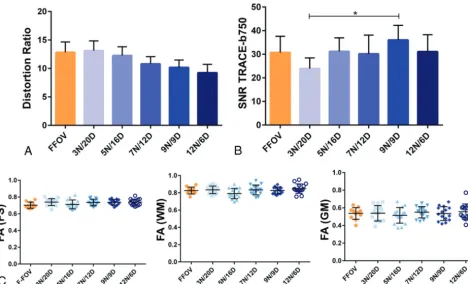
The distortion ratio decreased continuously while increasing the NEX (and, in turn, decreasing the NDGD), even though this effect did not reach statistical significance (Fig 5A). Thus, the distortion ratios for r-FOV 3N/20D and r-FOV 12N/6D were 13.14⫾6.6% and 9.25⫾5.5%, respectively.
SNR on the B0 map did not show significant differences
be-tween the sequences (P⬎.05). Atb⫽750 s/mm2, no significant
difference was observed among the DTI sets, except for the com-parison between r-FOV 3N/20D and r-FOV 9N/9D, which had, respectively, the lowest and the highest SNR (23.95⫾4 versus 36.04⫾5.8,P⫽.0182) (Fig 5B). Considering that a critical threshold of SNR below 8 should lead to section rejection, 10% of the sections had to be rejected because of a signal below this threshold on f-FOV; 6.7%, on r-FOV 3N/20D; and 5%, on r-FOV 7N/12D and r-FOV 12N/6D. The SNR was always above 8 for r-FOV sections acquired with 5N/16D and with 9N/9D.
Whatever the location (full section, GM, and WM) and se-quences, comparisons of the distributions of FA values did not reveal a significant difference (Fig 5C). Furthermore, there was no significant difference between the FA values, depending on the acquisition pulse sequence. For instance, FA values of the full section were the following: 0.70⫾0.04 for f-FOV, 0.74⫾0.04 for r-FOV 3N/20D, 0.71⫾0.05 for r-FOV 5N/16D, 0.7⫾0.04 for r-FOV 7N/12D, 0.074⫾0.03 for r-FOV 9N/9D, and 0.74⫾0.04 for r-FOV 12N/6D. The FA values that we obtained were consis-tent with those in the literature,19-22with lower and more
dis-persed measures within the GM and higher and less disdis-persed measures within the WM.
[image:5.594.72.263.45.253.2]Quantitative Comparisons Based on Tractography Analysis
Figure 6Arepresents tractograms derived from the 2 seeds super-imposed on the corresponding trace atb⫽750 s/mm2. R-FOV
7N/12D, 9N/9D, and 12N/6D qualitatively exhibited a more real-istic anatomy of the cord than f-FOV, r-FOV 3N/20D, and r-FOV 5N/16D, with more fibers and longer tracts.
Quantitatively, r-FOV 9N/9D detected the highest number of tracts without abnormal tract findings on tractograms (4587⫾ 1743), closely followed by r-FOV 12N/6D (4290⫾1206), with findings not significantly different from the previous ones. The best sequence (r-FOV 9N/9D) detected significantly more fibers than f-FOV (P⬍.0001), r-FOV 5N/16D (P⫽.0004), and r-FOV 3N/20D (P⬍.05) (Fig 6B).
DISCUSSION
Our study did not show any significant difference between CSC DTI obtained with f-FOV or r-FOV when using a protocol favor-ing NDGD over NEX. However, we showed real benefits of the r-FOV by balancing the NDGD and the NEX, the best trade-off being 9N/9D, in terms of qualitative aspects, reduction of arti-facts, SNR, and detection of fibers, while maintaining identical FA values.
This study demonstrates that optimized parameters for CSC DTI in clinical conditions are different from those for brain DTI, which requires a high number of directions, ideally at least 31 while the NEX can be reduced.23Here, we demonstrated that CSC
DTI does not require such a high number of gradient directions. In theory, high NDGD leads to more precise DTI information. In the CSC, FA values and their variations were similar with 6, 9, 12, 16, or 20 NDGD in a set of healthy subjects; this finding might be explained by the strong orientation of the cord in the rostrocaudal axis. However, we recommend increasing the number of averages
FIG 3. Qualitative analysis. Radiologists determined a rate for each sequence, for each subject, from 1 (nondiagnostic) to 4 (good). Mean rates⫾SDs for the sequence are represented. Superimposedblack linesindicate which sequences are statistically different withP⬍.05 (asterisk).
[image:5.594.71.265.320.504.2]because the CSC has low intrinsic signal and is prone to artifacts that can be averaged and canceled (such as flow artifacts) with several excitations. Altogether, we recommend choosing NEX over NDGD when time is limited as opposed to standard recom-mendation for brain exploration. These results might be particu-larly important when axial sections are used because the axial section is prone to flow artifacts. Other strategies could be ad-opted and associated in the future to further limit the flow arti-facts: 1) Many B0s could be acquired to select the one with the fewest artifacts; 2) cardiac gating could be added but at the cost of increasing scan time; 3) 2 B0 acquisitions could be averaged, in phase and in reversed phase; and 4) the tensor could be estimated from theb⫽50 s/mm2andb⫽750 s/mm2acquisition without
requiring B0.
In line with this conclusion, previous studies dealing with the optimization of DTI parameters for CSC have also demonstrated, in a similar sequential approach, that there was no need to dras-tically increase NDGD (15 was satisfying compared with 32), while the NEX had to be increased.13However, these results were
obtained with a f-FOV sequence, and their relevance might be still more important with a r-FOV strategy.
Other kinds of r-FOV sequences exist, depending on the MR imaging system, but all of them rely on the same principle. Reduc-ing the excited region in the phase-encodReduc-ing direction enables a shorter echo train, increased blip moment, and, thus, reduced susceptibility effects.24Spatial definition can be improved. SNR
and scan time are supposed to remain stable. Among the r-FOV methods, the most popular are the following: 1) ZOnal Oblique Multislice-EPI,11an inner volume technique, in which a
refocus-ing pulse in an orthogonal or oblique plane to the excitation plane is applied, but with the creation of section gaps; 2) inner volume excitation and outer volume suppression10; and 3) the r-FOV.6As
a consequence of the increased image quality, applications of r-FOV sequences are increasingly used not only for the CSC but also to explore the midbrain, optic nerves, or hippocampi for neuro-radiology, and also the pancreas and prostate.25,26
Currently, there is no validated method for CSC DTI qual-ity control. The CSC and its environment are too complex for mathematic15or phantom simulations. The method that we
proposed here can be viewed as a realistic bench test that can be performed by any radiologist and that covers all aspects of quality control.
Finally, as additional techniques are being developed, we can expect further improvement: 1) The combination of parallel im-aging and r-FOV, which has already been performed for the pons at 7T27, can still increase DTI quality; 1) multisegmented 3D-EPI
could increase the SNR and could be associated with r-FOV and parallel imaging to reduce the echo train28; 3) a more accurate
diffusion model could be used such as neurite orientation disper-sion and density imaging,29which might provide more accurate
quantitative diffusion metrics, especially for anisotropic struc-tures like gray matter; and 4) improved postprocessing methods are being developed,30with improved eddy current and motion
corrections.
Our study has limitations. We did not investigate other impor-tant parameters such as b-value, section thickness, bandwidth, cardiac gating, respiratory gating, and different designs of diffu-sion vectors. However, these parameters were set regardless of the
[image:6.594.59.527.46.329.2]sequence. The values we used ranged among those classically rec-ommended,31 notably by MR imaging constructors.
Further-more, all our acquisitions were performed on the same 3T MR imaging system. Further studies are required to investigate whether our results could be translated to 1.5T. The current liter-ature suggests that 1.5T and 3T should provide similar DTI re-sults, though a direct comparison has not been conducted for CSC DTI, to our knowledge. Phantom studies with classic diffusion have shown that the increased SNR inherent at higher magnetic fields was counterbalanced by increased distortions or suscepti-bility artifacts.32For brain DTI, Grech-Sollars et al33recently
con-cluded that no significant difference was observed in the inter-scanner coefficient of variation for mean diffusivity and FA when 1.5T and 3T systems were compared with similar brain DTI pro-tocols. Therefore, the parameter adjustments that we suggest at 3T might translate to 1.5T, but a formal comparison will be needed to validate this statement. In addition, our patient popu-lation consisted of only healthy young adults without significant medical histories, which might have led to better quality than what can be encountered in clinical routine. Degenerative, in-flammatory, traumatic, metabolic, or tumoral spinal diseases can modify diffusivity parameters.1-5Consequently, even though our
study design compared the DTI sequences, the values of our judg-ment criteria cannot be translated directly into clinical practice.
Another limitation is that we studied only 15 healthy subjects, which might not provide the statistical power to detect subtle differences. Nonetheless, this sample already reveals a better set of parameters, namely r-FOV 9N/9D.
CONCLUSIONS
R-FOV CSC DTI is clinically feasible and provides significant qualitative and quantitative improvement when optimized. Con-trary to brain imaging, we recommend limiting NDGD and in-creasing NEX because the CSC is a small highly oriented structure generating low signal and is subject to artifacts. The best compro-mise in a clinically acceptable scan time of 4 minutes 30 seconds is r-FOV with a NEX of 9 and 9 NDGD.
ACKNOWLEDGMENTS
We thank Gerard Raffard for his help with image analyses in this study.
Disclosures: Thomas Tourdias—UNRELATED: Grants/Grants Pending: ANR-10-LABX-57 named TRAIL and ANR-10-LABX-43 named BRAIN.* Marion Uettwiller—I am a General Electric Healthcare employee working as an application specialist. The system used for this study was a General Electric system. I assisted in establishing the acquisition protocol and provided technical information included in the article. *Money paid to the institution.
REFERENCES
1. Shanmuganathan K, Gullapalli R, Zhuo J, et al.Diffusion tensor MR imaging in cervical spine trauma.AJNR Am J Neuroradiol2008;29: 655–59CrossRef Medline
2. Facon D, Ozanne A, Fillard P, et al.MR diffusion tensor imaging and fiber tracking in spinal cord compression.AJNR Am J Neuroradiol
2005;26:1587–94Medline
3. Renoux J, Facon D, Fillard P, et al.MR diffusion tensor imaging and fiber tracking in inflammatory diseases of the spinal cord.AJNR Am J Neuroradiol2006;27:1947–51Medline
4. van Hecke W, Nagels G, Emonds G, et al.A diffusion tensor imaging group study of the spinal cord in multiple sclerosis patients with and without T2 spinal cord lesions.J Magn Reson Imaging2009;30: 25–34CrossRef Medline
5. Budzik JF, Balbi V, Le Thuc V, et al.Diffusion tensor imaging and fibre tracking in cervical spondylotic myelopathy.Eur Radiol2011; 21:426 –33CrossRef Medline
6. Saritas EU, Cunningham CH, Lee JH, et al.DWI of the spinal cord with reduced FOV single-shot EPI.Magn Reson Med 2008;60: 468 –73CrossRef Medline
7. Kim TH, Zollinger L, Shi XF, et al.Quantification of diffusivities of the human cervical spinal cord using a 2D single-shot interleaved multisection inner volume diffusion-weighted echo-planar imag-ing technique.AJNR Am J Neuroradiol2010;31:682– 87CrossRef Medline
8. Finsterbusch J.High-resolution diffusion tensor imaging with in-ner field-of-view EPI. J Magn Reson Imaging 2009;29:987–93 CrossRef Medline
9. Jeong EK, Kim SE, Guo J, et al.High-resolution DTI with 2D inter-leaved multislice reduced FOV single-shot diffusion-weighted EPI (2D ss-rFOV-DWEPI).Magn Reson Med2005;54:1575–79CrossRef Medline
10. Wilm BJ, Svensson J, Henning A, et al.Reduced field-of-view MRI using outer volume suppression for spinal cord diffusion imaging.
Magn Reson Med2007;57:625–30CrossRef Medline
11. Wheeler-Kingshott CA, Hickman SJ, Parker GJ, et al.Investigating cervical spinal cord structure using axial diffusion tensor imaging.
Neuroimage2002;16:93–102CrossRef Medline
12. Zaharchuk G, Saritas EU, Andre JB, et al.Reduced field-of-view dif-fusion imaging of the human spinal cord: comparison with
[image:7.594.52.283.57.353.2]tional single-shot echo-planar imaging.AJNR Am J Neuroradiol
2011;32:813–20CrossRef Medline
13. Lee JW, Kim JH, Kang HS, et al.Optimization of acquisition param-eters of diffusion-tensor magnetic resonance imaging in the spinal cord.Invest Radiol2006;41:553–59CrossRef Medline
14. Crombe A, Menegon P, Tourdias T, et al.Diffusion tensor imaging of cervical spinal cord at 3T: normal values of radial, axial, mean diffusivities and fractional anisotropy in anterior horn, dorsal fu-niculus and pyramidal tract at each cervical level.In:Proceedings of the International Society for Magnetic Resonance in Medicine and the European Society for Magnetic Resonance in Medicine Joint Annual Meeting,Milan, Italy. May 10 –16, 2014
15. Gao W, Zhu H, Lin W.A unified optimization approach for dif-fusion tensor imaging technique. Neuroimage 2009;44:729 – 41 Medline
16. Mukherjee P, Chung SW, Berman JL, et al.Diffusion tensor MR imaging and fiber tractography: technical considerations.AJNR Am J Neuroradiol2008;29:843–52CrossRef Medline
17. Jones DK, Horsfield MA, Simmons A.Optimal strategies for mea-suring diffusion in anisotropic systems by magnetic resonance im-aging.Magn Reson Med1999;42:515–25Medline
18. Dietrich O, Raya JG, Reeder SB, et al.Measurement of signal-to-noise ratios in MR images: influence of multichannel coils, parallel imaging, and reconstruction filters.J Magn Reson Imaging2007;26: 375– 85CrossRef Medline
19. Brander A, Koskinen E, Luoto TM, et al.Diffusion tensor imaging of the cervical spinal cord in healthy adult population: normative val-ues and measurement reproducibility at 3T MRI.Acta Radiol2014; 55:478 – 85CrossRef Medline
20. Xu J, Shimony JS, Klawiter EC, et al.Improved in vivo diffusion tensor imaging of human cervical spinal cord.Neuroimage2013;67: 64 –76CrossRef Medline
21. Tang L, Wen Y, Zhou Z, et al.Reduced field-of-view DTI segmenta-tion of cervical spine tissue.Magn Reson Imaging2013;31:1507–14 CrossRef Medline
22. Ellingson B, Ulmer JL, Kurpad SN, et al.Diffusion tensor MR
imag-ing of the neurologically intact human spinal cord.AJNR Am J Neu-roradiol2008;29:1279 – 84CrossRef Medline
23. Ni H, Kavcic V, Zhu T, et al.Effects of number of diffusion gradient directions on derived diffusion tensor imaging indices in human brain.AJNR Am J Neuroradiol2006;27:1776 – 81Medline
24. Viallon M, Cuvinciuc V, Delattre B, et al.State-of-the-art MRI tech-niques in neuroradiology: principles, pitfalls, and clinical applica-tions.Neuroradiology2015;57:441– 67CrossRef Medline
25. Ma C, Li YJ, Pan CS, et al.High resolution diffusion weighted mag-netic resonance imaging of the pancreas using reduced field of view single-shot echo-planar imaging at 3 T.Magn Reson Imaging2014; 32:125–31CrossRef Medline
26. Korn N, Kurhanewicz J, Banerjee S, et al.Reduced-FOV excitation decreases susceptibility artifact in diffusion-weighted MRI with en-dorectal coil for prostate cancer detection.Magn Reson Imaging
2015;33:56 – 62CrossRef Medline
27. Wargo CJ, Gore JC.Localized high-resolution DTI of the human midbrain using single-shot EPI, parallel imaging, and outer-vol-ume suppression at 7T. Magn Reson Imaging 2013;31:810 –19 CrossRef Medline
28. Engstro¨m M, Skare S.Diffusion-weighted 3D multislab echo planar imaging for high signal-to-noise ratio efficiency and isotropic im-age resolution.Magn Reson Med2013;70:1507–14CrossRef Medline 29. Grussu F, Schneider T, Zhang H, et al.Neurite orientation disper-sion and density imaging of the healthy cervical spinal cord in vivo.
Neuroimage2015;111:590 – 601CrossRef Medline
30. Mohammadi S, Freund P, Feiweier T, et al.The impact of post-pro-cessing on spinal cord diffusion tensor imaging.Neuroimage2013; 70:377– 85CrossRef Medline
31. Jones D.Diffusion MRI: Theory, Methods, and Applications.New York: Oxford University Press; 2011
32. Lavdas I, Miquel ME, McRobbie DW, et al.Comparison between diffusion-weighted MRI (DW-MRI) at 1.5 and 3 Tesla: a phantom study.J Magn Reson Imaging2014;40:682–90CrossRef Medline 33. Grech-Sollars M, Hales PW, Miyazaki K, et al.Multi-centre