University of Warwick institutional repository: http://go.warwick.ac.uk/wrap
This paper is made available online in accordance with
publisher policies. Please scroll down to view the document
itself. Please refer to the repository record for this item and our
policy information available from the repository home page for
further information.
To see the final version of this paper please visit the publisher’s website.
Access to the published version may require a subscription.
Author(s): A. Nebot Gómez-Morán, A. D. Schwope,M. R. Schreiber, B.
T. Gänsicke, S. Pyrzas, R. Schwarz,J. Southworth, J. Kohnert, J.
Vogel, M. Krumpe, and P. Rodríguez-Gil
Article Title: Post common envelope binaries from SDSS - IV. SDSS
J121258.25–012310.1, a new eclipsing system
Year of publication: 2009
Link to published article:
http://dx.doi.org/10.1051/0004-6361:200811244
DOI:10.1051/0004-6361:200811244 c
ESO 2009
Astrophysics
&
Post common envelope binaries from SDSS
IV. SDSS J121258.25–012310.1, a new eclipsing system
A. Nebot Gómez-Morán
1, A. D. Schwope
1, M. R. Schreiber
2, B. T. Gänsicke
3, S. Pyrzas
3, R. Schwarz
1,
J. Southworth
3, J. Kohnert
1, J. Vogel
1, M. Krumpe
1, and P. Rodríguez-Gil
41 Astrophysikalisches Institut Potsdam, An der Sternwarte 16, 14482 Potsdam, Germany e-mail:[email protected]
2 Departamento de Fisica y Astronomia, Universidad de Valparaiso, Avenida Gran Bretana 1111, Valparaiso, Chile 3 Department of Physics, University of Warwick, Coventry CV4 7AL, UK
4 Instituto de Astrofísica de Canarias, Vía Láctea, s/n, La Laguna, 38205, Tenerife, Spain
Received 28 October 2008/Accepted 2 January 2009
ABSTRACT
From optical photometry we show that SDSS J121258.25–012310.1 is a new eclipsing, post common-envelope binary with an orbital period of 8.06 h and an eclipse length of 23 min. We observed the object over 11 nights in different bands and determined the ephemeris of the eclipse to HJDmid=2 454 104.7086(2)+0.3358706(5)×E, where numbers in parenthesis indicate the uncertainties in the last digit. The depth of the eclipse is 2.85±0.17 mag in theVband, 1.82±0.08 mag in theRband and 0.52±0.02 mag in the
Iband. From spectroscopic observations we measured the semi-amplitude of the radial velocityK2=181±3 km s−1for the secondary star. The stellar and binary parameters of the system were constrained from a) fitting the SDSS composite spectrum of the binary, b) using aK-band luminosty-mass relation for the secondary star, and c) from detailed analyses of the eclipse light curve. The white dwarf has an effective temperature of 17 700±300 K, and its surface gravity is logg=7.53±0.2. We estimate that the spectral type of the red dwarf is M4±1 and the distance to the system is 230±20 parsec. The mass of the secondary star is estimated to be in the range
Msec=0.26−0.29M, while the mass of the white dwarf is most likelyMwd=0.46−0.48M. From an empirical mass-radius relation we estimate the radius of the red dwarf to be in the range 0.28−0.31R, whereas we getRwd=0.016−0.018R from a theoretical mass-radius realation. Finally we discuss the spectral energy distribution and the likely evolutionary state of SDSS1212–0123.
Key words.binaries: close – binaries: eclipsing – novae, cataclysmic variables
1. Introduction
Most stars are found in binary or multiple star systems and a large fraction of binaries will interact at some point in their lives. Interaction depends on initial separation, relative masses of the components, and their evolutionary state. When the initial or-bital period is less than ∼5 days, interaction will take place, while both stars are on the main sequence, giving rise to con-tact binaries and eventualy mergers. For wider orbits, interaction can happen only when the more massive star reaches the RGB or the AGB. If the mass transfer rate is high enough a gaseous envelope may surround the binary, entering thus a common en-velope (CE) phase. The stars spiral towards each other, friction within the CE will lead to a shrinkage of the binary separation, and angular momentum and energy are extracted from the or-bit, expelling the CE. Once the envelope is expelled, the remain-ing system consists of a main sequence star and a remnant of the more massive star, e.g. a white dwarf, perhaps surrounded by the ejected material that can be ionized forming a planetary nebula (Paczy´nski 1976;Iben & Livio 1993). Further evolution of the system is driven by angular momentum loss due to mag-netic braking and/or gravitational radiation, which will bring the system into a semidetached configuration, becoming a cataclis-mic variable (CV). Post common envelope binaries (PCEBs) are
This paper includes data gathered with the 6.5 m Magellan
Telescopes located at Las Campanas Observatory, Chile.
thought to be precursors of other interesting objects such as CVs, millisecond pulsars, low-mass X-ray binaries, or double degen-erate white dwarfs.
Though theories for the CE phase exist it is still poorly un-derstood. The efficiency of mass ejection in the CE with respect to the masses of the components, their evolutionary state and the orbital separation is uncertain (Politano & Weiler 2007;Taam & Ricker 2006). White dwarf plus main sequence (WDMS) binaries are a perfect test laboratory for studying the current population synthesis models, because they are numerous, their stellar components are well understood in terms of their sin-gle evolution and they are not accreting, which would increase the complexity. The number of PCEBs with well-defined pa-rameters is still small, although it has increased sinceSchreiber & Gänsicke (2003), from 30 to almost 50 systems (Gänsicke et al. 2004;Morales-Rueda et al. 2005;Shimansky et al. 2006;
van den Besselaar et al. 2007;Aungwerojwit et al. 2007;Tappert et al. 2007;Schreiber et al. 2008;Rebassa-Mansergas et al. 2008;
Steinfadt et al. 2008).
In this paper we report the discovery of a new eclipsing PCEB. In our ongoing search for PCEBs among white-dwarf/main-sequence binaries (Schreiber et al. 2008;
Rebassa-Mansergas et al. 2007, 2008), SDSS J121258.25– 012310.1 (Adelman-McCarthy et al. 2008) (henceforth SDSS1212–0123) was included in our target list for photometric monitoring of candidate objects. The serendipituous discovery of a binary eclipse from time-resolved differential photometry
562 A. Nebot Gómez-Morán et al.: Post common envelope binaries from SDSS. IV.
Table 1.Log of photometric observations for SDSS1212–0123.
Date Tel Filter tint Nobs φini φfin 04 Jan. 2007 IAC80 I 180 74 0.805 1.278 26 Jan. 2007 AIP70 V 180 19 0.041 0.156 13 Feb. 2007 IAC80 V 70 191 0.607 1.202 14 Feb. 2007 IAC80 V 70 221 0.525 1.292 12 Mar. 2007 AIP70 I 120 181 0.031 0.946 13 Mar. 2007 AIP70 I 120 153 0.377 1.343 14 Mar. 2007 AIP70 I 120 49 0.786 1.040 15 Mar. 2007 AIP70 R 120 73 0.683 1.023 26 Mar. 2007 AIP70 I 120 45 0.994 1.179 21 May 2007 AIP70 I 90 59 0.907 1.097 06 May 2008 IAC80 R 120 32 0.913 1.049
triggered a photometric and spectroscopic follow-up. Only seven eclipsing binaries containing a white dwarf and a low-mass main sequence star were known until 2007. Since then another three eclipsing systems have been published (Steinfadt et al. 2008; Drake et al. 2008), and a further three systems have been discovered by us (Pyrzas et al. 2008). Eclipsing binaries are of great interest since they offer the possibility of deriving fundamental properties of stars with a high accuracy. SDSS1212–0123 was firstly listed as a quasar candidate by
Richards et al. (2004) and later classified as a DA+dMe by
Silvestri et al.(2006). It contains a relatively hot white dwarf (from now on primary) and an active mid-type dM star (from now on secondary).
In this paper we summarize our current knowledge about this source from own observations and archival work. It is organized as follows. In Sect.2 we describe the observations and reduc-tions. In Sect.3we present the results, we study the evolution of the system in Sect.4and conclude in Sect.5.
2. Observations and reductions
2.1. IAC80 and AIP70 photometry
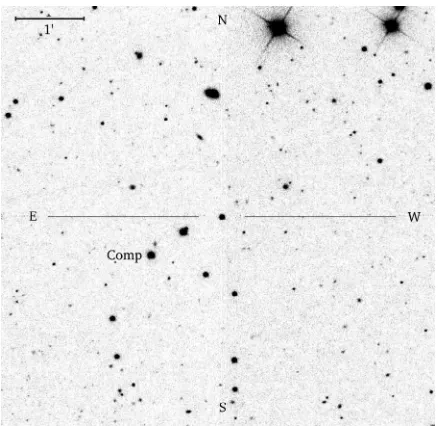
Optical photometric observations were obtained using two dif-ferent telescopes over 11 nights. The 80 cm telescope IAC80 in Observatorio del Teide, Spain, was equipped with the stan-dard CCD camera and the 70 cm telescope of the Astrophysical Institute Potsdam at Babelsberg was used with a cryogenically cooled 1×1 k TEK-CCD. A log of observations is presented in Table1. A field of∼3 arcmin was read with the IAC80 CCD camera, and we used a binning factor of 2 in both spatial direc-tions (scale of 0.6), while we used a binning factor of 3 for the 70 cm telescope (scale of 1.41), in order to decrease the readout time and improve the signal to noise. Reduction was performed using standard packages in IRAF1 and MIDAS. Differential magnitudes were obtained with respect to the comparison star SDSS J121302.39–012343.5 (see Fig.1), with magnitudes
ugriz = 17.40,16.00,15.51,15.36,15.30. SDSS magnitudes were transformed into Johnson’s using equations taken from the Sloan pages2. Neglecting the color term, we calculated absolute magnitudes of SDSS1212–0123. The estimated error of the ab-solute calibration is 0.05 mag.
1 IRAF is distributed by the National Optical Astronomy Observatory, which is operated by the Association of Universities for Research in Astronomy, Inc., under contract with the National Science Foundation,
http://iraf.noao.edu
2 http://www.sdss.org/dr7/algorithms/
[image:3.595.51.299.97.221.2]sdssUBVRITransform.html
Fig. 1. SDSS image of SDSS1212–0123 (in the cross-hair) and the
comparison star (RA=12:13:02.39, Dec=−01:23:43.5).
2.2. Spectroscopy
Spectroscopic follow up observations were obtained during the period 16−19 May 2007 with the LDSS3 imaging spectropho-tograph at the Magellan Clay telescope. Ten spectra were taken for SDSS1212–0123. Exposure times varied from 300 to 600 s. Seeing and transparency were highly variable. The VPH_Red grism and an OG590 blocking filter were used. The detector was a STA 4 k×4 k pixel CCD with two read out amplifiers. We used a slit width of 0.75 arcsec, that together with the spectral resolu-tionR=1810, gave a coverage of 5800−9980 Å at a reciprocal
dispersion of 1.2 Å pix−1. Four of the spectra taken at quadrature
were obtained through a narrow slit of 0.5 arcsec resulting in a
FWHMspectral resolution of 4.8 Å, with the purpose of measur-ing the radial velocity amplitude with a higher accuracy. Flat-field images were taken at the position of the target to allow ef-fective fringe removal in the red part of the spectra. The spectral images were reduced using STARLINK packages FIGARO and KAPPA, and the spectra were optimally extracted (Horne 1986) using the PAMELA package (Marsh 1989). Wavelength calibra-tion was done using sky lines. Wavelengths of good sky lines were obtained from the atlas ofOsterbrock et al.(1996,1997). A fifth-order polynomial was fitted to 36 sky lines. Spectra were flux calibrated and corrected for telluric lines using spectra of the standard star LTT3218 taken during the same observing run.
3. Results
3.1. The light curve
The optical light curve of SDSS1212–0123 displays a total eclipse of the primary with length of approximately 23 min-utes. The depth of the eclipse is 0.52±0.02 mag in theIband, 1.82±0.08 mag in the R band and 2.85 ±0.17 mag in the
Vband (see Fig.2). Eclipse magnitudes aremI =16m.56±0m.02,
Fig. 2.Optical photometry from the IAC80 telescope in theV,Rand
Iband (from bottom to top) phase folded over the orbital period. Note the different scales for each panel.
At the given time resolution of our photometry, the WD ingress and egress phases are not resolved. Five eclipses were completely covered and the eclipse length was determined in these light curves measuring their full width at half maximum of the flux level. The weighted mean of those five measurements gives an eclipse length of 23±1 min.
3.2. Ephemeris
In addition to the five eclipses which were covered completely one further eclipse was covered partially. Using the measured eclipse length from the previous section we thus determined six eclipse epochs (Table2). The eclipses of March 12, 14 and 26, respectively, were not covered due to bad weather conditions. Using a phase-dispersion minimization technique a tentative pe-riod was determined,Porb=0.3359±0.0006 h, which was suffi
-ciently accurate to connect all follow-up observations without a cycle count alias.
We then used the six mid eclipse epochs to calculate a linear ephemeris by fitting a line to the cycle number and eclipse epoch:
HJDmid=2 454 104.7086(2)+0.3358706(5)×E, (1)
where numbers in parenthesis indicate the 1σuncertainty in the last digits. The observed minus calculated values are tabulated in Table2.
3.3. Stellar parameters
3.3.1. Decomposition of the SDSS spectrum
We determined the stellar parameters of SDSS1212–0123 from the SDSS spectrum following the procedure described in
Rebassa-Mansergas et al.(2007).
Table 2.Date, times of mid eclipses, cycle number obtained from the photometric observations and residuals from the linear ephemeris.
Date HJD (Mid-eclipse) Cycle O−C (s) 04 Jan. 2007c 2 454 104.7085(21) 0 –9.9
13 Feb. 2007c 2 454 145.6847(8) 122 –11.0
14 Feb. 2007p 2 454 146.6922(8) 125 –19.0
13 Mar. 2007c 2 454 173.5621(10) 205 –0.3
21 May 2007c 2 454 242.4163(21) 410 66.9
06 May 2008c 2 454 593.4000(14) 1455 –25.9 cEclipse completely covered.
pEclipse partially covered.
In a first step the best match of the SDSS composite spec-trum is determined with an optimization strategy on a grid of ob-served white dwarf and M-dwarf template spectra created from the SDSS DR6 database. The main result of this first step is the determination of the spectral type of the secondary. Using the spectral type-radius relation fromRebassa-Mansergas et al.
(2007) and the apparent magnitude of the scaled template re-sults in a first distance estimatedsec. After subtracting the
best-fitting M-star template, white-dwarf parameters are determined viaχ2 minimization in a logg−Teffgrid of model atmospheres
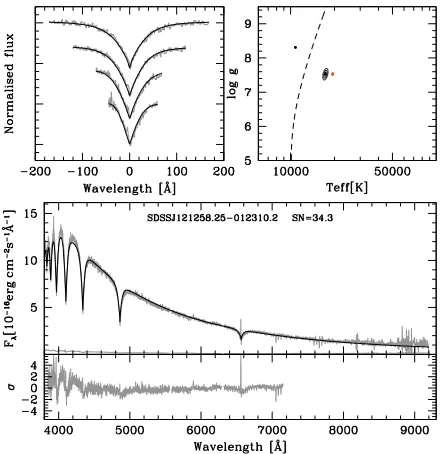
(Koester et al. 2005). Since this analysis step is performed on spectra normalized to a continuum intensity, the results are bi-valued yielding a “hot” and a “cold” solution (see Fig. 4). The degeneracy can typically be broken by an additional fit to the overall spectrum (continuum plus lines in the wavelength range 3850−7150 Å). In the present case of SDSS1212–0123 the GALEX detection (see below) provides an additional con-straint excluding the “cold” solution. The results of the spectral decomposition and the white dwarf fit for SDSS1212–0123 are shown in Fig.4.
Mass and radius of the white dwarf are calculated with the best-fitting logg−Teffcombination using updated versions of the
tables byBergeron et al.(1995). The flux scaling factor together with the derived radius of the white dwarf results in a second distance estimate of the binary,dwd.
The spectral type of the secondary was determined to be M4±1 implying a distance dsec = 320±95 pc, mass range
of the secondary Msec = 0.255−0.380 M and radius range
Rsec =0.258−0.391R, usingRebassa-Mansergas et al.(2007) spectral type-mass and spectral type-radius empirical relations respectively. The derived temperature and loggof the primary were found to be only weakly dependent on the chosen spec-tral type and specspec-tral template of the secondary, because we use Hβ−H for the white dwarf line fit, where the secondary star contribution is small. It is also weakly dependendt on the accuracy of the spectral flux calibration and also the small ra-dial velocity line displacements. The best fit was found for
Teff=17 700±300 K and logg=7.53±0.05 (implying a white dwarf massMwd=0.39±0.02M, andRwd=0.018±0.001R).
The obtained values are in agreement with those published by
Silvestri et al. (2006). However, one should be aware of the fact that all the quoted errors are purely statistical. The true uncertainty of the white dwarf spectral parameters is clearly higher than suggested by the derived numbers. We estimate the systematic uncertainty of our logg determination to be on the order of 0.2 dex, which results in rather wide ranges of pos-sible values for the mass and the radius of the primary, i.e.
Mwd=0.33−0.48M andRwd=0.015−0.021R.
The derived distance to the white dwarf isdwd=226±8 pc
[image:4.595.309.534.108.186.2]564 A. Nebot Gómez-Morán et al.: Post common envelope binaries from SDSS. IV.
Fig. 3.Two component fit to SDSS1212–0123. Thetop panelshows the WDMS spectrum (black line) and the white dwarf and the M4 M-dwarf templates (dotted lines), while thelower panelshows the residuals to the fit.
Fig. 4. Spectral model fit to the white dwarf component of
SDSS1212–0123, obtained after subtracting the best-fit M-dwarf tem-plate from its SDSS spectra.Top left panel: best fit (black lines) to the normalized Hβto Hline profiles (gray lines,top to bottom).Top right panel: 1, 2 and 3σ χ2contour plots in theT
eff−loggplane. The black
contours refer to the best line profile fit, the red contours to the fit of the whole spectrum. The dashed line indicates where the maxima of the Hβequivalent width occurs in theTeff −logg plane, dividing it into
two different solutions, a cold and a hot one. The best-fit parameters of the hot and the cold normalized line profile solutions and of the fit to the 3850−7150 Å range are indicated by the black and the red dots, respectively.Bottom panel: the white dwarf spectrum and associated flux errors (gray lines) along with the best-fit white dwarf model (black lines) to the 3850−7150 Å wavelength range (top) and the residuals of the fit (gray line,bottom).
differ,dsec being longer than dwd, but in agreement within the
erros.Rebassa-Mansergas et al.(2007) found a similar trend for 101 WDMS binaries in their study. They argue that such diff er-ence could be due to stellar activity of the secondary star, and that the spectral type determined from the optical SDSS spec-trum is too early for the mass of the secondary star, which would
lead to a larger radius and consequently a larger distance to the system. Since the secondary in SDSS1212–0123 was found to be active too, we regard the distance estimate for the white dwarf being more reliable. Taking into account systematic errors we obtaindwd=230±20 pc as the distance to the system.
3.3.2. Constraining the secondary mass using 2MASS
In the previous section we derived the mass and the ra-dius of the secondary star using empirical relations from
Rebassa-Mansergas et al. (2007) and obtained Msec =
0.255−0.380 M and Rsec = 0.258−0.391 R, respectively. However, as clearly shown in Fig. 7 ofRebassa-Mansergas et al.
(2007), the masses and radii derived from observations largely scatter around the empirical relations. In addition, according to
Rebassa-Mansergas et al.(2007) increased activity of the rapidly rotating secondary stars in close binaries can cause the stars to appear as earlier spectral types when compared to non-active stars of the same mass. To sum up, the secondary masses de-rived from empirical relations can obviously only considered to reasonable but rough estimates.
An alternative method to determine the mass of secondary star is to use luminosity-spectral type relations. To that end, we explored the Two Micron All Sky Survey Point Source Catalog (Cutri et al. 2003), finding magnitudesJ=14.90±0.03,
H =14.39±0.05 andKs =13.96±0.05 for SDSS1212–0123.
Subtracting the extrapolated contribution of the primary star (logg = 7.5 and dwd = 230 pc) yields infra-red colors of
J−H=0.51±0.06,H−Ks=0.43±0.07, respectively. Using the
empirical mass-luminosity relation fromDelfosse et al.(2000), we derive the mass of the secondary star to be 0.26±0.03. Using again the mass-radius relation fromRebassa-Mansergas et al.
(2007) this implies a spectral type M5, i.e. later by one stectral type than estimated from the deconvolution of the SDSS spec-trum. This supports the idea of activity significantly affecting the determination the secondary star spectral types and the cor-responding distances.
3.3.3. Radial velocity
In each of our observed spectra we measured the radial velocities of the NaI absorption doublet (8183.27 Å, 8194.81 Å), which originates from the secondary star. A double Gaussian with a fixed separation of 11.54 Å was fitted to the line profiles using the FIT/TABLE command provided by ESO/MIDAS.
Hα was deconvolved into an absorption and an emission line component using two Gaussians. While the emission line showed pronounced wavelength shifts, the centroids of the ab-sorption lines thus measured did not constrain the curve of the white dwarf significantly.
Assuming a circular orbit a sine-function was fitted to the measured radial velocity curves to obtain the radial velocity semi-amplitudeK2of the secondary star:
vr=γ2+K2sin
2π(t−t0)
P
. (2)
The orbital periodPand the epoch of mid eclipse t0 were
de-termined photometrically and were kept fixed for the radial ve-locity fit. For the NaI doublet we find the systemic veve-locity γ2 = 17±3 km s−1 andK2 = 181±3 km s−1, while we find
for the Hαlineγ2=21±2 km s−1andK2=161±3 km s−1. The
[image:5.595.65.288.301.528.2]-200 -100 0 100 200 0 0 0 0 0 0
RV [Km s
-1]
[image:6.595.320.515.74.378.2]0.0 0.5 1.0 1.5 2.0 Orbital phase -20 0 20 0 O-C
Fig. 5.Radial velocities measured from the NaI doublet 8183,8194 Å originating from the secondary star of SDSS1212–0123 folded over the orbital period obtained from the photometry. Sine fit and residuals (lower panel) are shown.
The semi-amplitudes of the two radial velocity curves are different and these differences seem to be significant. The semi-amplitude derived from Hαis lower, indicating that its emission is displaced towards the inner hemisphere of the secondary star with respect to the NaI doublet. As neither of the two line fea-tures shows significant photometric variability, which would in-dicate a biased origin of one of the line species (e.g. towards the non-irradiated side of the secondary), we exclude irradia-tion as the explanairradia-tion for the observed difference inK2. A
de-tailed comparison of radial velocities derived from the NaI dou-blet and Hα lines has been performed by Rebassa-Mansergas et al.(2007). They find that both velocities often significantly differ but that there seems to be no systematic shift of Hα ra-dial velocities towards smaller values. As discussed in detail in
Rebassa-Mansergas et al.(2008), this is probably explained by the Hαemission being related to activity and not uniformely dis-tributed over the surface of the secondary.Kafka et al. (2005) studied in detail the origin of different line species, however SDSS1212–01231212 shows no evidence of accretion nor ir-radiation. We therefore assume that in SDSS1212–0123 the NaI doublet much better traces the center of mass of the secondary and we use its semi-amplitude for the mass estimate.
We write the mass function of the binary assuming a circular orbit in the form
Msec=
⎛ ⎜⎜⎜⎜⎜ ⎜⎝
2πGsin3i
PK23 Mwd−1
⎞ ⎟⎟⎟⎟⎟
⎟⎠Mwd, (3)
and derive an upper limit forMsecfor a given white-dwarf mass
Mwdassumingi=90◦(see bottom panel of Fig.6).
Using the empirical mass-radius relation for main sequence stars derived byBayless & Orosz(2006) we estimate the radius of the secondary (middle panel of Fig.6). The top panel of the same figure illustrates the maximum possible eclipse length (i=
90◦, black line) for the given stellar radius, the orbital periodP
and the orbital separationaaccording to
tecl=
RsecP
πa · (4)
The measured values of the eclipse length and the range of the white-dwarf mass from Sect.3.3.1are shown in the figure with horizontal and vertical lines, respectively, their intersection is shaded in grey in the top panel. It is also plotted the solution fori=75◦for comparison. From the eclipse length the range of
0.2 0.3 0.4 0.5 0.6
[image:6.595.50.264.74.222.2]Mwd 0.0 0.1 0.2 0.3 Msec 0.1 0.2 0.3 0.0 Rsec 0 5 10 15 20 25 30 tecl (min) i=75
Fig. 6.Solution of the mass function for K2 = 181±3 km s−1 as a function ofMwd(bottom panel); radius from the mass-radius empirical relation fromBayless & Orosz(2006) (mid panel); eclipse duration (top panel), assuming circular orbit and an inclination angle of 90◦. Vertical lines indicate the mass of the primary star,Mwd =(0.33−0.48)M, as determined from the deconvolution of the SDSS spectrum. The eclipse length,tecl =23±1 min, is marked with horizontal lines, and the in-tersection in shaded in grey. The erros inK2are shown with the small dashed lines in the three panels. In the top panel the solution for an in-clination of 75◦ is plotted with a blue line to show it’s influence. See text for a more detailed description.
possible values for the mass of the WD isMwd=0.46−0.52, and
for the dM Msec =0.21−0.32M, andRsec =0.23−0.34R.
3.3.4. Light curve modeling
A determination of most of the physical parameters of an eclips-ing system can be achieved by fitteclips-ing model light curves to the actual data. We made use of a newly developed light curve fitting code, written by Marsh, for the general case of binaries contain-ing a white dwarf.
The code is described in detail inPyrzas et al.(2008). Briefly, a model light curve is computed based on user-supplied ini-tial system parameters. These are the two radii, scaled by the binary separation,Rwd/a and Rsec/a, the orbital inclination,i,
the unirradiated stellar temperatures of the white dwarf and the secondary starTeff,WD andTeff,sec respectively, the mass ratio
q=Msec/Mwdandt0the time of mid-eclipse of the white dwarf.
Starting from this parameter set, the model light curve is then fitted to the data using Levenberg-Marquardt minimisation. Every parameter can either be allowed to vary or remain fixed, during the fitting process.
566 A. Nebot Gómez-Morán et al.: Post common envelope binaries from SDSS. IV.
points in theMwd−Msecplane was first calculated, generously
bracketing the estimates for the mass of the two components (see Sect.3.3.3). Each point defines a mass ratioq, and throughPorb,
a binary separationa. Furthermore, from the mass function equa-tion (Eq. (3)), using the value ofK2 (derived in Sect.3.3.3) and
Porb, one can calculate the inclination anglei. Points for which
(formally) sini > 1 were discarded from the grid, for all other points the corresponding light curve model was computed, lead-ing to the computation of some 9000 models.
As an initial estimate for the radii of the binary compo-nents, we adopted values from the theoreticalM−Rrelations of Bergeron et al. (1995) for the white dwarf, andBaraffe et al.
(1998) – the 5 Gyr model – for the secondary. Regarding the two temperatures, Teff,WD andTeff,sec, the value from our spectral
decomposition (Sect.3.3.1) was used for the white dwarf, while theS p(2)−T relation fromRebassa-Mansergas et al. (2007), together with our result for the spectral type of the secondary, were used to obtain an initial value forTeff,sec.
For the fitting process q, i, Rwd and Teff,WD were fixed,
leaving only Rsec, Teff,sec and t0 free to vary.Rwd was fixed
mainly because of the poor temporal resolution of our data set, which does not resolve the white dwarf ingress and egress. Consequently, if allowed to vary, the white dwarf radius would only be loosely constrained and it would introduce large uncer-tainties in the determination ofRsec.Teff,WD was also fixed,
be-cause allowing both temperatures to vary simultaneously would lead to a degenerate situation, as they are strongly correlated. Our spectral decomposition results are sufficiently accurate, so as to allow us to fixTeff,WD without affecting the fitting result.
The parameter t0 on the other hand, was left free during the
fitting, to account for the O−C errors in the mid-eclipse times, which in some cases were significant (see Table2again).
The results of the light curve fitting process were analyzed as follows. We first applied a cut in the quality of the fits. This was done by selecting the minimumχ2value of all fits and then
culling all model fits at>1σabove the best fit. Afterwards, we selected from the remaining, equally good light curve fits, those which where physically plausible. We defined aδRparameter, as δR=(Rfit−Rth)/Rth, i.e. how much the fitted radius value
devi-ates from the theoretical radius value, obtained from aM−R re-lation, for a given model. Thus, we selected only those models that hadδR≤0.15, to allow for an oversized secondary.
The results are illustrated in Fig.7. Black dots designate those light curve fits making the 1σ cut, red dots those that satisfy both the 1σ andδR = 15% cuts. The resulting ranges in white dwarf masses and secondary star masses (indicated with dashed, vertical, red lines) are Mwd = 0.46−0.6 M and
Msec = 0.23−0.4 M, respectively, corresponding to a white dwarf radius ofRwd=0.013−0.016R and a secondary radius
ofRsec =0.27−0.41R. The range for the inclination angle is
i=82◦−90◦. Also indicated, with dotted, horizontal, gray lines are the radii of M-dwarfs with spectral typesSp(2)=M 3−M 5 in steps of 0.5, based on the spectral type-mass relation given by
Rebassa-Mansergas et al.(2007).
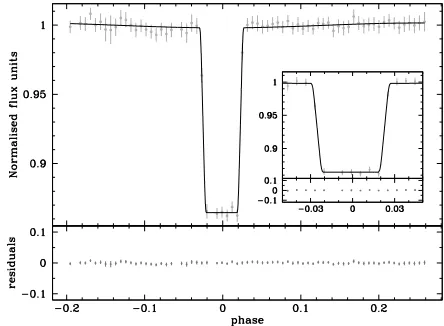
Figure8 shows one example of the light curve fits within the components masses range for the model parameters:Mwd=
0.49M,Msec =0.26 M andi =89.2◦. The detailed models do not predict any variation in the light curve caused by irra-diation of the secondary star by the white dwarf. The predicted variations due to ellipsoidal modulation are expected to be quite small, i.e.∼0.005 mag, consistent with our observational non-detection of any variability outside the eclipse.
[image:7.595.329.551.457.620.2]Sp2=M5.0 Sp2=M3.0
Fig. 7. Light curve model fitting results for SDSS 1212-0123. Left
panel:Mwd andMsec values corresponding to fits withχ2values within 1σ of the minimum value (black points) and, simultaneously, with δR≤0.05 (red points).Right panel: the same, only in theq−iplane. Also depicted inthe left panel are curves corresponding to the mass function (solid black lines,i = 90◦ and 75◦) which (by definition) bracket the possible solutions, Sp(2)−M relations (dotted, horizon-tal, gray lines) and the range of possible (Mwd,Msec) values (dashed, horizontal and vertical, red lines).
Fig. 8. Model fit to the I band light curve of SDSS1212–0123, for
Mwd = 0.49M and Msec = 0.26M. The model meets both theχ2 (within 1σ) and theδR(within 15%) cut-offs. The residuals from the fit are shown atthe bottom of the panel.Inset panel: data points and model fit focused around the eclipse phase.
3.3.5. Spectral energy distribution
We cross-identified SDSS1212–0123 with the database from the Galaxy Evoluion Explorer (GALEX Martin et al. 2005;
Morrissey et al. 2005), and found a detection in the far and near ultraviolet (FUV and NUV). The magnitudes aremFUV =
16.79±0.03 mag andmNUV=16.81±0.02 mag, exposure times
Fig. 9.Spectral energy distribution of SDSS1212–0123. GALEX near and far ultraviolet and 2MASS infrared fluxes (black circles), optical SDSS spectrum (black line). A white dwarf model ofTeff =17 500 K
and logg = 7.5 (blue dashed line) and the spectum of LHS1504 with spectral type M5 from Legget’s library (red dots) are shown for comparison.
the effective temperature of the white dwarf for a certain logg, assuming that all the flux in the UV is emitted by the primary. White dwarf models for logg=7.5 and logg=8.0 and effective temperature in the range 6000−100 000 K, were folded over the FUV and NUV filters. The calculated flux ratio FUV/NUV was compared with the observed for SDSS1212–0123. The GALEX flux ratio impliesTeff∼13 000 K, significantly colder than what
we obtain from the optical spectrum in Sect. 3.3.1. However, discrepant temperatures from GALEX UV and optical photom-etry were noticed earlier from an analysis for a large number of white dwarfs (∼250) byKawka & Vennes(2007). This shows that one cannot expect the same UV and optical temperatures in a case-by-case basis, but at best on a statistical average. For the time being we accept the temperature from our fit to the SDSS spectrum, which grossly reflects the UV to optical SED.
The spectral energy distribution is shown in Fig.9, including ultraviolet, optical and infrared fluxes from 2MASS. A model spectrum for a white dwarf of pure Hydrogen (Koester et al. 2005) with effective temperature of 17 500 K and logg = 7.5 and a spectrum of the M5 star LHS1504 from Legget’s library3 are shown for comparison (Leggett et al. 2000).
3.3.6. Binary parameters summary
Figure10shows the different ranges for the masses of the pri-mary and the secondary from the spectral decomposition fit (Sect.3.3.1), theK-band luminosity-mass relation (Sect.3.3.2), the radial velocity amplitude and eclipse length (Sect.3.3.3) and the detailed light curve fitting (Sect.3.3.4). Of course, the dif-ferent methods are not entirely independent, e.g. the constraints from the eclipse length/radial velocities studies and the detail light curve fitting basically use the same information with the only difference being that we could derive a clear lower limit from the latter. The dark shaded region in Fig.10 represents the ranges of stellar masses in agreement with all the derived constraints i.e.,Mwd = 0.46−0.48 M,Msec = 0.26−0.29M,
implying a radius of the secondary star in the range Rsec =
0.28−0.31R using the empirical M−R relation fromBayless & Orosz(2006) andRwd=0.016−0.018R (logg =7.5−7.7).
We adopt these values as the most probable ones and all finally
[image:8.595.308.535.76.276.2]3 http://ftp.jach.hawaii.edu/ukirt/skl/dM.spectra/
[image:8.595.298.545.378.526.2]Fig. 10.The ranges of masses of the white dwarf and the red dwarf com-ing from: the decomposition of the SDSS spectrum; the infrared bright-ness; the eclipse length for an inclination of 90◦, and, the detailed light curve modelling. Each of the areas is labeled correspondingly, the inter-section of the four different methods occurs forMsec =0.26−0.29 M andMwd=0.44−0.46M.
Table 3.Stellar and binary parameters of SDSS1212–0123.
Parameter Value Parameter Value
RA (J2000.0) 12 12 58.25 Teff(K) 17 700±300
Dec (J2000.0) −01 23 10.1 logg(dex) 7.5−7.7
u 17.045±0.020 Sp(2) M4±1 g 16.769±0.013 Rwd(R) 0.016−0.018
r 16.936±0.013 Rsec(R) 0.28−0.31
i 16.627±0.015 Mwd(M) 0.46−0.48
z 16.136±0.018 Msec(M) 0.26−0.29
J 14.83±0.03 Porb(days) 0.3358706(5)
H 14.35±0.05 K2(km s−1) 181±3
Ks 13.93±0.05 γ2(km s−1) 17±3
mFUV 16.79±0.03 a(R) 1.8±0.1
mNUV 16.81±0.02 imin 82◦
d(pc) 230±20
accepted stellar and binary parameters based on Sloan-data, other catalogues and our own follow-up observations are col-lected in Table3.
4. Evolutionary state
The post CE evolution of compact binaries is driven by angu-lar momentum loss due to gravitational radiation and – perhaps much stronger – magnetic wind braking. Unfortunately, the lat-ter mechanism is currently far from being well constrained, and predicting and reconstructing the post CE evolution sensitively depends on the assumed prescription for magnetic braking.
However, the disrupted magnetic braking scenario proposed by Rappaport et al. (1983) can still be considered the stan-dard model for magnetic braking in close compact binaries. In this scenario it is assumed that magnetic braking ceases when the secondary star becomes fully convective at Msec ∼
0.3M (which corresponds to Porb ∼ 3 h). Although
568 A. Nebot Gómez-Morán et al.: Post common envelope binaries from SDSS. IV.
Fig. 11.Top panel: interpolating the cooling tracks fromWood(1995) and according to the current temperature of the white dwarf (Teff =
17 700 K) we derive for SDSS1212–0123 a cooling age of ∼7× 10⁷years.Bottom panel: assuming gravitational radiation as the only angular momentum loss mechanism we reconstructed the post-CE evo-lution of SDSS1212–0123 and find that it left the CE phase with an orbital period ofPCE ∼ 8.07 h. Apparently, SDSS1212–0123 has passed only a small fraction of its PCEB lifetime and it will take ∼1.8× 10¹⁰ years until SDSS1212–0123 will become a CV. At that moment the white dwarf temperature will beTeff ∼ 4000 K and the
system will be inside the period gap (grey bar).
orbital period gap i.e. the observed deficit of CVs in the range ofPorb ∼ 2−3 h. Moreover, first results of our radial velocity
survey of PCEBs seem to support the idea of disrupted magnetic braking (Schreiber et al. 2008). To predict and reconstruct the post CE evolution of SDSS1212–0123 according toSchreiber & Gänsicke (2003), we therefore assume disrupted magnetic braking.
First, we interpolate the cooling tracks ofWood(1995) and estimate the cooling age of SDSS1212–0123 to be 6.8×10⁷yrs
(see top panel of Fig.11). Second, according to the mass derived for the secondary star (Msec ∼ 0.27M) we assume that, since SDSS1212–0123 left the CE phase, the only mechanism driving the evolution of SDSS1212–0123 towards shorter orbital peri-ods is (and has been) gravitational radiation. As shown in Fig.11
(bottom panel), SDSS1212–0123 left the CE phase with an or-bital period ofPCE ∼ 8.07 h, very similar to the present value.
Significant changes in the orbital period are predicted to occur on timescales longer than the current cooling age of the white dwarf. In∼1.8× 10¹⁰ years SDSS1212–0123 will eventually become a CV within the orbital period gap, however, giving that it’s calculated PCEB lifetime exceeds the age of the Galaxy it is not representative of the progenitors of todays CV population.
5. Conclusions
From optical photometry we conclude SDSS1212–0123 is a eclipsing PCEB with an orbital period of 0.336 days and an eclipse length of 23 min. From spectroscopic follow-up obser-vations we have derived a systemic velocity of 17±3 km s−1 and a semi-amplitude of the radial velocity of 181±3 km s−1.
From the SDSS spectrum we derivedTeff = 17 700±300 K,
logg =7.53±0.2 implying a mass in the range 0.33−0.48M
and a secondary spectral type M4±1, and a distance to the sys-tem of 230±20 parsecs. From infrared photometry, using a mass-luminosity empirical relation we derivedMsec=0.26±0.03M.
We have calculated the radius of the secondary star using an em-pirical mass–radius ralation. The mass function, combined with the eclipse length, points towards the high end of the allowed mass range of the primary, i.e.Mwd∼0.46−0.48. We have
mod-eled theIband light curve and find the inclination of the orbit to bei >82◦, and the masses to be consistent with previously de-termined values. The different methods applied are all consistent withMwd = 0.46−0.48M, implyingRwd = 0.016−0.018R
(logg = 7.5−7.7) for the primary and Msec = 0.26−0.29M,
Rsec =0.28−0.31R for the secondary. We have reconstructed
and predicted the post CE evolution of SDSS1212–0123, find-ing that SDSS1212–0123 at the end of the CE phase had a very similar orbital period. The only mechanism involved in shrink-ing the orbital period is and has been gravitational radiation. As the PCEB lifetime of SDSS1212–0123 exceeds the Hubble time we conclude that it is not representative of the progenitors of the current CV population.
Acknowledgements. We thank our referee, Dr. S.B. Howel, for a careful review of the original manuscript. We thank T.R. Marsh for the use of his light-curve modeling code. A.N.G.M., M.R.S., R.S.C., J.V. and M.K. acknowledge sup-port by the Deutsches Zentrum für Luft-und Raumfahrt (DLR) GmbH under contract No. FKZ 50 OR 0404. M.R.S. was also supported by FONDECYT (grant 1061199), DIPUV (project 35), and the Center of Astrophysics at the Universidad de Valparaiso. J.K. was supported by the DFG priority programme SPP1177 (grant Schw536/23-1). Funding for the SDSS and SDSS-II has been provided by the Alfred P. Sloan Foundation, the Participating Institutions, the National Science Foundation, the U.S. Department of Energy, the National Aeronautics and Space Administration, the Japanese Monbukagakusho, the Max Planck Society, and the Higher Education Funding Council for England. The SDSS Web Site is http://www.sdss.org/. The SDSS is managed by the Astrophysical Research Consortium for the Participating Institutions. The Participating Institutions are the American Museum of Natural History, Astrophysical Institute Potsdam, University of Basel, University of Cambridge, Case Western Reserve University, University of Chicago, Drexel University, Fermilab, the Institute for Advanced Study, the Japan Participation Group, Johns Hopkins University, the Joint Institute for Nuclear Astrophysics, the Kavli Institute for Particle Astrophysics and Cosmology, the Korean Scientist Group, the Chinese Academy of Sciences (LAMOST), Los Alamos National Laboratory, the Institute for Astronomy (MPIA), the Max-Planck-Institute for Astrophysics (MPA), New Mexico State University, Ohio State University, University of Pittsburgh, University of Portsmouth, Princeton University, the United States Naval Observatory, and the University of Washington. This publication makes use of data products from the Two Micron All Sky Survey, which is a joint project of the University of Massachusetts and the Infrared Processing and Analysis Center/California Institute of Technology, funded by the National Aeronautics and Space Administration and the National Science Foundation.
References
Adelman-McCarthy, J. K., Agüeros, M. A., Allam, S. S., et al. 2008, ApJS, 175, 297
Aungwerojwit, A., Gänsicke, B. T., Rodríguez-Gil, P., et al. 2007, A&A, 469, 297
Baraffe, I., Chabrier, G., Allard, F., & Hauschildt, P. H. 1998, A&A, 337, 403 Bayless, A. J., & Orosz, J. A. 2006, ApJ, 651, 1155
Bergeron, P., Wesemael, F., Lamontagne, R., et al. 1995, ApJ, 449, 258 Cutri, R. M., Skrutskie, M. F., van Dyk, S., et al. 2003, The IRSA 2MASS
All-Sky Point Source Catalog, NASA/IPAC Infrared Science Archive http://irsa.ipac.caltech.edu/applications/Gator/ Delfosse, X., Forveille, T., Ségransan, D., et al. 2000, A&A, 364, 217 Drake, A. J., Djorgovski, S. G., Mahabal, A., et al. 2008
[arXiv:0809.1394v2]
Gänsicke, B. T., Araujo-Betancor, S., Hagen, H.-J., et al. 2004, A&A, 418, 265 Horne, K. 1986, PASP, 98, 609
Iben, I. J., & Livio, M. 1993, 105, 1373
Kafka, S., Honeycutt, R. K., Howell, S. B., & Harrison, T. E. 2005, AJ, 130, 2852
Koester, D., Napiwotzki, R., Voss, B., Homeier, D., & Reimers, D. 2005, A&A, 439, 317
Leggett, S. K., Allard, F., Dahn, C., et al. 2000, ApJ, 535, 965 Marsh, T. R. 1989, PASP, 101, 1032
Martin, D. C., Fanson, J., Schiminovich, D., et al. 2005, 619, L1
Morales-Rueda, L., Marsh, T. R., Maxted, P. F. L., et al. 2005, MNRAS, 359, 648
Morrissey, P., Schiminovich, D., Barlow, T. A., et al. 2005, 619, L7 Osterbrock, D. E., Fulbright, J. P., Martel, A. R., et al. 1996, PASP, 108, 277 Osterbrock, D. E., Fulbright, J. P., & Bida, T. A. 1997, PASP, 109, 614 Paczy´nski, B. 1976, in Structure and Evolution of Close Binary Systems, IAU
Symp., 73, 75
Politano, M., & Weiler, K. P. 2007, ApJ, 665, 663
Pyrzas, S., Gänsicke, B. T., Marsh, T. R., et al. 2008 [arXiv:0812.2510v1] Rappaport, S., Verbunt, F., & Joss, P. C. 1983, ApJ, 275, 713
Rebassa-Mansergas, A., Gänsicke, B. T., Rodríguez-Gil, P., Schreiber, M. R., & Koester, D. 2007, MNRAS, 382, 1377
Rebassa-Mansergas, A., Gänsicke, B. T., Schreiber, M. R., et al. 2008, MNRAS, 390, 1635
Richards, G. T., Nichol, R. C., Gray, A. G., et al. 2004, ApJS, 155, 257 Schreiber, M. R., & Gänsicke, B. T. 2003, A&A, 406, 305
Schreiber, M. R., Gänsicke, B. T., Southworth, J., Schwope, A. D., & Koester, D. 2008, A&A, 484, 441
Shimansky, V., Sakhibullin, N. A., Bikmaev, I., et al. 2006, A&A, 456, 1069 Sills, A., Pinsonneault, M. H., & Terndrup, D. M. 2000, ApJ, 534, 335 Silvestri, N. M., Hawley, S. L., West, A. A., et al. 2006, AJ, 131, 1674 Steinfadt, J. D. R., Bildsten, L., & Howell, S. B. 2008, ApJ, 677, L113 Taam, R. E., & Ricker, P. M. 2006, ArXiv Astrophysics e-prints
Tappert, C., Gänsicke, B. T., Schmidtobreick, L., et al. 2007, A&A, 474, 205 van den Besselaar, E. J. M., Greimel, R., Morales-Rueda, L., et al. 2007, A&A,
466, 1031