Am I missing something?
The effects of absence from class on student performance
Wiji Arulampalam, Robin A. Naylor and Jeremy Smith
No 820
WARWICK ECONOMIC RESEARCH PAPERS
Am I missing something?
The effects of absence from class on student performance
Wiji Arulampalam*, Robin A. NaylorandJeremy Smith
February 2006
This version; November 2007
Keywords: Randomised experiments, quantile regression, selection correction, panel data,
education, student performance, class absence.
JEL Classification No.: C41, J24, I2
*
Address for correspondence: Wiji Arulampalam, Department of Economics, University of Warwick, Coventry, CV4 7AL, UK, also IZA Bonn, Germany. Email:[email protected].
Abstract.
1.
Introduction
The analysis of the factors associated with educational attainment and performance has been a major focus of work in the last decade or so as economists have attempted to obtain a deeper understanding of the processes associated with the acquisition of human capital. Work has focused on the importance of factors such as class size and peer effects, inter alia; see, for example, Hanushek et al, (2003), Hoxby, (2000), Krueger (2000), Ehrenberg et al. (2001), and Burtless (1996). Much of the work has concentrated on the educational attainment of pupils in compulsory schooling, with less attention on higher education. Yet the processes associated with post-compulsory human capital accumulation are internationally important given increasing participation rates and the economic significance of the higher education (HE) sector in modern economies. A further motivation for analysing HE processes specifically is that their nature is likely to be fundamentally different to those characterising earlier-stage cognitive development, with greater student autonomy in study one obvious reason for this. One aspect of this autonomy is the relative freedom of students in HE to choose to absent themselves from class. More generally, the modes of study of HE students are less prescribed than in compulsory education: the responsibility for the efficient allocation of study time lies largely with the student – though this is not necessarily uniformly true across all university courses. Our work focuses on issues regarding the relationship between absence from class and academic performance of university students, a subject which has attracted attention since the influential paper of Romer (1993). Our analysis concentrates on variations across students in the causal impact of absence on performance.
of possible implications for the ways in which the nature of the teaching and learning environment in universities might evolve. Traditionally, university teaching in the UK is based on large-group lectures and small-group classes. Attendance at lectures has been seen as optional. Class attendance, however, has been regarded as compulsory for various reasons, which include the perception that: (i) that the value added in class is greater than that in lectures and students might not appreciate this and (ii) class attendance by each student has positive externalities for other students through the contributions each can make to the learning process. With declining resources, class sizes have been increasing across the HE sector and this has undermined the strength of both of these arguments. Indeed, it is likely that in large classes attendance imposes negative externalities through congestion effects.1 There is a view in the sector that small group teaching is no longer as effective as it was and that students, perceiving this, have higher abstention rates. There are various responses to this, including: abandoning small group teaching; resourcing it better; reforming it; making attendance compulsory; and/or creating more explicit incentives for attendance. Developing a better understanding of the effects of class attendance on student outcomes seems timely.
Our empirical analysis exploits a rich administrative panel dataset for cohorts of Economics students at a UK university. We exploit the panel properties of the data to control for unobserved heterogeneity across students and hence for endogeneity between attendance and performance stemming from the likely influence of ability, effort, and motivation on both. That students are randomly assigned to classes avoids the potential endogeneity problems that occur when students can self select into classes. Finally, we use the idea that the time slot of the class in the weekly timetable produces exogenous variation in a student’s
attendance and hence acts as an instrument in order to identify a causal effect of attendance on performance.
From our empirical analysis, we find, among other results, that there is a significant association between missing class and student performance, but that this effect is weakened – but remains significant – when controlling for unobserved individual effects. In a quantile regression specification, it emerges that the adverse effect of missing class is greater for better-performing students, consistent with the hypothesis that effects are likely to vary with factors such as student ability.
In the next section, we present a brief literature review. This is followed, in Section 3, by a theoretical motivation for the analysis of the relationship between absence and student performance. Section 4 presents the data, and key summary statistics, based on cohorts of economics students at the UK university, while, in Section 5 we describe the econometric modelling approach. Section 6 discusses the results from our econometric analysis of the causal effects of tutorial absence on student performance. Section 7 concludes and offers further remarks.
2.
Contextual literature
characteristics, part of any estimated effect of class attendance will reflect a form of (upward) ability bias arising out of endogenous selection. Romer does include in his regression analysis controls for prior grade point average on the grounds that these will capture some of the otherwise unobserved heterogeneity across students. Indeed, Romer notes that as the estimated effect of prior performance depends in part on previous class attendance, the inclusion of prior scores could cause a downward bias in the estimate of the effects of attendance on performance; part of the effect being captured in the control variable.
Following Romer (1993), Durden and Ellis (1995) analyse survey data on absences for 346 economics students on a principles of economics module at a single US university. They report that the average effect of absences on performance is modest, but that there are substantial adverse effects when absence exceeds certain threshold levels. Rodgers (2002), using data on attendance in an introductory statistics module at an Australian university, finds a strong positive association between attendance and performance but, comparing across cohorts, reports that the introduction of a scheme which raised attendance was not associated with enhanced performance. Rodgers infers that attendance alone does not improve achievement.
(2006) find no significant effects of class attendance on performance for students in the Economics Department at a leading UK University, and also find no significant effects of smaller classes on improved performance.
Our own analysis attempts to uncover causal effects of class attendance (or, more specifically, absence – its converse) on the performance of students taking core modules in the second (intermediate) year2of an economics degree course at a UK university. We exploit data for 3 cohorts of students and for 3 modules for each student. Given the panel nature of the data we are able to control for unobserved heterogeneity. We also control for previous attainment and use precise information on the students’ class timetables to generate instruments which we employ in the strategy for the identification of causal effects.
3.
Theoretical discussion
Consider an educational production function3of the following form:
) , ,
(c q r
p
p , (1)
where p is a measure of a student’s educational performance, c is the amount of time allocated by the student to attending class, q is the amount of time spent in alternative forms of study activity, and r captures personal characteristics such as ability, effort and motivation.
Suppose that the objective function of the student is to maximise performance, given by equation (1). Among the constraints will be a time constraint of the form:
t q
c , (2)
2 We describe the selection and properties of the data and of the institutional context in more detail in the Section 4.
where t is the maximum amount of time available for study in a given period. In the production function, assume initially that c and q are neither complements nor substitutes but are independent. The problem for the ‘grade’-maximising student is to allocate their time efficiently between attending class and alternative study time uses, such as attending large-group lectures, private study, or completing assignments. Privately efficient time allocation – we are ignoring externality and public good characteristics of classroom attendance for now (see Lazear, 2001) – will require the student to have knowledge of the marginal productivity of c and q in (1).
In reality, marginal products are likely to be person-specific: one of the challenges for the student is to reflect on their own learning strategies and capacities in developing for themselves a mature appreciation of ‘what works best for them’ – that is, of their own marginal productivities for the factors in their educational production function. Implicitly, the importance of this is embodied in the current emphasis on ‘reflective learning’ and ‘personal development planning’ in UK HE. One of the reasons for not selecting first year students in our data analysis is the acknowledgement that only by the second year will students have had sufficient experience of HE to be able to make informed judgements about their optimal learning strategies. This is also recognised by most UK universities as, typically, first year performance does not contribute to final degree marks and classifications.
Assume for now that the student has accurate information regarding the parameters of their own educational production function. Assume also that marginal products of study time are positive but diminishing in each study activity and are independent of each other and of
ability, i.e. p mpc 0 c
, 0
p
mpq q
, 2 0
2 c p
, 2 0
2 q p , 0 2 q c p , 0 2 r c p , and 0 2 r q p
. We additionally assume that, 0
r p
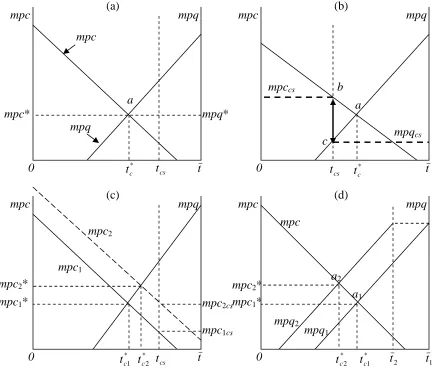
later. With these assumptions, we can represent diagrammatically the solution to the problem defined in equations (1) and (2) for the grade-maximising student: see Figure 1a.
Figure 1 - Efficient study-time allocation.
From Figure 1a, we can see that the grade-maximising student will optimise at point
a, choosing to attend tc* hours of class and engaging in
*
c
t
t hours of additional study. Whether this involves absences from class will depend on the number of scheduled classes available to the student. If there are significant external net benefits of attending class, then – depending on institutional resources – the number of classes supplied to the student, denoted by tcs, is more likely to exceed the student’s optimal number, and hence tcs t*c, as in Figure 1a. If, on the other hand, tcs t*c, then the outcome will be inefficient, at least according to
(a)
(d) (c)
(b)
mpc mpq mpq
mpc mpc mpc mpq mpq 0 0 0 0 t 1 t t t
mpc* mpq*
*
c
t tcs
mpc mpq a a cs t * c t b c mpccs mpqcs cs t * 1 c
t tc*2 mpc1*
mpc2
mpc1
mpc2*
mpc2cs
mpc1cs
mpc 2 t * 2 c
t tc*1
mpq1
mpq2
mpc2*
mpc1*
a2
the student’s private calculus: as shown in Figure 1b, where there is now a wedge between the marginal products: mpcmpq.
In the case described in Figure 1a, the optimising student will choose to miss tcs tc*
hours of class. At the margin, were the student required to attend all tcs classes, then there would be a fall in the student’s performance level as mpqmpc for the marginal classes. Suppose that class attendance is compulsory but that absence is not penalised. Then the propensity of students to miss at least some fraction of the sub-optimal tcs t*c classes will
depend on their attitudes to compliance. Suppose that this is randomly distributed across students. Then it follows that, under the assumptions of the model, in a learning environment in which class attendance is regarded as compulsory but in which, without enforcement, some individuals absent themselves nonetheless, class absences in the range tcs t*c will be associated with improved performance. This is the opposite prediction to the standard hypothesis in the literature that predicts that absence will affect performance adversely. Our prediction arises from an optimising framework in which choices are made with perfect information: at the margin, attendance is productive, but only up to the optimising point.
So far, we have assumed that factor inputs are independent. But suppose now that,
ceteris paribus, the marginal product of attending class is positively correlated with ability:
that is, 0
2
r c
p
. This case is represented in Figure 1c, where the mpc for more able
* 1 *
2 c
c t
t (and hence the association between performance and absence) will be ambiguous: it will depend on comparative advantage; that is, the relative correlation of r with mpc and with mpq.
In an econometric estimation of the effects of absence on performance, correlation between r and either of the other arguments – c, q – in the education production function given by equation (1) could potentially generate endogeneity bias if r is not perfectly observed. If more able students are less likely to be absent from class – tc*2 tc*1, as in Figure 1c above – then the estimated adverse effect of absence on performance will be biased upwards, in absolute terms, through endogenous selection and the resulting ability bias. The empirical investigation of the effects of absence from class on performance should be constructed so as to allow for heterogeneous effects of this sort. This observation lies behind the design of our later estimation strategy. In the case in which tc*2 tc*1, then the direction of endogeneity bias will be downward – but, again, the effects will be heterogeneous.
activities, then t will be negatively correlated with ability. In this case, more able students will be more likely to miss class. Note also from Figure 1d that the effect of missing class will be greater for more able students as *
1 *
2 mpc
mpc . Again, unobserved differences in ability across students will generate a bias in the estimate of the effect of absence on performance as part of the association between absence and performance is being explained by a differential propensity of the more able to be absent from class.
The model we have outlined so far assumes that students have sufficient information to be able to select their optimal level of class attendance. In reality, this is unlikely and students will make mistakes, attending either more or fewer classes than would be privately efficient. If students systematically under-estimate the marginal product of class attendance, then absence will tend to have an adverse effect on performance. This tendency might also be correlated with ability, so that less able students miss more classes and suffer a further reduced level of performance.
Informed by this contextual optimising framework, our empirical strategy will involve: first, an analysis of the factors associated with being absent from class; second, a simple, or ‘naïve’, analysis of the association between student performance and student absence from class; third, an attempt to identify causal effects of absence from class on student performance; and fourth, an investigation of whether or how any effects vary systematically with student characteristics, such as those associated with ability. The following sections describe the data and the econometric strategy for investigating these and related issues.
4.
Data description and summary statistics
4.1 Institutional context
The overall degree classification of students depends equally upon their performance in their 2nd and 3rdyear, during which time they take 8 subject-modules (four in each year) – the 1st year is simply a pass/fail year determining whether students progress into their 2nd year of study. In their 2nd year, students take three compulsory (or core) Economics modules. For students on the BSc Economics degree these are a module in; Macroeconomics (Macro), Microeconomics (Micro) and Econometrics (Etrix). For students on the BSc Industrial Economics degree the core modules are a combined Macroecnomics and Microeconomics module (Econ), Industrial Economics (Ind), and either Economic Statistics and Econometrics (ESE) or Econometrics (Etrix). All students additionally take an optional subject-module from either within the Department or from a list of non-Economics modules.
All compulsory Economics modules are examined by a 3-hour summer written examination worth 80% and two pieces of assessed work (worth 10% each). In each module, tutorial classes are small group meetings held to complement lectures and focus on an exercise sheet or discussion sheet given out by the lecturer of a particular course. These classes are given for all compulsory 2nd year modules and attendance is regarded as compulsory. Students are allocated to their classes by the Department and this is mainly done on an alphabetical basis, with an adjustment for the 4th module option of the student in order to avoid clashes. Classes are held every week in the ESE and Etrix modules (a total of 20 classes in the academic year), but are held less frequently in Ind (12 classes), Macro (13 classes), Micro (16 classes) and Econ (16 classes). In each class, the tutor takes a register for that class and this information is then recorded electronically. The students are sent reminders about their tutorial time and location on the first and second absences (for each module).4 A
3rdabsence requires the student to see their personal tutor and a 4thabsence means the student must see the Director of Undergraduate Studies. After the 4th absence the student is put on report and a record of their attendance across all of their modules is monitored weekly. The Department can seek to have a student’s registration withdrawn from the University for persistent non-attendance at tutorial classes, although this did not happen over the period under analysis.5
We focus exclusively on 2ndyear students in this paper for two reasons. First, we wish to analyse the behaviour of students whose motivation is likely to be to maximise their final score in each module and as the 1st year is simply a pass/fail year, this may well not be the case: first year students are more likely to satisfice than to maximise. Second, we do not include 3rdyear students as 3rdyear modules typically do not run classes alongside lectures.
4.2 Summary Statistics
Despite being compulsory, attendance falls well short of 100% though absence is not as ‘rampant’ as reported by Romer (1993). Figure 2 plots the cumulative distribution function for the proportion of total absences across the three core modules for our 444 students. From the figure we note that around 11% of students missed no classes and around one-fifth of the students missed less than 3% of their classes. The median person missed around 8% of their classes, while the 75thpercentile student missed around 14% of their tutorials.
an interview for an internship and uncondoned absences. In our empirical analysis we consider both types separately but find that the results do not vary across the two types, hence we combine the cases. Note that a student missing a scheduled class but attending an alternative class is not recorded as absent.
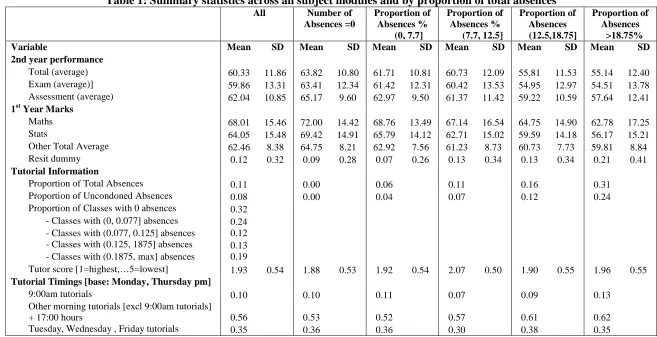
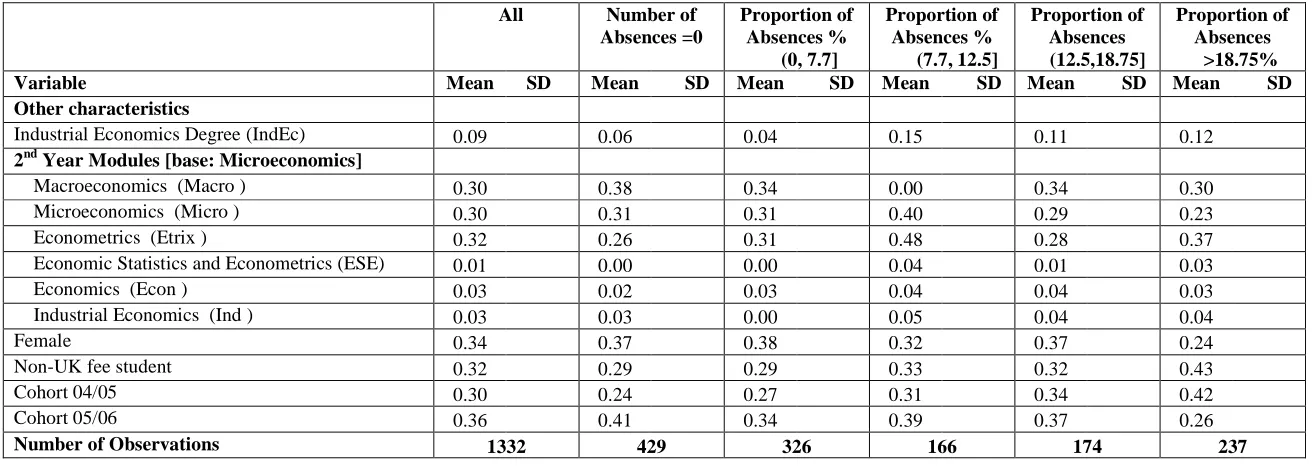
Table 1 presents summary statistics of the variables used in the analysis, for our 444 2ndyear students across their three core modules, broken down by the proportion of total class absences in each module: 0%, (0-7.7%], (7.7-12.5%], (12.5,18.75%] and over 18.75%.6
On average, students missed about 11% of their tutorials and just over 70% of these were uncondoned absences. While approximately one-third of the tutorial classes had no absences, around one-fifth had more than 19% absenteeism, implying that about 3 students are missing from the typical class of 15 students in one-third of cases.
The average overall performance of students in their 3 core modules was 60.3% (made up of an exam average of 59.8% and an assessed average of 62.0%). In their 1st year these students obtained an average mark of 63%, with a mark in Maths of 68% and in Statistics of 64%. 12% of these students were required to resit at least one of their seven 1st year examinations.
Regarding information on the timetable of tutorials, we note that 10% of tutorials start at 9 o’ clock and 74% are held on either Monday or Thursday, compared to only 36% on Tuesday, Wednesday or Friday. Based upon student evaluations of the tutor (undertaken on a scale of 1-5, where 1 is excellent and 5 is poor) the average mark for the tutor across all of their students on the 2ndyear modules is around 1.96.
Of the 2nd year students, 34% are female and 32% are overseas (fee-paying). The breakdown by degree course shows that 91% were registered Economics, with only 9% taking Industrial Economics.
Looking at the figures broken down by the number of missed classes, overall performance in the 2nd year courses is lower for those students who miss more classes. In addition, the dispersion of marks around the mean mark tends to be slightly greater for those
students who miss more classes. We observe that the 1st year performance was markedly stronger for those students who then did not miss any classes in their 2nd year. For example, the Maths and Stats 1st year mark for those who did not miss any classes in their 2nd year was at least 10 percentage points higher than those students who missed at least 19% of the classes. We note that students who have higher absences seem to have more morning classes.
Figure 3 plots the distribution of 2nd year performance in the core modules for those students who missed no classes and also for those who missed at least one class. We note that not only is the distribution of marks shifted towards the left for those students who missed at least one class, but the shape of the distribution is also different. However, these are raw data plots and we next turn to multivariate analysis that will account for the effect of absenteeism on the location and shape of the distribution.
5.
The Econometric Model
The data enable us to observe the performance and tutorial absence of students in each of their three compulsory 2nd year modules. With 444 students over three cohorts in each module, we have a panel of 1332 observations.
The dependent variable p in our model is the student’s end-of-year performance measured as a score out of 100 for each of the student’s three core modules. The main explanatory variable of interest is the proportion of tutorial classes missed during the second year of study, calledabsence, a,defined with respect to each of the three core modules.
We use the quantile regression (QR) framework to estimate the effect of absence, a, on performance,p.7 Unlike the conventional least squares framework that looks at the effect on the conditional mean, the QR framework allows for differing effects ofaon different parts
of the p distribution, thus enabling us to look at the effect of a on the location, scale and shape of the p distribution. This is consistent with the theoretical discussions provided in Section 3, where the personal characteristic is allowed to interact in a non-trivial way witha
and other covariates to have an effect onp.
The th (0<<1) conditional quantile of the p distribution for the j-th module, j =
1,2,3, for thei-th individual (i=1,.., 444) is specified as:
pij=xij’aivi + ij; Quant(ij|xij0 (3)
where Quant(|.) denotes theth conditional quantile of.viis an unobservable individual
characteristic and we estimate this variable using a two-step method. The full set of additional controls used is discussed in the results section.
Step 1
We have absenteeism information on the three core modules for each individuali. Letaijbe
the proportion of tutorials missed by individualiin modulej,where:
aij=zij +vi+ uij (4)
viis individual specific unobservable random effect. The observedaijgenerally lie between 0
and 0.69 with about 32% of the tutorials having zero absences and most of the students missing only up to about a third of the tutorials. Given the nature of our dependent variablea, we estimate the model as a Panel Tobit model. This model assumes that u is distributed as
N(0,2u) and the unobservable individual-specific effect v is distributed as N(0,v As
2003). We then use this ˆi in place ofvi in equation (3). We use gllamm (2004) to obtain
our estimates.8
Stata 9 was used to estimate the coefficients of our QR model. The standard errors were calculated by the bootstrap method using 500 replications which accounts for clustering at the individual level.
6.
Results
6.1 Absenteeism
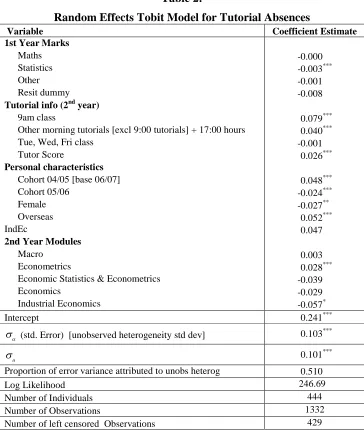
Table 2 reports the results of the random effects Tobit model based on the absenteeism variable, a. The timings of classes are used as instruments in order to identify the causal effect of absenteeism on performance as the students were randomly allocated to classes. Class times for these core modules are largely centrally timetabled to avoid timetable clashes. The results suggest that students who performed well in their 1styear Statistics course tend to have lower absenteeism in their 2ndyear. There are some interesting findings in terms of the information we have on the time of the tutorial class. We find that tutorial absence is markedly higher for the 9am class and to a lesser extent for all mornings classes (those starting before midday) compared to afternoon classes. There is no significant fall in absences in classes on Tuesday, Wednesday and Friday relative. We note that lower absence is associated with a lower (better evaluation) tutor score.
On personal characteristics, we find that female students miss fewer classes compared to male students. Overseas students are found to miss more classes compared to home (EU)
students, holding all else constant. We find no difference in the attendance rates of Industrial Economics degree students compared to Economics students. Absence was higher in 04/05 than for the other two later cohorts. Attendance at classes varies significantly only for one of the subjects, with Etrix experiencing markedly greater absenteeism.
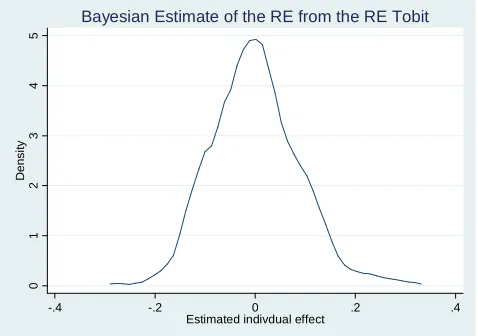
The variance of the individual-specific random effects is found to be significantly different from zero. A plot of the Bayesian estimate of the random effects ˆi is given in
Figure 4a. As expected, it is unimodal and centred around 0. Figure 4b plots the estimated random effects but now separately for students who had no absences in a particular module and for those who had at least one absence in a particular module. Interestingly, the density plot is shifted towards the negative part for those students who had no absences. This implies that these students have a characteristic which makes them less prone to absenteeism.
6.2 Performance
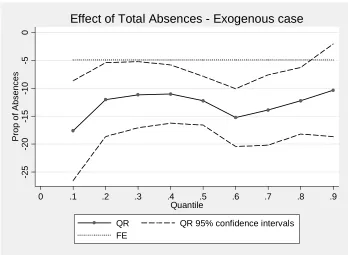
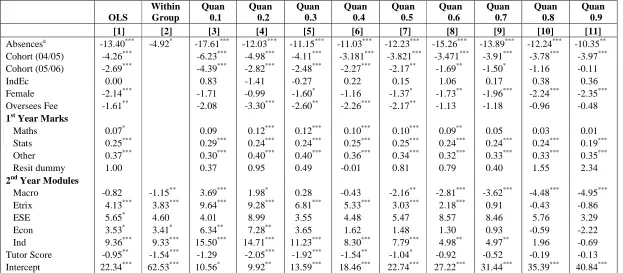
We consider two empirical models: (1) the benchmark models treating absenteeism as exogenous (Table 3 results), and (2) the models treating absenteeism as endogenous using the estimated unobserved individual-specific term as a control for endogeneity in the performance equation (Table 4 results). When we discuss these two empirical models, we present results from pooled ordinary least squares estimation (OLS) (Column [1]), Within Group Estimation (WG) (Column [2] in Table 3) and Instrumental Variable Estimation (using the predicted absences from the first stage panel Tobit model – Column [2] in Table 4) and Quantile Regression estimation (QR) (Columns [3] to [11]). The estimated effects of absences along with the 95% confidence intervals from the within group estimation and also the quantile regression models are presented in Figures 5A and 5B.
covariates on the performance, OLS would consistently estimate the penalty attached to missing classes on the conditional mean performance if there are no selection effects and there is no unobserved heterogeneity. On the other hand, if there is selection and if this selection can be adequately captured by allowing for the unobserved individual effect, WG estimation would provide consistent estimators. Now, turning to the QR model results, these models allow for a heterogeneous effect of the covariates on the various parts of the performance distribution.
We first discuss the results from Model 1, the models that treat absenteeism as exogenous, presented in Table 3. A cursory examination of the plot in Figure 5A suggests the presence of some heterogeneity in the effects of absences on performance. The penalty attached to missing classes is generally found to be smaller for high ability students. It is estimated that for students in the top 10% of the performance distribution being absent from 10% of classes is associated with around a 1 percentage point loss in the subject score,ceteris
paribus, compared to about 2 percentage points for those students in the bottom 10% of the
performance distribution. Interestingly, the penalty for missing classes is very much smaller on the conditional mean performance from the within group estimation. Also, we note that the OLS estimate is very similar to the estimate from the QR model at the median. Therefore, we conclude that there might be some effect of unobserved individual characteristics that needs to be accounted for. Comparison of WG with that of the QR model results indicates that not only might controls for unobservables be relevant, but also that some allowance for heterogeneous effects of covariates on different parts of the performance distribution is important.
that while, on average, females perform better than males at University, they are significantly less likely to obtain a first class degree than males. Given that the criteria for admission into the Department of Economics is AAB at A-level (or equivalent),9 we are by definition observing already high performing individuals.
The coefficients on variables reflecting 1st year performance are as expected, although, in general, these do not show much variation across the quantiles. More interestingly, we find that the effect of the tutor score variable is negative, with students performing better in classes where the tutor has a lower score (better evaluation), although this negative effect becomes smaller across the quantile index.
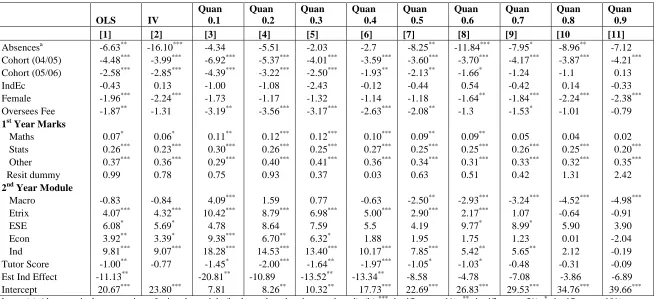
We next turn to the models that allow for the possibility of endogenous selection in the number of classes the student chooses to attend, presented in Table 4. The IV results (Column [2]) are very similar to the OLS results reported in Table 3 (Column [1]), with exogenous absenteeism, where being absent from 10% of classes is associated with around a 1.6 percentage point loss in the subject score, ceteris paribus. For the models presented in Columns [1], and Columns [3]-[11] an estimated ‘individual specific characteristic’ variable is included, although this variable is only significant in the bottom half of the distribution. While the coefficient estimates on most of the covariates are again very similar in terms of magnitude and significance to those reported in Table 3, the coefficient estimates on the absence variable are markedly reduced. Interestingly, we now find that the effect of missing classes is only estimated to be significant for high ‘ability’ students. Missing 10% of classes is estimated to be associated with around 1-2 marks for this group of students. The estimated effect of missing class for the low ‘ability’ students is insignificantly different from zero when selection is accounted for in the estimation.
In summary, when we take into account that individuals might be self-selecting to miss class, we find there is a penalty attached to absence - but only for more able students. The fact that the estimated effects of absence on performance are less negative in the endogenous than in the exogenous model is consistent with our theoretical discussion of Figure 1c where we predicted a negative ability bias – and hence that ability disproportionately raises the marginal product of class attendance, relative to its effect on the marginal product of other forms of study. That the average effect of absence on performance is still negative in the endogenous model suggests that there is no particular excess supply of classes – the case presented in Figure 1a, in which the causal effect of absence on performance would be positive. Similarly, the case presented in Figure 1d – in which more able students allocate less time to total study effort – is not supported. Instead, to the extent that we are correcting fully for ability bias, the results indicate that absences have a negative causal effect on performance: this is consistent with the case presented in Figure 1b,with the implication that the number of classes offered is fewer than the student’s optimising number. We note, however, that the quantile results for the endogenous model show that the significant negative effects of absence on performance hold only for upper quantiles. This is consistent with a combination of the cases depicted in Figures 1b and 1c, with more able students attending more classes than the less able (Figure 1c) and with this optimal number -for the more able only - being greater than the number provided (as in Figure 1b).
7.
Concluding remarks
given that there has been a growing policy focus on higher education, with governments in many countries viewing the university sector as an important driver of research, development and growth. The nature of higher education is likely to be fundamentally different from compulsory primary and secondary education, with greater student autonomy in study in higher education. Our attention in the current paper has focused on the causal impact of class absence on student performance and on variations in the estimated effects according to particular student characteristics. The analysis has also incorporated a study of the determinants of class absence.
Our empirical analysis makes use of rich administrative panel for economics students at a UK university. We have exploited a number of key features of the data-set: (i) the panel nature of the data enables us to control for unobserved heterogeneity across students and hence for endogeneity between attendance and performance stemming from the likely influence of effort and ability on both; (ii) random assignment of students to classes avoids the potential endogeneity problems that occur when students can self select into classes; (iii) information on the time slots of the classes in the student’s weekly timetable serves as a source of exogenous variation in a student’s absence and hence yields potential instruments for the identification of a causal effect of absence on performance.
the marginal product of attendance is greater for more able students. The implications are that: we should find a negative association between absence and performance; that this negative effect should be moderated when we correct for endogenous selection; and that the causal negative effect should be stronger for more able (and hence better-performing) students.
We have reported results consistent with each of these predictions, from which we conclude that a major driver of patterns in class attendance are differences in productivity of class attendance across students. In the absence of controls for unobserved heterogeneity, we find that there is a significant effect of class absence on the student’s performance. This effect is weakened – though remains significant – when controlling for unobserved individual effects. We interpret this as consistent with the presence of ability bias in the naïve regression which fails to model the endogenous nature of absence and performance. In a quantile regression specification, it emerges that the adverse effect of missing class is greater for better-performing students, consistent with our hypothesis that effects are likely to vary with factors such as student ability.
Appendix
Bayesian estimate of the random effects
viis the unobserved individual specific random effects in the model (see equation (2)). Then,
f(vi|data) = f(vi|ai1, ai2,…,aim) =f(ai1, ai2,…,aim| vi)f(vi)/f(ai1, ai2,…,aim)
Thus,
i| i1,..., im
i ( i| i1,..., im) iE a a
f a a d= 1
1
( ,..., | ) ( )
( ,..., )
i i im i i i i im
f a a f d
f a a
1
( i ,..., im| i)
f a a is the conditional likelihood and f a( i1,...,aim) is the marginal likelihood which are obtained during the maximising of the likelihood function. The estimated
i| i1,..., im
References
Buchinsky, M (2001) ‘Quantile regression with sample selection: estimating women’s return to education in the U.S.’, in Fitzenberger, B., Koenker, R., and Machado, J.A.F. (Eds.) (2001)Economic Applications of Quantile Regression, Physica-Verlag.
Burtless, G. (ed.) (1996): Does money matter? The effect of school resources on student
achievement and adult success.Brookings Institution Press. Washington D.C.
Devadoss, S. and Foltz, J. (1996), “Evaluation of factors influencing student class attendance and performance”,American Journal of Agricultural Economics, 78, 499-507.
Durden, G. C. and Ellis, L. V. (1995), “The effect of attendance on student learning in Principles of Economics”,American Economic Review, 85, 343-346.
Ehrenberg, R. G., Brewer, D., Gamoran, A. and Willms, J. D. (2001), “Class Size and Student Achievement”,Psychological Science in the Public Interest, 2 1-30.
Goldstein, H. (2003).Multilevel Statistical Models, 3rdEdition, Kendall’s Library of Statistics 3, Arnold, London.
Hanushek, E. A., Kain, J. F., Markman, J. M. and Rivkin, S. G. (2003), “Does Peer Ability Affect Student Achievement?Journal of Applied Econometrics, 18, 527-544.
Hoxby, C. M. (2000), “The Effects of Class Size and Composition on Student Achievement: New Evidence from Natural Population Variation”, Quarterly Journal of Economics, 115, 239-285.
Krueger, A. B. (2000), “An Economist's View of Class Size Research." InHow Small Classes
Help Teachers Do Their Best, ed. Margaret C. Wang and Jeremy D. Finn.
Philadelphia: Temple University Center for Research in Human Development in Education.
Lazear, E. P. (2001), “Educational Production”, Quarterly Journal of Economics, 116, 777-803.
McNabb, R., Pal, S. and Sloane, P. J. (2002), “Gender Differences in Educational Attainment: The Case of University Students in England and Wales”.Economica, 69, 481-503.
Martins, P. and Walker, I. (2006) “Student achievement and education production: a case study of the effect of class attendance”, mimeo.
Rodgers, J. R. (2002) “Encouraging tutorial attendance at university did not improve performance”,Australian Economics Papers, 41, 255-266.
Romer, D. (1993) “Do students go to class? Should they?,Journal of Economic Perspectives, 7, 167-174.
Stanca, L. (2006), The Effects of Attendance on Academic Performance: Panel Data Evidence for Introductory Microeconomics,Journal of Economic Education.37, 251-266.
Figure 2: CDF of proportion of absences across 3 core modules Figure 3: Total Marks in Core 2ndYear Modules 0 .2 .4 .6 .8 1 C u m u la ti v e d is tr ib u ti o n
0 .2 .4 .6
Proportion of total tutorial absences
0 .0 1 .0 2 .0 3 .0 4 D e n s it y
20 40 60 80 100
Total Marks in Core Modules
Absences=0 Absences>0
[image:31.842.127.390.79.267.2]Total Marks in Core 2nd Year Modules
Figure 4A: Bayes Estimate of the Individual Unobservable Effect Figure 4B: Bayes Estimate of the Individual Unobservable Effect: by absenteeism 0 1 2 3 4 5 D e n s it y
-.4 -.2 0 .2 .4
Estimated indivdual effect
Bayesian Estimate of the RE from the RE Tobit
0 2 4 6 D e n s it y
-.4 -.2 0 .2 .4
Estimated Individual Effect
No Absences Some Absences
[image:31.842.463.702.305.488.2] [image:31.842.140.379.321.489.2]Figure 5A: Effects of Absence on Performance (Exogenous)
-2
5
-2
0
-1
5
-1
0
-5
0
P
ro
p
o
f
A
b
s
e
n
c
e
s
0 .1 .2 .3 .4 .5 .6 .7 .8 .9
Quantile
QR QR 95% confidence intervals FE
Effect of Total Absences - Exogenous case
-2
0
-1
0
0
1
0
C
o
e
ff
o
f
P
ro
p
o
f
A
b
s
e
n
c
e
s
0 .1 .2 .3 .4 .5 .6 .7 .8 .9
Quantile
QR QR 95% confidence intervals IV
Table 1: Summary statistics across all subject modules and by proportion of total absences
All Number of
Absences =0
Proportion of Absences %
(0, 7.7]
Proportion of Absences %
(7.7, 12.5]
Proportion of Absences (12.5,18.75]
Proportion of Absences
>18.75%
Variable Mean SD Mean SD Mean SD Mean SD Mean SD Mean SD
2nd year performance
Total (average) 60.33 11.86 63.82 10.80 61.71 10.81 60.73 12.09 55.81 11.53 55.14 12.40 Exam (average)] 59.86 13.31 63.41 12.34 61.42 12.31 60.42 13.53 54.95 12.97 54.51 13.78 Assessment (average) 62.04 10.85 65.17 9.60 62.97 9.50 61.37 11.42 59.22 10.59 57.64 12.41
1stYear Marks
Maths 68.01 15.46 72.00 14.42 68.76 13.49 67.14 16.54 64.75 14.90 62.78 17.25
Stats 64.05 15.48 69.42 14.91 65.79 14.12 62.71 15.02 59.59 14.18 56.17 15.21
Other Total Average 62.46 8.38 64.75 8.21 62.92 7.56 61.23 8.73 60.73 7.73 59.81 8.84
Resit dummy 0.12 0.32 0.09 0.28 0.07 0.26 0.13 0.34 0.13 0.34 0.21 0.41
Tutorial Information
Proportion of Total Absences 0.11 0.00 0.06 0.11 0.16 0.31
Proportion of Uncondoned Absences 0.08 0.00 0.04 0.07 0.12 0.24
Proportion of Classes with 0 absences 0.32 - Classes with (0, 0.077] absences 0.24 - Classes with (0.077, 0.125] absences 0.12 - Classes with (0.125, 1875] absences 0.13 - Classes with (0.1875, max] absences 0.19
Tutor score [1=highest,…5=lowest] 1.93 0.54 1.88 0.53 1.92 0.54 2.07 0.50 1.90 0.55 1.96 0.55
Tutorial Timings [base: Monday, Thursday pm]
9:00am tutorials 0.10 0.10 0.11 0.07 0.09 0.13
Other morning tutorials [excl 9:00am tutorials]
+ 17:00 hours 0.56 0.53 0.52 0.57 0.61 0.62
Table 1: Continued
All Number of
Absences =0
Proportion of Absences %
(0, 7.7]
Proportion of Absences %
(7.7, 12.5]
Proportion of Absences (12.5,18.75]
Proportion of Absences
>18.75%
Variable Mean SD Mean SD Mean SD Mean SD Mean SD Mean SD
Other characteristics
Industrial Economics Degree (IndEc) 0.09 0.06 0.04 0.15 0.11 0.12
2ndYear Modules [base: Microeconomics]
Macroeconomics (Macro ) 0.30 0.38 0.34 0.00 0.34 0.30
Microeconomics (Micro ) 0.30 0.31 0.31 0.40 0.29 0.23
Econometrics (Etrix ) 0.32 0.26 0.31 0.48 0.28 0.37
Economic Statistics and Econometrics (ESE) 0.01 0.00 0.00 0.04 0.01 0.03
Economics (Econ ) 0.03 0.02 0.03 0.04 0.04 0.03
Industrial Economics (Ind ) 0.03 0.03 0.00 0.05 0.04 0.04
Female 0.34 0.37 0.38 0.32 0.37 0.24
Non-UK fee student 0.32 0.29 0.29 0.33 0.32 0.43
Cohort 04/05 0.30 0.24 0.27 0.31 0.34 0.42
Cohort 05/06 0.36 0.41 0.34 0.39 0.37 0.26
33
Table 2:
Random Effects Tobit Model for Tutorial Absences
Variable Coefficient Estimate
1st Year Marks
Maths -0.000
Statistics -0.003***
Other -0.001
Resit dummy -0.008
Tutorial info (2ndyear)
9am class 0.079***
Other morning tutorials [excl 9:00 tutorials] + 17:00 hours 0.040***
Tue, Wed, Fri class -0.001
Tutor Score 0.026***
Personal characteristics
Cohort 04/05 [base 06/07] 0.048***
Cohort 05/06 -0.024***
Female -0.027**
Overseas 0.052***
IndEc 0.047
2nd Year Modules
Macro 0.003
Econometrics 0.028***
Economic Statistics & Econometrics -0.039
Economics -0.029
Industrial Economics -0.057*
Intercept 0.241***
(std. Error) [unobserved heterogeneity std dev] 0.103***
u
0.101***
Proportion of error variance attributed to unobs heterog 0.510
Log Likelihood 246.69
Number of Individuals 444
Number of Observations 1332
Table 3: Exogenous Absenteeism Model
OLS
Within Group
Quan 0.1
Quan 0.2
Quan 0.3
Quan 0.4
Quan 0.5
Quan 0.6
Quan 0.7
Quan 0.8
Quan 0.9
[1] [2] [3] [4] [5] [6] [7] [8] [9] [10] [11]
Absencesa -13.40*** -4.92* -17.61*** -12.03*** -11.15*** -11.03*** -12.23*** -15.26*** -13.89*** -12.24*** -10.35** Cohort (04/05) -4.26*** -6.23*** -4.98*** -4.11*** -3.181*** -3.821*** -3.471*** -3.91*** -3.78*** -3.97*** Cohort (05/06) -2.69*** -4.39*** -2.82*** -2.48*** -2.27*** -2.17** -1.69** -1.50* -1.16 -0.11
IndEc 0.00 0.83 -1.41 -0.27 0.22 0.15 1.06 0.17 0.38 0.36
Female -2.14*** -1.71 -0.99 -1.60* -1.16 -1.37* -1.73** -1.96*** -2.24*** -2.35*** Oversees Fee -1.61** -2.08 -3.30*** -2.60** -2.26*** -2.17** -1.13 -1.18 -0.96 -0.48
1stYear Marks
Maths 0.07* 0.09 0.12*** 0.12*** 0.10*** 0.10*** 0.09** 0.05 0.03 0.01 Stats 0.25*** 0.29*** 0.24*** 0.24*** 0.25*** 0.25*** 0.24*** 0.24*** 0.24*** 0.19*** Other 0.37*** 0.30*** 0.40*** 0.40*** 0.36*** 0.34*** 0.32*** 0.33*** 0.33*** 0.35***
Resit dummy 1.00 0.37 0.95 0.49 -0.01 0.81 0.79 0.40 1.55 2.34
2ndYear Modules
Macro -0.82 -1.15** 3.69*** 1.98* 0.28 -0.43 -2.16** -2.81*** -3.62*** -4.48*** -4.95*** Etrix 4.13*** 3.83*** 9.64*** 9.28*** 6.81*** 5.33*** 3.03*** 2.18*** 0.91 -0.43 -0.86
ESE 5.65* 4.60 4.01 8.99 3.55 4.48 5.47 8.57 8.46 5.76 3.29
Econ 3.53* 3.41* 6.34** 7.28** 3.65 1.62 1.48 1.30 0.93 -0.59 -2.22
Table 4: Endogenous Absenteeism Model (Using Bayes’ estimate of the individual effect)
OLS IV
Quan 0.1
Quan 0.2
Quan 0.3
Quan 0.4
Quan 0.5
Quan 0.6
Quan 0.7
Quan 0.8
Quan 0.9
[1] [2] [3] [4] [5] [6] [7] [8] [9] [10 [11]
Absencesa -6.63** -16.10*** -4.34 -5.51 -2.03 -2.7 -8.25** -11.84*** -7.95* -8.96** -7.12 Cohort (04/05) -4.48*** -3.99*** -6.92*** -5.37*** -4.01*** -3.59*** -3.60*** -3.70*** -4.17*** -3.87*** -4.21*** Cohort (05/06) -2.58*** -2.85*** -4.39*** -3.22*** -2.50*** -1.93** -2.13** -1.66* -1.24 -1.1 0.13
IndEc -0.43 0.13 -1.00 -1.08 -2.43 -0.12 -0.44 0.54 -0.42 0.14 -0.33
Female -1.96*** -2.24*** -1.73 -1.17 -1.32 -1.14 -1.18 -1.64** -1.84*** -2.24*** -2.38*** Oversees Fee -1.87** -1.31 -3.19** -3.56*** -3.17*** -2.63*** -2.08** -1.3 -1.53* -1.01 -0.79
1stYear Marks
Maths 0.07* 0.06* 0.11** 0.12*** 0.12*** 0.10*** 0.09** 0.09** 0.05 0.04 0.02 Stats 0.26*** 0.23*** 0.30*** 0.26*** 0.25*** 0.27*** 0.25*** 0.25*** 0.26*** 0.25*** 0.20*** Other 0.37*** 0.36*** 0.29*** 0.40*** 0.41*** 0.36*** 0.34*** 0.31*** 0.33*** 0.32*** 0.35***
Resit dummy 0.99 0.78 0.75 0.93 0.37 0.03 0.63 0.51 0.42 1.31 2.42
2ndYear Module
Macro -0.83 -0.84 4.09*** 1.59 0.77 -0.63 -2.50** -2.93*** -3.24*** -4.52*** -4.98*** Etrix 4.07*** 4.32*** 10.42*** 8.79*** 6.98*** 5.00*** 2.90*** 2.17*** 1.07 -0.64 -0.91
ESE 6.08* 5.69* 4.78 8.64 7.59 5.5 4.19 9.77* 8.99* 5.90 3.90
Econ 3.92** 3.39* 9.38*** 6.70** 6.32* 1.88 1.95 1.75 1.23 0.01 -2.04