EFFECT OF DIFFERENT FERMENTATION CONTAINERS ON THE QUALITY OF
Roshan Shrestha*, Rewati Raman Bhattarai
1,2
Tribhuvan University
1e
*
Quality Control Officer, Nebico Biscuits Industries Pvt. Ltd., Kathmandu, Nepal
*Corresponding author email:
ARTICLE INFO ABSTRACT
Gundruk
(Brassica juncea
glass jar, wooden box, earthenware pots and plastic jars which were evaluated sensorially and analyzed chemically. Sensory analysis revealed higher accepta
compared to others. The moisture content, crude fiber, ash, calcium and iron contents on dry basis were found to be 7.92%, 14.65 g/100g, 0.68 g/100g, 2253 mg/100g and 86.4 mg/100g respectively for gundruk
was found to be 1.0% (as lactic acid) and 3.9 respectively on 9
INTRODUCTION
In the context of Nepal, fermented food constitute the major nutrient items for rural masses that form the bulk of population in the country. Fermentation of vegetables, dairy products, cereals and beans, as also alcoholic beverages, has been in practice in Nepal since a long time. A significant quantity of fermented foods is produced and consumed throughout the country (Karki, 1984). Gundruk
most prized fermented foods of Nepal. Technically it is a traditional, non salted fermented leafy vege
indigenous in Nepal. Gundruk is primarily valued for its uniquely appetizing taste or flavor. From nutritional standpoint, gundruk can be considered as a concentrated source of minerals, vitamins, therapeutically active compounds. Findings suggest that if consumed regularly, there is no denying that gundruk solves some of our nutritional problems (Upadhaya, 2002).
Pediococcus and Lactobacillus species are the predominant
micro-organisms during gundruk fermentation. The fermentation is initiated by L. cellobiosus and
and other homolactics make a vigorous growth from the third day onwards. Pediococcus pentosaceus increases in number on the fifth day and thereafter declines (Karki
During fermentation, the pH drops slowly to a final value of 4.0 and the amount of acid (as lactic) increases to about 1% on
*Corresponding author:[email protected]
ISSN: 0975-833X
Article History:
Received 19th August, 2012
Received in revised form
29thSeptember, 2012
Accepted 17th October, 2012
Published online 23th November, 2012
Key words: Gundruk, Fermentation, Physiochemical properties, Sensory properties, Nepal.
RESEARCH ARTICLE
EFFECT OF DIFFERENT FERMENTATION CONTAINERS ON THE QUALITY OF
Rewati Raman Bhattarai
1and
2Surendra Bahadur Katawal
University
,
Central Campus of Technology, Hattisar, Dharan, Nepal
e-mail: [email protected]
Quality Control Officer, Nebico Biscuits Industries Pvt. Ltd., Kathmandu, Nepal
*Corresponding author email: [email protected]
ABSTRACT
Gundruk, a typical indigenous vegetable product of Nepal was prepared from leaves of mustard
Brassica juncea) and cabbage (Brassica oleracea capitata) in different fermentation containers glass jar, wooden box, earthenware pots and plastic jars which were evaluated sensorially and analyzed chemically. Sensory analysis revealed higher acceptability for
compared to others. The moisture content, crude fiber, ash, calcium and iron contents on dry basis were found to be 7.92%, 14.65 g/100g, 0.68 g/100g, 2253 mg/100g and 86.4 mg/100g respectively
gundruk prepared in glass container. The optimum acidity and pH for
was found to be 1.0% (as lactic acid) and 3.9 respectively on 9th day of fermentation.
Copy Right, IJCR, 2012, Academic Journals
In the context of Nepal, fermented food constitute the major nutrient items for rural masses that form the bulk of population in the country. Fermentation of vegetables, dairy products, cereals and beans, as also alcoholic beverages, has n Nepal since a long time. A significant quantity of fermented foods is produced and consumed
Gundruk is one of the
most prized fermented foods of Nepal. Technically it is a traditional, non salted fermented leafy vegetable product is primarily valued for its uniquely appetizing taste or flavor. From nutritional can be considered as a concentrated source of minerals, vitamins, therapeutically active ggest that if consumed regularly, there solves some of our nutritional
species are the predominant fermentation. The
and L. plantarum,
and other homolactics make a vigorous growth from the third increases in number on the fifth day and thereafter declines (Karki et al., 1983). During fermentation, the pH drops slowly to a final value of 4.0 and the amount of acid (as lactic) increases to about 1% on
the sixth day (Karki et al., 1983). Nepal has a population of about 27,641,000 (UNICEF, 2010) of which 90% is involved in agriculture. A conservative estimate reveals that the annual production of fermented leafy vegetable pickle
2000 tonnes (Wiki, 2010) and
vegetable pickle gundruk) is 1000 MT (Karki
Gundruk is valued for its uniquely appetizing flavor.
is used as an alternative source of green vegetables in the lean season. In Nepal about 2% of the
industrialized (Rai, 2004). The most common raw material used for the preparation of gundruk
leaves. However, depending on the availability of the raw materials, gundruk has been prepared in the country using various other leaves, e.g. radish (
(Brassica campestris var.
oleracea), etc (Upadhaya, 2002). Traditionally
been prepared at household levels using different fermentation mediums such as pit, dhungro
and earthenware pots. But no best material for
preparation has been known (Personal Communication, 2009).
Nowadays traditional foods are gradually disappearing from the diet. The trend, particularly f
in Asia, declining towards consumption of foreign food is increasing. Traditional foods contribute to generate employments and income. The change in diet is largely linked to changes in income and wealth, the wider availability range of alternate foods, changing perceptions and values of foods, changing demographics and globalization of trade etc (Khadka, 2005). The use of gundruk
in antiquity but the popularity of the product is still very high. Available online at http://www.journalcra.com
International Journal of Current Research
Vol. 4, Issue, 11, pp.315-320, November,2012
INTERNATIONAL
EFFECT OF DIFFERENT FERMENTATION CONTAINERS ON THE QUALITY OF
GUNDRUK
Surendra Bahadur Katawal
1Central Campus of Technology, Hattisar, Dharan, Nepal
Quality Control Officer, Nebico Biscuits Industries Pvt. Ltd., Kathmandu, Nepal
[email protected]
, a typical indigenous vegetable product of Nepal was prepared from leaves of mustard ) in different fermentation containers viz.
glass jar, wooden box, earthenware pots and plastic jars which were evaluated sensorially and bility for gundruk prepared in glass jar compared to others. The moisture content, crude fiber, ash, calcium and iron contents on dry basis were found to be 7.92%, 14.65 g/100g, 0.68 g/100g, 2253 mg/100g and 86.4 mg/100g respectively n glass container. The optimum acidity and pH for gundruk prepared in glass
day of fermentation.
, Academic Journals. All rights reserved.
1983). Nepal has a population of about 27,641,000 (UNICEF, 2010) of which 90% is involved in agriculture. A conservative estimate reveals that the annual production of fermented leafy vegetable pickle gundruk is 2000 tonnes (Wiki, 2010) and sinki (another fermented Rooty ) is 1000 MT (Karki et al., 1984). is valued for its uniquely appetizing flavor. Gundruk
is used as an alternative source of green vegetables in the lean season. In Nepal about 2% of the gundruk production is industrialized (Rai, 2004). The most common raw material
gundruk in the country is mustard
leaves. However, depending on the availability of the raw has been prepared in the country using various other leaves, e.g. radish (Raphanus sativus), rapeseed var. toria), cauliflower (Brassica
, etc (Upadhaya, 2002). Traditionally gundruk has been prepared at household levels using different fermentation
dhungro, wood, plastic jars, glass jars
and earthenware pots. But no best material for gundruk
preparation has been known (Personal Communication, 2009).
Nowadays traditional foods are gradually disappearing from the diet. The trend, particularly from many developing nations in Asia, declining towards consumption of foreign food is increasing. Traditional foods contribute to generate employments and income. The change in diet is largely linked to changes in income and wealth, the wider availability of a range of alternate foods, changing perceptions and values of foods, changing demographics and globalization of trade etc
gundruk as a food in Nepal is lost
in antiquity but the popularity of the product is still very high.
An estimate reveals that gundruk is more consumed in rural areas than in the urban regions. The cheapness of the product and the ease of preparation is the main reason for so. But hygienic quality of product is always under question and hence the product is not commonly eaten in the big cities (Upadhyay, 2002).
Gundruk is good source of nutrient but its tendency among the
educated urban class to suspect its hygienic and nutritional quality because of the methodology adopted in the preparation
of gundruk is prevalent. The present study is therefore a
preliminary effort towards finding the possibility of improving the traditional technology to commercialize using best fermentation container for preparation of the best quality of
gundruk. The study will also focus in value-addition of the
surplus and wastage vegetable leaves but the overall emphasis will be on the application of appropriate technology for the commercial production of good quality gundruk using different fermentation containers.
If the most potential products could be commercialized, huge numbers of people will have alternate source of income. At present, majority of traditional foods are made in the household level for direct consumption or sale, and with very little in the way of commercialization. With a little technical assistance and attention to hygienic and quality, many of the products could be commercialized.
MATERIALS AND METHODS
Raw materials
Leaves of mustards (Brassica juncea), locally called thulo tori
were brought from Panmara, Panchakanya V.D.C, Sunsari
district and cabbage (Brassica oleracea capitata) was brought from local market of Dharan. Selection was made on the basis of freshness.
Other materials
For the preparation of gundruk 8 plastic (HDPE) bottles, 8 glass bottles, 8 earthenware pots (1/2 kg capacity) and 8 small wooden boxes were brought from local market of Dharan. A set of mortar and pestle was also taken for the fragmentation of leaves. All above containers were disinfected with 1.25 % KMS solution.
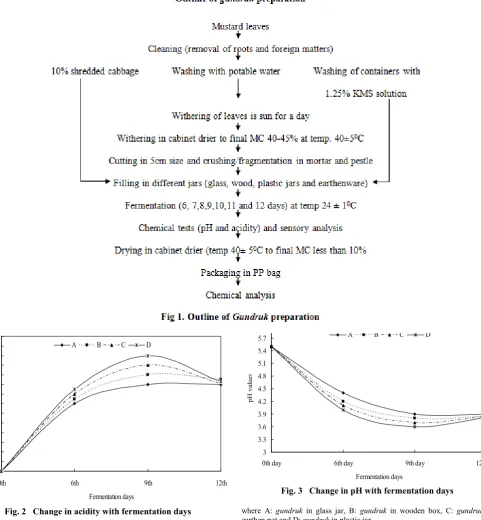
Method of gundruk preparation
The mustard leaves and cabbage leaves were manually cleaned and washed in potable water to remove dirt and other adhered foreign matters. Cabbage was cleaned and shredded to 5 cm length. The cleaned leaves were withered in the sun for a day on the plastic mat at ambient temperature. The leaves were withered in cabinet dryer to moisture content of 40±5% at a temperature of 45±5˚C. The withered leaves were cut into 5 cm in length and crushed in a clean mortar. The leaves were tamped gently and uniformly (placing little amount at a time making alternative layer with shredded cabbage) in 32 sterile fermentation jars. All the containers (Glass, wood, plastic and earthenware), withering plastic mat and mortar and pestle were disinfected with 1.25% KMS (Potassium Metabisulfite) solution. 600-700g of leaves was
places in each jar. The mouths of the jars were tightly closed by covering with clean polyethylene bags. The incubator was disinfected with formalin before use. The samples were fermented at room temperature for up to 12 days at 24±1˚C temperature. Final drying of the product was done in cabinet drier at temperature 40±5º C to moisture less than 10%. The outline of gundruk preparation and testing used in the present study is given in Fig. 1.
Sampling
Samples were taken out from 6th day onward for sensory, pH and acidity analysis. Each container represented a sample and it was not reused for further fermentation or analysis. Samples were taken out between 11 AM to 1 PM to adjust the time period of fermentation.
Chemical analysis
Determination of moisture
The moisture content was determined by hot air oven method as described in AOAC (2005).
Determination of acidity and pH
Acidity was determined by titrimetric method described by Ranganna (2002) and pH by pH meter.
Estimation of total ash
Total ash was estimated following the method described by Ranganna (2002).
Estimation of minerals
Calcium content was estimated by titrimetric method and iron content was estimated by colorimetric method as described by Ranganna (2002).
Estimation of crude fiber
Crude fiber was determined by method as described by AOAC, (2005).
Sensory evaluation
Sensory evaluation was carried out using 9-point hedonic rating as described by Ranganna (2002). The samples were placed in Petri-plates with code numbers and presented to 20-members (teachers, laboratory staffs, library staffs and students who were habituated of eating gundruk) sensory panelists in CCT. Sensory evaluation was carried out for the quality attributes viz., color, flavor, taste and overall acceptability to carry out comparative evaluation of gundruk prepared in different types of containers i.e. plastic, glass, wood and earthenware.
Statistical analysis
P≤0.05 and the best treatment was selected.
RESULTS AND DISCUSSION
According to the protocol given in Fig. 1, different samples of gundruk were prepared in different containers viz. glass jar, wooden box, earthenware pot and plastic jar and analyzed. The results obtained with discussion are as follows.
Change in acidity and pH during fermentation
The change in acidity with fermentation days is given in Fig. 2. The statistical analysis shows that the there was no significance difference between samples for acidity on zero day of fermentation. All samples had same mean acidity value 0.1. There was no significant difference between samples for acidity on 12th day of fermentation. The mean acidity for sample A, B, C and D were found to be 1.0, 1.05, 1.01 and 1.03 (% in lactic acid). On 6th day of fermentation, the mean acidity value for sample A, B, C and D were found to be 0.8, 9.85, 0.9, and 0.95 (% as lactic acid). The LSD values indicate that sample A was significantly different from sample B, C and D on 6th day of fermentation. The score was highest for sample D. Sample A was significantly different from B, C and D on 9th day of fermentation. The mean acidity value for sample A, B, C and D were found to be 1.0, 1.1, 1.2 and 1.3 (% as lactic acid). Sample D scored highest points for acidity.
The Fig.2 suggests as fermentation days increases, the acidity (as lactic acid) increases but after an optimum value, the acidity becomes constant or slightly decreases. On 6th day of fermentation, the highest acidity is 0.95% which was scored by sample D. On 9th day, the acidity was found to be increased significantly for all samples and the highest acidity is 1.3 which was scored by sample D. On 12th day, however, no significant increase in acidity was found for all samples. The initial stage of fermentation was aerobic. The initiator organism was probably Leuconostoc mesenteroides (Karki, 1986). This organism has a good capability of attacking sucrose and fructose producing acidity at the initial stages of fermentation, thus inhibiting non –lactic bacteria. Stocking out oxygen and rising acidity level may be the main reason for the disappearance of L. mesenteroides. Immediately, the working place was dominated by heterofermentative Lactobacillus
brevis and homofermentative Lactobacillus plantarum. This
two species were responsible for the increase in acidity upto a maximum level. But the termination of fermentation was worked out by L. plantarum
Change in pH with fermentation days is shown in Fig. 3. The statistical analysis shows that there was no significance difference between samples for pH on zero day of fermentation. All four samples had same pH values 5.5. There was no significant difference between samples for pH on 12th day of fermentation. The mean pH values for sample A, B, C and D were found to be 3.9, 3.85, 3.85 and 3.83 (% as lactic acid). On 6th day of fermentation, mean pH value for sample A, B, C and D were found to be 4.4, 4.2, 4.1 and 4.0 respectively. The LSD values indicate that the sample A was significantly different from sample B, C and D on 6th day of fermentation. Sample A had highest pH. Sample A was significantly different from B, C and D on 9th day of fermentation. The mean pH values for sample A, B, C and D
were found to be 3.9, 3.8, 3.7 and 3.6 respectively. Sample A had highest pH. The Fig. 3 suggests as fermentation days increases, the pH values decreases in the same manner as acidity increases. But the trend does not remain same after 9th day of fermentation due to stopping of fermentation. On statistical analysis between the 9th and 12th days taking the samples, no significant difference was found between the samples for pH and acidity. It suggests that there was no significant difference in acidity and pH on 9th and 12th day which means gundruk had reached its optimum value of acidity and pH on 9th day of fermentation.
Hence, from both the figures, it can be concluded that as fermentation days increases, acidity (as lactic acid) increases while pH decreases till fermentation ceases completely. Also the trend of change remains the same from 6th to 9th days. The above result complies with Karki et al., 1983 who concluded during fermentation the pH drops slowly to final value of 4.0 and the amount of acid (as lactic acid) increase to about 1% which was found in 9th day of fermentation in present study. The significant difference in acidity and pH might be due to different properties of fermentation containers.
Sensory analysis
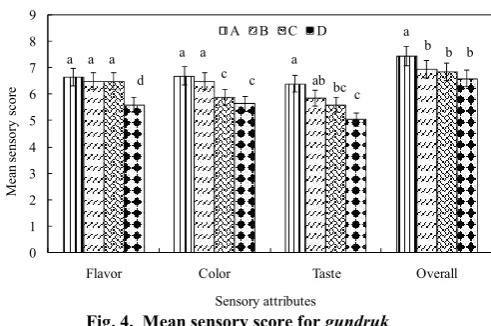
Sensory evaluation was carried out on the products obtained on 9th day only. The sample of this day was chosen on the basis of fermentation as fermentation was terminated on this day. The mean sensory score is shown graphically in Fig. 4.
Flavor
The mean sensory score given by panelist for flavor for samples A, B, C and D were found to be 6.65, 6.5, 6.5 and 5.6 respectively. The score was highest for sample A. The LSD indicates that the sample A was significantly different from sample D but non significant with samples B and C for flavor at 5% level of significance. Among sensory attributes the flavor is considered to be the most important factor in determining consumer’s response. Flavor of all samples on 9th days of fermentation improved because during fermentation the metabolic processes are responsible for the basic flavor changes. In gundruk prepared in glass, due to good protection of odor (FAO, 2010) and due to high purity and high homogeneity of glass more flavoring compounds were retained and hence, got highest scores. But most of the panelists liked the flavor of samples A, B and C.
Color
The mean sensory score given by panelist for color for samples A, B, C and D were found to be 6.7, 6.5, 5.5 and 5.65 respectively. The score was highest for sample A. The LSD values indicate that sample A was significantly different from C and D but non significant with B for color at 5 % level of significance. Sample C and D were non significant different but sample B was significantly different from C and D. Although the sample A and B were none significant difference, the mean sensory score is highest for sample A.
Taste
Change in acidity during fermentation
Fig. 2 Change in acidity with fermentation days
where A: gundruk in glass jar, B: gundruk in wooden box, C: gundruk in
earthen pot and D: gundruk in plastic jar.
Change in pH during fermentation
Fig. 3 Change in pH with fermentation days
where A: gundruk in glass jar, B: gundruk in wooden box, C: gundruk in
earthen pot and D: gundruk in plastic jar.
Sensory scores for gundruk
0.1 0.2 0.3 0.4 0.5 0.6 0.7 0.8 0.9 1 1.1 1.2 1.3 1.4 1.5
0th 6th 9th 12th
Fermentation days
A
c
idi
ty v
a
lues
A B C D
3 3.3 3.6 3.9 4.2 4.5 4.8 5.1 5.4 5.7 6
0th day 6th day 9th day 12th day
Fermentation days
pH
val
ues
A B C D
Table 1: Chemical composition of gundruk (per 100g sample)
Parameters A B C D
Moisture content (%)(wb) 7.92(0.12)a 8.13(0.05)a 8.05(0.19)a 7.87(0.11)a
Crude fiber (g/100g)(db) 14.65(0.31)a 14.85(0.16)a 14.56(0.18)a 14.79(0.30)a
Ash (g/100g)(db) 0.68(0.08)a 0.64(0.11)a 0.66(0.06)a 0.69(0.13)a
Ca (mg/100g)(db) 2253(2.51)a 2247(3.60)a 2249(2.08)a 2249(2.08)a
Iron (mg/100g)(db) 86.4(3.79)a 84.3(2.67)a 83.0(2.13)a 89.6(3.11)a
Where, A: Gundruk in glass jar, B: Gundruk in wooden box, C: Gundruk in earthen pot and D: Gundruk in plastic jar. wb: wet basis and db: dry basis.
[image:4.595.64.546.207.728.2]Fig. 4. Mean sensory score for gundruk
Note: The values are the means of triplicates. Values in the bars bearing
similar superscript are not significantly different at 5% level of significance,
Where, A: gundruk in glass jar, B: gundruk in wooden box, C: gundruk in
earthen pot and D: gundruk in plastic jar.
respectively. The score was highest for sample A. The LSD values indicate that sample A was significantly different from C and D but was non significant with B for taste at 5% level of significance. Similarly sample C is significantly different from A and B but non significant with sample D. Although the sample A and B were non significantly difference, the mean sensory score is highest for sample A.
Overall acceptance
The mean sensory score given by panelist for overall acceptance for samples A, B, C and D were found to be 7.45, 6.95, 6.85 and 6.60 respectively. The score was highest for sample A. The LSD values indicate that sample A was significantly different from samples B, C and D at 5 % level of significance but sample B, C and D were non significant different with each other. Hence sample A can be regarded superior in terms of overall acceptance. In this study, the sample A was significantly different from sample D but non significant with samples B and C for flavor at 5% level of significance. Although the samples A, B and C were non significant different, mean sensory score is highest for sample A. Similarly, the sample A was significantly different from C and D but non significant with B at 5 % level of significance for color. Sample C and D were not significantly different but sample B was significantly different from C and D. although the samples A and B were non significant different, mean sensory score is highest for sample A. so, sample A can be regarded superior in terms of color. Similarly, the sample A was significantly different from C and D but was non significant with B for taste at 5% level of significance. Although the sample A and B were not significant, mean sensory score is highest for sample A. Although the sample A and B were not significantly different (p≤0.05) on flavor, color and taste but sample A got highest score for all sensory attribute revealed from the above result and discussion, and sample A was statistically superior for overall acceptance. Hence, on this basis sample A i.e. gundruk prepared in glass jar was found to be best.
Chemical composition of gundruk
The chemical composition of gundruk is given in Table 1. The result and discussion about respective parameters are as follows:
Moisture
The moisture content of samples was not found significantly different at 5% level of significance for all samples. The moisture contents for all samples were found to be within general requirements for gundruk. Non significant difference in moisture might be due to drying of all samples in cabinet drier to fixed moisture content for fixed time period. The final moisture content for all samples in this study was below 10% which is safe level for dried product like gundruk. In similar works by Shrestha, 2002 found 6.6% moisture content for solar dried gundruk and 9.6% for sun dried gundruk.
Gundruk is a product with high acid and least sugar content,
and hence is an unfavorable environment for the proliferation of most microorganisms. Consequently, it may not be necessary to bring down moisture level below 6% which is the required level for dried fruits and vegetables (Shrestha, 2002).
Ash content
There was no significant difference between the ash content of the different samples prepared in different fermentation containers at 5% level of significance. The ash content was found to be 0.68 g/100g on dry basis for sample A. Non significant difference in ash content for all samples might be due to raw material of same variety and same season having similar composition.
Calcium content
There was no significant different (p<0.05) between all samples for calcium contents. The calcium (mg/100g) on average was found to be 2253 mg/100g for sample A. The above results are quite close to Food Composition Table (Anon, 1994) for Mustard gundruk.
Iron content
There was no significant different (p<0.05) between all samples for iron contents. The iron content (mg/100g) on average was found to be 86.4 mg/100g for sample A. The above results are quite close to Food Composition Table (HMG-N, 1994) for Mustard gundruk. Green vegetables are good source of mineral and vitamin content. In present study, only minerals were estimated because these are the major minerals known to be absorbed from the vegetables. Thus it can be concluded that gundruk contains appreciable amounts of minerals, particularly calcium and iron. Hence, gundruk
which is consumed only for organoleptic reasons must be now recommended as food to meet minerals requirements of our body.
Crude fiber
There is no significant difference between crude fiber at 5% level of significance for all samples prepared in different fermentation containers. The crude fiber was found to be 14.65 g/100 g on dry basis of gundruk for sample A. Non significant difference in crude fiber for all samples might be due to raw material of same variety and same season having similar composition.
Conclusions
The chemical composition of all gundruk samples were found to be remain as same irrespective of fermentation containers. Fermentation container has found to have significant effects the sensory quality of prepared gundruk. The gundruk was
0 1 2 3 4 5 6 7 8 9
Flavor Color Taste Overall
M
ea
n
sens
or
y
scor
e
Sensory attributes
A B C D
a a
d
a a a
c c
a
a
ab c
b
bc
prepared on 9th day of fermentation at temperature 24±1˚C. As fermentation days increases, acidity increases while pH decreases till maximum value which is found at 9th day of fermentation. Among all the fermentation containers used, the
gundruk prepared in glass container was found to be had best
quality. Gundruk is a good source of minerals esp. calcium and iron.
REFERENCES
Anonymous (1994). Nutrients Contents in Nepalese Food, HMG (Nepal). Ministry of Agriculture.
AOAC 2005. “Official method of Analysis”. Association of Official Analytical Chemist, Washington DC. p .46-47 FAO 2010. Packaging. Accessed in http://www.fao.org on
January 15, 2010.
Karki, T.B. Kozaki, M. and Itoh, H. 1983. Chemical changes Occurring in gundruk During Fermentation. Part II-2: Flavor components. Lebennsm-Wiss Technol. 16:203 - 208
Karki, T.B. 1984. Some Nepalese Fermented Foods and Beverage of Nepal. First National seminar of Food Industry and Food Technology NASOFIFT-I, (23-26 April) Dharan Campus, Tribhuvan Univ, pp. 165-177.
Karki, T.B. 1986. Fermented vegetables. In Concise Handbook of Indigenous Fermented Foods in the ASCA Countries. Canberra, Govt. of Australia.
Khadka, S.B. 2005. Traditional Food in Nepal: A Survey Report. Food Nepal.08.21-24.
Rai, B. K. 2004. Industrial Microbiology. Central Campus of Technology, Hattisar.
Ranganna, S. 2002. Manual of Analysis of fruits and vegetable products. Tata Mc Graw Hill Publishing Company ltd., New-Delhi, India. PP: 410,425.
Shrestha. V. N. 2009. Personal Communication.
Shrestha, R. 2002. Preparation and Comparative study on Sun and Solar Dried Gundruk.
B. Tech. (Food), Dissertation, Tribhuvan Univ., Nepal.pp.5-9, 23-24.
Upadhaya, A. 2002. Preparation and Quality evaluation of
gundruk. B. Tech. (Food), Dissertation, Tribhuvan
Univ., Nepal.pp.3-11.
UNICEF, 2010. UNICEF in Nepal country programme 2008-2010. Cited in: www.unicef.org/nepal/ Unicef_in _Nepa _2008_-_2010.pdf Wikipedia, 2010. Gundruk. Cited in
en.wikipedia.org/wiki/Gundruk.