Why do some molecules form hydrates or solvates?
Simon Boothroyd,
1Andy Kerridge,
1Anders Broo
2, David Buttar
3and Jamshed Anwar
1,*1
Chemical Theory and Computation, Department of Chemistry, Lancaster University, Lancaster LA1 4YB U.K.
2
Pharmaceutical and Analytical R & D, Experimental Formulations, AstraZeneca R&D Mölndal, SE-431 83
Swe-den
3
Pharmaceutical Sciences, AstraZeneca, Silk Road Business Park, Macclesfield, SK10 2NA, U.K.
KEYWORDS
Crystal solvate • Crystal hydrate • Crystallisation • Phase diagram • Molecular simulation
.ABSTRACT: The discovery of solvates (crystal structures where the solvent is incorporated into the lattice) dates back to the dawn of chemistry. The phenomenon is ubiquitous with important applications ranging from the development of pharmaceuticals to the potential capture of CO2 from the atmosphere. Despite this interest, we still do not fully understand why some molecules form solvates. Here, we employ molecular simulation using simple models of solute and solvent molecules, whose interaction parameters can be modulated at will to access a universe of molecules that do and do not form solvates. We investigate the phase behaviour of these model solute-solvent systems as a function of solute-solvent affinity, molecule size ratio, and solute concentration. Our simu-lations demonstrate that the primary criterion for solvate formation is that the solute-solvent affinity must be sufficient to overwhelm the solute-solute and solvent-solvent affinities. A strong solute-solvent affinity in itself is not a sufficient condition for solvate for-mation: in the absence of such affinity, a solvate may still form provided that the self-affinities of the solute and the solvent are lower in relative terms. We show that even solvent-phobic molecules can be induced to form solvates by virtue of the pV component of the Gibbs potential arising from either a more efficient packing or high pressure overcoming the energy penalty.
INTRODUCTION
When a solute crystallises from solution, it may do so either as a pure crystal or as a solvate with the solvent molecules being incorporated in the lattice. When the incorporated solvent is wa-ter, the solvate crystals are termed hydrates. Solvate formation, and in particular hydrate formation, is a common phenome-non1,2. About a third of all organic molecules are able to form hydrates and solvates3-5, an example exhibiting extreme prom-iscuity being the antibacterial sulfathiazole for which over a hundred solvates have been characterised6. Solvates can exhibit markedly different physicochemical properties relative to the corresponding anhydrous forms, which include melting point, solubility, crystal habit, and mechanical properties. In the phar-maceutical industry, the choice of whether the form of the ac-tive substance is a solvate or anhydrous can affect its bioavail-ability and the ease (or otherwise) of manufacturing the product, as well as its stability7. Hydrate formation is also an issue in the petroleum industry where it can cause blockage of gas pipe-lines8. There are also other hugely-beneficial potential applica-tions ranging from hydrogen and natural gas storage to atmos-pheric carbon dioxide capture9-12.
Despite this extensive interest, the fundamental question of why some molecules form solvates remains an open problem. The thermodynamic perspective is that the solvated forms of these molecules have a lower free energy, but this is not insight-ful and begs the question why do they have a lower free energy? The thermodynamics approach is exemplified by studies com-paring the potential energies (as approximations for free ener-gies) of the various forms with a view to rationalising why a particular molecule forms a hydrate whilst a related one does
not13-15. While these methods offer some predictive capability, they inform us only about the system of interest, rather than re-vealing broader insights. An alternative approach that addresses the posed question somewhat better has attempted to link mo-lecular features to propensity for hydrate formation. A series of surveys of the Cambridge Structural Database (CSD) have re-vealed a strong correlation with the polar surface area and de-gree of branching within a molecule and with an increased num-ber of polar functional groups (such as carbonyl (C=O), ether (C–O–C), hydroxyl (O–H) and primary amine (N–H))16-18. This suggests that a strong affinity for the solvent may be important and yet there are many examples of substances with high solu-bility (i.e. those having a strong interaction with the solvent) that do not form solvates. Further, how does one rationalise hy-drates of hydrophobic molecules e.g. gas hyhy-drates8?
2
In addition to this, there is the difficulty of de-convoluting the effects of molecular packing from the inter-molecular interac-tions.Here we access the phase behaviour of a universe of mole-cules that do and do not form solvates by means of molecular simulation using simple, coarse-grained models of molecules. These simple models strip away the molecular complexity that otherwise obscures the core issue, while enabling modulation of the inter-molecular interactions by design. Thus, we investi-gate the crystallisation behaviour of a series of solute-solvent systems as a function of the affinity and molecule size ratio (packing) between the solute and solvent. We show that solvate formation is promoted when the solute-solvent affinity over-whelms the solute and solvent self-affinities, and that a strong solute-solvent affinity is not a sufficient condition in itself. Solvate formation can also occur for solutes with low-solvent affinity by virtue of the pV component of the Gibbs potential arising from either more efficient packing or high applied pres-sure overcoming the energy penalty.
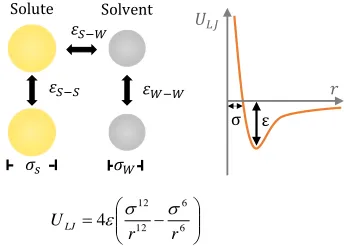
The phase behaviour of the solute-solvent systems was ex-plored using molecular dynamics (MD) simulations. The solute and solvent molecules were represented by simple, single-par-ticle models based on the Lennard Jones (LJ) interaction. Such models are appropriate as solvate formation is a generic phe-nomenon, being observed in a wide class of materials. These models have been successfully employed by us earlier to probe crystal nucleation problems including the identification of de-sign rules for nucleation inhibitors19,20 and for uncovering mo-lecular processes in secondary nucleation21. The LJ model is characterized by two parameters: , the distance at which the interaction potential is zero, which serves as the effective mol-ecule size; and ε, the potential energy well-depth that character-izes the affinity between the molecules (Figure 1). Our choice of LJ parameters for the models was not arbitrary but based on the LJ phase diagram, which is known22. Thus, the chosen sol-vent parameters, 𝜎𝑊−𝑊 = 0.47 nm; 𝜀𝑊−𝑊 = 3.28 kJ mol-1, define a liquid (the solvent) with a melting point of 273 K (correspond-ing to water). The solute phase pack(correspond-ing parameters ranged from 𝜎𝑆−𝑆 = 0.471.47 nm, while the affinity was fixed at 𝜀𝑆−𝑆 = 5.00 kJ mol-1. This chosen solute affinity for 𝜎
𝑆−𝑆 = 0.47 nm defines a solid with a melting point of approximately 421K (an organic solid).
Note that the large affinity-parameter values employed here, up to 𝜀 = 6.0kJ mol-1,are well beyond the typical values char-acterising van der Waals interactions. For comparison, the oxy-gen-oxygen van der Waals interaction for the TIP3P water model is characterised by 𝜀 = 0.6364kJ mol-1 [Jorgensen et al, 1983]. The implication is that the LJ model employed in the study serves as a molecular potential, encapsulating both the weak van der Waals and the stronger Coulombic interactions, albeit not strong formal charges. The LJ model as employed here is used in the widely-employed, coarse-grained MARTINI forcefield[Martini] to represent molecular moieties of up to 4 non-hydrogen atoms e.g. CH2COOH.
Figure 1. The interactions between solute and solvent molecules are characterised by the ε and σ parameters (left) of the Lennard-Jones potential shown plotted as a function of the separation dis-tance r (right).
We investigated the crystallization behaviour of the solute for a universe of solute-solvent systems. The solute-solvent affinity was varied to encompass a range of systems, 𝜀𝑆−𝑊 = 2.5, 3.0, 3.5, 4.0, 4.5, 5.0, 5.5 and 6.0 kJ mol-1, where the higher values characterize systems with stronger affinity between the solute and the solvent. For each solute-solvent pair, we explored the crystallization behaviour of the solute from a series of solutions of ranging solute concentration, 𝑥𝑠𝑜𝑙𝑢𝑡𝑒 = 10, 20, 30, 40, 50, 60, 70, 80, 90, and 100 mol %. The system size in all cases was 10,000 particles. The primary question for analysis was: which product crystallised out, the anhydrous form or the solvate?
RESULTS AND DISCUSSION
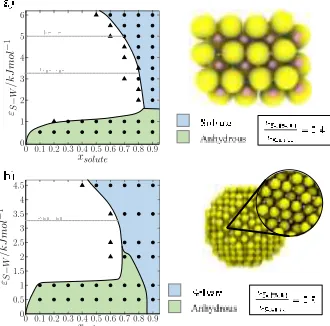
The first set of simulations explored the crystallization be-haviour of solutes for a universe of equal particle-size (𝜎𝑆−𝑆 = 𝜎𝑊−𝑊 = 0.47 nm) solute-solvent systems. The dependency of the crystallisation product on the solute-solvent affinity is shown in the phase diagram in Figure 2. A low solute-solvent affinity 𝜀𝑆−𝑊 implies a low solubility. Consequently, at low so-lute-solvent affinities, the solution becomes supersaturated at low concentrations, limiting the solution region (lower, left re-gion of the plot in Figure 2). At this low solute-solvent affinity the resulting product is the anhydrous structure. As the solute-solvent affinity increases (going up the y-axis in Figure 2), the solubility increases, and the solution region becomes broader.
Solute
Solvent
𝜀
𝑆−𝑆𝜎
𝑠𝜎
𝑊𝜀
𝑊−𝑊𝜀
𝑆−𝑊ε
σ
𝑟
𝑈
𝐿𝐽
4
1212 66r
r
U
LJ [image:2.612.246.418.132.255.2]3
Figure 2. Phase diagram for equal particle-size solute-solvent (𝜎𝑊−𝑊 = 𝜎𝑆−𝑆 = 0.47 nm) systems as a function of solute-solvent affinity 𝜀𝑆−𝑊 and solute concentration 𝑥𝑠𝑜𝑙𝑢𝑡𝑒 at 283K. The phase diagram exhibits 4 distinct regions: solution (white), solvate (blue), anhydrous (green), and anhydrous with some solvent inclusion (or-ange). Each data point on the plot represents a simulation result. Circles mark a crystallisation event (structures shown on the right), while a triangle signifies that the system remained a homogeneous solution. We note that the solvate structure is a lattice but is disor-dered with respect to occupation of the lattice sites. This is ex-pected, since close packing of two distinct but equal-sized particles cannot yield an interpenetrating lattice like that observed for NaCl.
[image:3.612.43.208.389.552.2]At higher solute-solvent affinities (𝜀𝑆−𝑊 > 3.28 kJ mol-1), the solute-solvent affinity surpasses the solvent’s affinity for itself and each solute (solvent) particle shows a greater preference to have a solvent (solute) particle as a neighbour. At an affinity 𝑜𝑓 𝜀𝑆−𝑊 = 4.0 kJ mol-1 and above, the solute and solvent be-comes fully integrated to yield a solvate lattice. At still higher solute-solvent affinities, the solute (solvent) particles attract and order the solvent (solute) particles around themselves to such an extent so as to induce crystallisation of the solvate even at low concentrations. Consequently, the solution region in the phase diagram becomes more limited, with the saturation line tending towards lower concentrations (top, left region of plot in Figure 2). These results suggest that the determining factor for solvate formation is the strength of the solute-solvent interac-tion relative to the solute-solute and the solvent-solvent inter-actions.
Figure 3. Phase diagram for (a) NaCl-type and (b) channel packing type solute-solvent systems as a function of solute-solvent affinity and solute concentration. The blue region indicates solvate for-mation and the green the anhydrous form. Each data point on the graph represents a single simulation. Circles mark a crystallisation event (structure shown on the right), while a triangle signifies that the system remained a homogeneous solution.
In the above simulations, the solute and solvent particles were of equal size. We then considered the effects of packing, wherein we increased the solute particle size from 𝜎𝑆 = 0.47 nm, firstly to 𝜎𝑆 = 1.18 nm, and then to 𝜎𝑆 = 1.47 nm, whilst keeping the solvent size fixed at 𝜎𝑊 = 0.47 nm. For the first of these systems, the particle sizes (𝜎𝑆= 1.18 nm, 𝜎𝑊 = 0.47 nm; sol-vent:solute radii ratio 𝜎𝑊/𝜎𝑆 = 0.40) were chosen to yield a NaCl-type packing23 and indeed this is the observed structure. In the second case, the solute molecules are substantially larger than those of the solvent (𝜎𝑆 = 1.47 nm, 𝜎𝑊 = 0.47 nm, 𝜎𝑊/𝜎𝑆 = 0.32). Both of these systems show a similar behaviour (Figure 3) that in broad terms is not too different from the equal-sized molecules. High solute-solvent affinities (compare top-left of Figures 2 and 3) yield the solvate phase whilst lower solute-solvent affinities yield the anhydrous form. The emergent solv-ates reveal a face-centred lattice for the solute molecules with the solvent molecules either forming an interpenetrating face-centred lattice (the NaCl structure for 𝜎𝑊/𝜎𝑆 = 0.40) or filling the interstitial channels (when 𝜎𝑊/𝜎𝑆 = 0.32) (Figure 3). The latter structures are very similar to the class of non-stoichio-metric channel solvates,3,24, Griesser 2006, Braun et al. where the solvent occupies channels formed within the solute lattice and can freely diffuse out depending on the relative vapour pressure of the solvent (relative humidity for a hydrate) in the environment. Indeed, the solvent particles in these simulated channel-solvates exhibit significant diffusion (diffusion coefficient: ~3.5 – 7.5 x 10⁻⁹ m2 s-1).
For the system yielding the interstitial channels, we also looked closely at the extreme case of a solute with a very low affinity for solvent, 𝜀𝑆−𝑊 = 0.3 kJ mol-1 , i.e. a solvent-phobic solute (see Figure 4). For this system, the solute-solute affinity was increased to 𝜀𝑆−𝑆 = 8.0 kJ mol-1 and we investigated the system at the low molar solute concentration of 1%. The high solute-solute affinity and low molar concentration favoured the formation of a small solute crystallite in the bulk solvent, mak-ing it easier to observe whether the solvent was either included, or excluded from the emergent structure. This system showed phase separation at (ambient) pressure p = 0.001 katm, but yielded a solvate structure at a higher pressure of p = 10 katm. Thus, it is clear that even solvent-phobic solutes can form solv-ates when driven by the pV component of the Gibbs potential
G.
Figure 4. A slice taken from the final structure of the solvent-pho-bic (𝜀𝑆−𝑊 = 0.3 kJ mol-1, 𝜎𝑊/𝜎𝑆 = 0.32) system. (a) At ambient pressure (p = 0.001 katm) the solvent was observed to be excluded from the solute structure, thus favouring the anhydrous form. (b) Increasing the pressure (p = 10 katm) resulted in the solvent filling
[image:3.612.242.413.488.566.2]4
the interstitial channels between solute particles, similar to the be-haviour observed in channel solvates.The above results appear to show that a solvate is always formed when the solute-solvent affinity is strong, but can also form when such affinity is lacking. A limited number of addi-tional simulations were carried out for the equal particle-size system but for which the solute-solute affinity was increased to 𝜀𝑆−𝑆 = 7.0 kJ mol-1 (from 5.0 kJ mol-1) whilst keeping the solute-solvent affinity fixed at 𝜀𝑆−𝑊 = 4.0 kJ mol-1. This would be equivalent to the solid having a higher melting point whilst keeping its interaction with the solvent to be the same. One might expect that a such a system, given the strong solute-sol-vent affinity, would yield a solvate, reproducing the data points for 𝜀𝑆−𝑊 = 4.0 kJ mol-1 in Figure 2. It did not. Instead, we ob-served the anhydrous structure. The inference is that a strong solute-solvent affinity in itself is not a sufficient condition for solvate formation. Rather, the solute-solvent affinity must be sufficient to overwhelm the solute and solvent self-affinities.
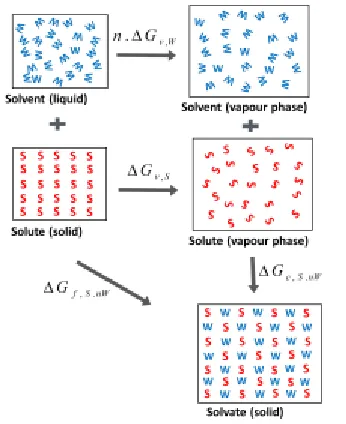
The thermodynamic criteria for solvate formation (see Figure
5) is
W v S v nW S
c G n G
G, . , ,
, where
S v
G,
and
W v
G,
are the molar free energy changes for vaporisation of the solute crystal and the solvent fluid respectively, Gc,S.nWis the molar free energy change associated with crystallization of the solvate from the vapour phase, and the integer n is the num-ber of moles of solvent as reflected in the stoichiometry for the reaction of solute plus solvent yielding a solvate:𝑆 + 𝑛𝑊 → 𝑆 ∙ 𝑛𝑊. For a 0K (potential energy) approximation, the solvate for-mation criteria becomesUc,S.nW
Uv,SnUv,W
whereUc,S.nW is the lattice energy of the solvate form S.n.W,S v U ,
is the lattice energy of the anhydrous form, and
W v U,
[image:4.612.244.417.130.342.2] is the lattice energy of the solvent crystal (as the solvent would be a solid at 0K).
Figure 5. Thermodynamic cycle for the formation of a solvate from the components solute and solvent. Gf,S.nW is the molar free en-ergy change for solvate formation, and Gv,S and Gv,W are the
molar free energy changes for vaporisation of the solute crystal and the solvent fluid respectively.
nW S c
G, .
is the molar free energy change associated with crystallization of the solvate from the va-pour phase, and integer n reflects the stoichiometry 𝑆 + 𝑛𝑊 → 𝑆 ∙ 𝑛𝑊.
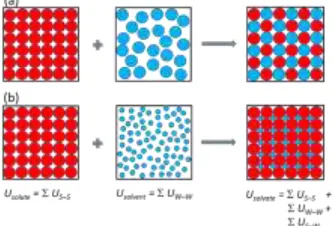
Within the spectrum of molecular interactions and packing ratios characterising solvate formation, one can identify two limiting cases (Figure 6): (a) when there is strong solute-solvent affinity, and (b) when the packing of the solute molecules is essentially independent of the solvent. Expressing the 0K sta-bility criterion, Usolvate < (Usolute + Usolvent), in terms of compo-nent atom-atom interactions yields ( USS(solvate) +
UWW(solvate) + USW(solvate) ) < ( USS(solute) +
UWW(solvent) ). For the equal molecule-size system with
strong solute-solvent affinity, case (a), the dominating interac-tions within the solvate are those between the solute and sol-vent, as each solute (solvent) molecule is surrounded by solvent (solute) particles. The solute-solute and solvent-solvent interac-tions in the solvate are marginal. Consequently, for this case (to a first approximation), the stability criterion reduces to USW
(solvate) < ( USS(solute)+ UWW (solvent) ). For such a
(alt-5
hough the actual interaction is a little weaker, given that the par-ticle separation distance is slightly greater in the liquid state). To form a solvate, the 12 solute-solute and the 12 solvent-sol-vent ‘bonds’ must be broken and be replaced with 12 new so-lute-solvent ‘bonds’, each with an approximate strength of 𝜀𝑆−𝑊. The approximate stability criterion for the Lennard-Jones system then becomes 24𝜀𝑆−𝑊> 12𝜀𝑆−𝑆+ 12𝜀𝑊−𝑊, that is, 2𝜀𝑆−𝑊> 𝜀𝑆−𝑆+ 𝜀𝑊−𝑊. (Note the switch in the inequality oper-ator from less-than to greater-than, since is not the interaction energy but the energy well-depth parameter). Substituting the self-affinity parameters utilised for the solute and solvent, 𝜀𝑊−𝑊 = 3.28 kJ mol-1 and 𝜀𝑆−𝑆 = 5.00 kJ mol-1, the criterion indicates solvate stability above the solute-solvent affinity 𝜀𝑆−𝑊 = 4.1 kJ mol-1. This is entirely consistent with the switch-over point for solvate formation, namely about 4 kJ mol-1, observed in Figure 2.
Figure 6. Two limiting cases of solvate formation, represented schematically: (a) Equal molecule-size system with strong solute-solvent affinity; (b) solvate formation where the solute packing is essentially the same in the anhydrous and solvate forms and inde-pendent of the solvent.
For the limiting case (b) where the solute structure of the an-hydrous form is essentially identical to that in the solvate (as in a non-stoichiometric channel solvate, e.g. the system shown in Figure 3b), USS (solute)USS(solvate) andthe
solvent-sol-vent interaction in the solvate is marginal i.e. UWW (solvate)
0. In this case the stability criterion reduces to USW ( solv-ate) < UWW (solvent), that is, the solute-solvent interaction
must be stronger than the solvent-solvent interaction. This is in-tuitive being akin to the interplay between the cohesive forces of a fluid and the adhesive forces that determine whether, for example, water will wet a nanopore (hydrophilic surface) or bridge it (hydrophobic surface - exploited in high-tech wetwear that is waterproof and yet breathable). This issue is manifested by the low solute-solvent affinity system where the solute is es-sentially solvent-phobic (Figure 4). At low pressures, the sys-tem phase-separates into the anhydrous form and solvent. At the higher pressure of p = 10 katm, the pV component of the Gibbs potential overwhelms the solvent-solvent affinity forcing the solvent into the lattice to form a solvate.
In conclusion, we have shown that the primary criterion for solvate formation is that the solute-solvent affinity must be suf-ficient to overwhelm the solute-solute and solvent-solvent af-finities. A strong solute-solvent affinity in itself is not a suffi-cient condition. Solute molecules even with a low affinity for a solvent can form solvates, provided that the self-affinities of the solute and the solvent are lower in relative terms. Indeed, as demonstrated, essentially solvent-phobic molecules can form solvates when driven by the pV term i.e. under pressure. In going forward, it would be insightful to carry out atomistic lat-tice or free energy calculations on hydrate systems (using e.g. Cambridge Crystallographic Data Centre data and tools), parti-tioning the energy into molecule-molecule (solute-solute, so-lute-solvent, and solvent-solvent) interactions to see how the in-sights ascertained here play out in realistic systems. Finally, we note that whilst the focus of the paper is solvate formation, the inferences are also applicable to co-crystal formation for binary systems25, where the second molecule in the lattice is not the solvent but another solute (solid phase) molecule.
METHODOLOGY
Molecular dynamics simulations were carried out using the DL-POLY 4.06 software package26 in the NPT ensemble using a Nosé-Hoover thermostat and barostat. All simulations were run at 283 K and a pressure of 0.001 katm unless otherwise in-dicated. The interactions (van der Waals) were truncated at 2.5 × 𝜎𝑆. All simulations were run for a minimum of 5 million steps using a 30 fs time step. The mass of all particles was set to 72 g mol-1. System size was 10,000 particles. Initial configu-rations comprised randomised coordinates.
AUTHOR INFORMATION Corresponding Author
* Jamshed Anwar, [email protected]
Funding Sources
EPSRC Doctoral Training Account Case studentship with Astra-Zeneca as industry partner.
ACKNOWLEDGMENT
SB would like thank the EPSRC, Lancaster University, and Astra-Zeneca, for the award of his PhD Case studentship.
REFERENCES
[1] Nangia, A. & Desiraju G.R. Pseudopolymorphism: occurrences
of hydrogen bonding organic solvents in molecular crystals. Chem.
Commun.,7, 605–606 (1999).
[2] Gorbitz, C. H., Hersleth, H-P., On the inclusion of solvent mol-ecules in the crystal structures of organic compounds, Acta Crystallo-graphica Section B Structural Science, Acta Cryst. B56, 526-534 (2000)
[3] Brittain H. G. Polymorphism in Pharmaceutical Solids (Informa
Healthcare, New York, 2009).
[4] Threlfall, T. L. Analysis of organic polymorphs. A review.
Ana-lyst, 120, 2435–2460 (1995).
[5] Stahly, G. P. Diversity in Single- and Multiple-Component Crys-tals. The Search for and Prevalence of Polymorphs and CocrysCrys-tals.
[image:5.612.43.210.284.397.2]6
[6] Bingham, A. L., Hughes, D. S., Hursthouse, M. B., Lancaster, R. W., Tavenerc, S., Threlfall, T. L., Over one hundred solvates of
sul-fathiazole. Chem. Commun., 603–604 (2001)
[7] (a) Khankari, R. K. & Grant, D. J. W. Pharmaceutical hydrates.
Thermochimica Acta, 248, 61–79 (1995); (b) Datta, S., Grant, D. J. W.,
Crystal structures of drugs: advances in determination, prediction and engineering, Nature Review Drug Discovery 3, 42-57 (2004).
[8] E. D. Sloan and C. A. Koh, Clathrate hydrates of natural gases, CRC Press, Boca Raton, FL, 2008.
[9] Herslund, P. J., Thomsen, K., Abildskov, J., von Solms, N. Mod-elling of tetrahydrofuran promoted gas hydrate systems for carbon
di-oxide capture processes. Fluid Phase Equilibria, 375, 45–65 (2014).
[10] Yang, M., Song, Y., Jiang, L., Zhao, Y., Ruan, X., Zhang, Y., Wang, S. Hydrate-based technology for CO2 capture from fossil fuel
power plants. Applied Energy, 116, 26–40 (2014).
[11] Sugahara, T., Haag, J. C., Pinnelli, S. P., Warntjes, A. A., Sloan, E. D., Sum, A. K. Increasing hydrogen storage capacity using
tetrahy-drofuran.. J. Am. Chem. Soc., 131, 14616–14617 (2009).
[12] Sugahara, T., Haag, J. C., Warntjes, A. A., Sloan, E. D., Koh, C. A. Large-Cage Occupancies of Hydrogen in Binary Clathrate
Hy-drates Dependent on Pressures and Guest Concentrations. J. Phys.
Chem. C, 114, 15218–15222 (2010).
[13] Braun, D. E., Karamertzanis, P. G., Price, S. L. Which, if any, hydrates will crystallise? Predicting hydrate formation of two
dihy-droxybenzoic acids. Chem. Comm., 47, 5443–5445 (2011).
[14] Hulme A. T. & Price, S. L. Toward the Prediction of Organic
Hydrate Crystal Structures. J. Chem. Theor. Comput., 3, 1597–1608
(2007).
[15] Cruz-Cabeza, A. J., Day G. M., Jones, W. Towards prediction
of stoichiometry in crystalline multicomponent complexes. Chem.–
Eur. J., 14, 8830–8836 (2008).
[16] Takieddin, K., Khimyak, Y. Z., Fábián, L. Prediction of
Hy-drate and Solvate Formation Using Statistical Models. Cryst. Growth.
Des., 16, 70-81 (2016).
[17] Infantes, L., Chrisholm, J., Motherwell, S. Extended motifs from water and chemical functional groups in organic molecular
crys-tals. CrystEngComm, 5, 480–486 (2003).
[18] Infantes, L., Fabian, L., Motherwell, W. D. S. Organic crystal
hydrates: what are the important factors for formation. CrystEngComm,
9, 65–71 (2007).
[19] Anwar, J., Boateng, P. K. Computer Simulation of
Crystalliza-tion from SoluCrystalliza-tion. J. Am. Chem. Soc., 120, 9600–9604 (1998).
[20] Anwar, J., Boateng, P. K., Tamaki, R. Mode of action and
de-sign rules for additives that modulate crystal nucleation. Angew. Chem.
Int. Ed. Engl., 48, 1596–1600 (2009).
[21] Anwar, J., Khan, S., Lindfors, L. Secondary Crystal Nucleation:
Nuclei Breeding Factory Uncovered. Angew. Chem. Int. Ed., 54,
14681-14684 (2015).
[22] Agrawal, R., Kofke, D. A. Thermodynamic and structural
prop-erties of model systems at solid-fluid coexistence Molecular Physics,
85, 43–59 (1995). Thermodynamic and structural properties of model
systems at solid-fluid coexistence: I. Fcc and bcc soft spheres R Agrawal, DA Kofke, Molecular physics 85 (1), 23-42
[23] Filion, L., Dijkstra, M. Prediction of binary hard-sphere crystal
structures. Phys. Rev. E, 79, 046714-046719 (2009).
[24] Ahlqvist, M. U. A., Taylor, L. S. Water dynamics in channel
hydrates investigated using H/D exchange, International Journal of
Pharmaceutics 241, 253–261 (2002)
[25] Schultheiss, N., Newman, A. Pharmaceutical Cocrystals and
Their Physicochemical Properties. Cryst. Growth Des., 9, 2950-2967
(2009).
[26] Todorov, I. T., Smith, W., Trachenko, K., Dove, M. T. DL_POLY_3: new dimensions in molecular dynamics simulations via
massive parallelism. J. Mat. Chem, 16, 1911–1918 (2006).
Braun, D. E., Koztecki, L. H., McMahon, J. A., Price, S. L., Reutzel-Edens, S. M. Navigating the Waters of Unconventional Crystalline
Hydrates, Mol. Pharmaceutics12, 3069-3088 (2015).
Griesser, U. The importance of solvates, in polymorphism in the pharmaceutical industry, ed. R. Hilfiker, Wiley-VCH, Weinheim, 2006, pp. 211–234.
Jorgensen, W. L., Chandrasekhar, J., Madura, J. D., Impey, R. W., Klein, M. L. Comparison of simple potential functions for simulating
liquid water, Journal of Chemical Physics,79, 926-935 (1983).
Marrink, S. J., Risselada, H. J., Yefimov, S., Tieleman, D. P., de Vries, A. H., The MARTINI force field: coarse grained model for
bio-molecular simulations". The Journal of Physical Chemistry B. 111,