Age-Related Total Gray Matter and White
Matter Changes in Normal Adult Brain.
Part I: Volumetric MR Imaging Analysis
Yulin Ge, Robert I. Grossman, James S. Babb, Marcie L. Rabin, Lois J. Mannon, and Dennis L. Kolson
BACKGROUND AND PURPOSE:A technique of segmenting total gray matter (GM) and total white matter (WM) in human brain is now available. We investigated the effects of age and sex on total fractional GM (%GM) and total fractional WM (%WM) volumes by using volumetric MR imaging in healthy adults.
METHODS:Fifty-four healthy volunteers (22 men, 32 women) aged 20 – 86 years underwent dual-echo fast spin-echo MR imaging. Total GM, total WM, and intracranial space volumes were segmented by using MR image– based computerized semiautomated software. Volumes were normalized as a percentage of intracranial volume (%GM and %WM) to adjust for variations in head size. Age and sex effects were then assessed.
RESULTS: Both %GM and %WM in the intracranial space were significantly less in older subjects (>50 years) than in younger subjects (<50 years) (P< .0001 and P ⴝ .02,
respec-tively). Consistently, %GM decreased linearly with age, beginning in the youngest subjects. %WM decreased in a quadratic fashion, with a greater rate beginning only in adult midlife. Although larger GM volumes were observed in men before adjustments for cranium size, no significant differences in %GM or %WM were observed between the sexes.
CONCLUSION:GM volume loss appears to be a constant, linear function of age throughout adult life, whereas WM volume loss seems to be delayed until middle adult life. Both appear to be independent of sex. Quantitative analysis of %GM and %WM volumes can improve our understanding of brain atrophy due to normal aging; this knowledge may be valuable in distinguishing atrophy of disease patterns from characteristics of the normal aging process.
The quantitative assessment of brain atrophy is be-coming an important consideration in monitoring the clinical outcome and treatment effects in many dis-eases, such as Alzheimer disease, multiple sclerosis, schizophrenia, alcoholism, and AIDS-related demen-tia. The reason is because recent considerable ad-vances in MR imaging and computer technology have allowed the study of brain morphometrics in vivo, which could provide an accurate, reproducible, and quantitative measure for assessing brain atrophy. Age-associated changes in brain tissue measurements
in healthy adults have also been the subject of great interest in recent years, because the determination of normal age-specific values in brain have a role in the evaluation of both clinical-pathologic conditions and normal aging processes. Many investigators examine the age effects on the basis of specific brain regions, such as the corpus callosum (1), hippocampus (2), frontal and temporal lobes (3, 4), and cerebellum (5). The quantitative information from the analyses has shown that age-related brain tissue loss may vary greatly among different brain regions (6) and be-tween the hemispheres (7). These volume measure-ments in brain tissue appear to vary with sex as well (8, 9); this observation indicates that the use of frac-tional measures to correct for population- and sex-related differences in head size is essential.
However, because brain parenchyma is generally composed of gray matter (GM) and white matter (WM), the quantitative analysis of brain atrophy un-derlying separate GM and WM may have implica-tions for our understanding and monitoring of the aging process in the brain. Previous groups have ex-Received October 2, 2001; accepted after revision April 18, 2002.
Supported in part by grant NS29029 from the National Institutes of Health.
From the Departments of Radiology (Y.G., R.I.G., M.L.R., L.J.M.) and Neurology (D.L.K), University of Pennsylvania Med-ical Center, and the Department of Biostatistics (J.S.B), Fox Chase Cancer Center, Philadelphia, PA.
Address reprints requests to Robert I. Grossman, MD, Depart-ment of Radiology, New York University School of Medicine, 550 First Avenue, New York City, NY 10016.
©American Society of Neuroradiology
both anatomically and functionally, and they have different patterns in brain development (19); thus, findings in GM and WM are not necessarily coinci-dent with each other in terms of the timing and extent of tissue loss in brain aging. The purpose of this study was to investigate our hypothesis that GM and WM volumes have different patterns of change that may contribute in different ways to brain atrophy in the normal aging process. To our knowledge, information specifically related to when and how the normalized brain tissue volumes change during aging, which is critical to our understanding of general brain atrophy in elderly people, has not been well addressed (20).
This present study was designed to investigate the effects of age and sex by using fractional measures of total GM and WM volume based on a thin-section (3-mm) standard MR imaging protocol performed in adults with no evidence of neurologic disease.
Methods
Subjects
Fifty-four healthy volunteers (32 women, 22 men; age range, 20–86 years; mean age, 46.8 years⫾19.3) were examined by using our imaging protocols. The mean age of the female subjects (48.3 years⫾19.1) was not significantly different (P⫽ .82) from the mean age of the male subjects (44.7 years⫾19.9). An experienced neurologist (D.L.K.) examined the subjects by using a structured clinical interview to exclude any present or past neuropsychiatric illnesses and abuse of alcohol or illicit drugs. Additionally, a negative history of psychiatric disease in first-degree relatives was required. Physical examination showed normal findings in all participants, and no patient reported a history of any serious medical condition. The num-bers of subjects in each decade were as follows: 13 in the 20–29-year-old group, 10 in the 30–39-year-old group, nine in the 40–49-year-old group, six in the 50–59-year-old group, seven in the 60–69-year-old group, five in the 70–79-year-old group, and four in the 80–89-year-old group. Informed consent was obtained from all volunteers, and the local ethics commit-tee approved the protocol.
MR Imaging
All subjects underwent imaging with a 1.5-T MR unit (Signa; GE Medical Systems, Milwaukee, WI) with a quadrature trans-mit-receive head coil. Whole-brain axial dual-echo fast spin-echo (FSE) images were acquired with a TR/TE1 and TE2/
NEX of 2500/18 and 90/1, a 3-mm section thickness, a 22-cm field of view, and a 192⫻256 matrix. The echo train length was eight, and the pixel size was 0.86 mm. More than 50 sections were obtained in each subject to cover the whole brain. To
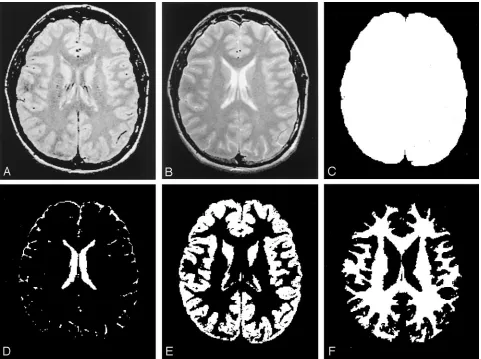
process began with segmentation of the intracranial brain (GM, WM, and CSF) by using the theory of fuzzy connectedness (22). All segmented brain volume images (more than 50 sections in each subject’s brain) were individually reviewed, and an expe-rienced neuroradiologist (Y.G.) excluded any residual ex-tracranial components, if needed. GM, WM, and CSF were each identified as individual three-dimensional fuzzy con-nected objects (Fig 1) according to their “affinity,” “fuzzy adjacency,” and “hanging togetherness” (22). This technique created a volume image by using thin-section dual-echo proton density– and T2-weighted images for GM, WM, and CSF from all sections that covered the whole brain. In repeated studies, the coefficient of variation was shown to be 2.1% for the GM volume, 1.9% for the WM volume, and 1.5% for the CSF volume (23). To normalize for head size variability, the %GM volume and %WM volume were computed as the percentage of the intracranial volume; that is, %GM⫽(GM/intracranial volume)⫻100%.
Statistical Methods
Descriptive statistics, including the mean and standard de-viations of the MR imaging volumetric measures, were calcu-lated and compared in different age and sex groups. Age- and sex-related effects were evaluated with ttests by using a Sat-terthwaite correction for unequal variances. Relationships be-tween age and %GM, as well as age and %WM, were assessed with Pearson product-moment correlations. To determine whether the rate of change in each variable was the same at all ages, least-squares regression was implemented to assess the utility of a prediction model that was a quadratic function of age. If the quadratic term is significant, the rate of change first accelerates and then decelerates over time, or vice versa.
Results
signif-icant difference in the GM/WM ratio was found be-tween the older and younger subject groups.
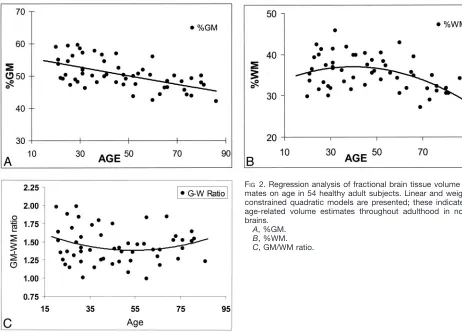
The Pearson product-moment correlation was used to identify age-predictive effects on MR imaging volume measurements, as shown in Table 2. Regardless of sex, the %GM was significantly associated with age (r ⫽ ⫺0.57,P⬍.0001), as was %WM (r⫽ ⫺0.35,P⫽.009), although the correlation between age and %WM was not as strong as that between age and %GM.
Least-squares regression was implemented to as-sess the utility of a model in predicting %WM and %GM as quadratic functions of age. The pattern of changes differed for the two tissues (Fig 2A and B). Specifically, %GM displayed a decline beginning with the youngest subjects, and this change was constant and linear across the span of early to late adulthood. We found that the rate of decline in %GM was not significantly different (P⫽.45) among younger sub-jects (20–49 years) compared with older subsub-jects FIG 1. Segmented images from one section based on various MR images. The normalized volume measure is tissue volume (EorF) relative to the total intracranial volume (C).
A, Original dual-echo FSE proton density–weighted image.
B, T2-weighted MR image.
C, Total intracranial volume image.
D, CSF volume image.
E, GM volume image.
[image:3.587.54.535.60.419.2]F, WM volume image.
TABLE 1: Comparisons of MR imaging volume data in different age groups
Variables
20–49 y 50–86 y
PValues Mean SD Mean SD
[image:3.587.305.534.531.614.2]Intracranial (mL) 1367.3 147.4 1314.8 152.6 .22 GM (mL) 717.8 96.8 626.1 84.3 .001 WM (mL) 499.9 73.7 445.3 56.0 .003 % GM 52.5 4.1 47.6 3.4 ⬍.0001 % WM 36.6 4.0 34.0 3.9 .02 GM/WM 1.5 0.3 1.4 0.2 .54
TABLE 2: Pearson product-moment correlations between age and MR imaging volume data
Variables r P
[image:3.587.55.283.531.631.2](aged 50 years and older). However, %WM demon-strated a quadratic pattern of change, increasing slightly in subjects until the age of approximately 40 years, and it decreased thereafter. The rate of change in %WM was significantly different in subjects younger than 50 years compared with those aged 50 years or older (P⫽
.038). Once %WM began to decline, its rate of decrease was faster (⫺0.2%) than that of %GM (⫺0.09%). The rate of change was not significantly different for either total intracranial volume or the GM/WM ratio (Fig 2C) between the two age groups.
Effects of Sex on MR Imaging Volumes Sex-related differences in MR imaging volume measurements are shown in Table 3. Significant dif-ferences were observed in total absolute intracranial volume and absolute GM volume (Pⱕ.003) between female subjects (1291.5 mL⫾134.9 and 645.9 mL⫾
89.6, respectively) and male subjects (1425.1 mL ⫾
138.3 and 730.6 mL⫾99.3, respectively); differences in absolute WM volume were not significant. How-ever, no significant difference was noted in either %GM or %WM between female and male subjects after the values were normalized for head size, al-though a trend toward slightly higher %WM in fe-male subjects (P⫽ .085) was present. To determine whether the sexes differed in terms of the rate of change in %GM and %WM with age, results of a separate analysis of variance was plotted (Fig 3).
Although %GM decreased with age slightly faster in male subjects than in female subjects, the difference in the rate of change was not statistically significant for either %GM or %WM.
Discussion
In this study, we measured both absolute and frac-tional %GM and %WM volumes in healthy adults aged 20–86 years and evaluated the data by age and sex. The results showed the patterns of age-associated change in GM and WM volumes at a global level. The decline in %GM appears to occur by a relatively young age (age 20 years in our study), and the de-crease is constant and linear. The %WM, in contrast, shows a quadratic pattern of change, slightly
increas-TABLE 3: Comparisons of MR imaging volume data in female and male adults
Variables
Female
Subjects Male Subjects
PValues Mean SD Mean SD
Intracranial (mL) 1291.0 135.0 1425.0 138.0 .001 GM (mL) 645.9 89.6 730.6 99.3 .003 WM (mL) 469.8 73.3 489.1 69.6 .333 % GM 50.0 4.1 51.3 5.0 .302 % WM 36.4 4.0 34.4 4.1 .085 GM/WM 1.4 0.2 1.5 0.3 .078
FIG 2. Regression analysis of fractional brain tissue volume esti-mates on age in 54 healthy adult subjects. Linear and weighted constrained quadratic models are presented; these indicate the age-related volume estimates throughout adulthood in normal brains.
A, %GM.
B, %WM.
[image:4.587.55.517.60.392.2] [image:4.587.306.534.437.547.2]ing until an age of approximately 40 years, then decreas-ing quickly thereafter. These combined changes might explain why cerebral volume remains relatively stable up to the age of 40–50 years (24), when brain atrophy starts, although GM loss occurs much earlier. The ef-fects of sex were not significant in terms of %GM and %WM, although female subjects tended to have slightly higher %WMs, compared with male subjects. The rates of change in %GM and %WM were not statistically different between male and female subjects.
In the present study, we observed no difference in the total intracranial volume between the younger and older groups. This finding indicates that age-dependent changes in cranium size do not occur in healthy adults and that a comparison of the absolute (and fractional) segmented volumes in each tissue subtype in the two age groups is reasonable. In con-trast, we found a significant difference in cranial sizes and GM volumes between the male subjects and fe-male subjects at every age. Apparently, absolute vol-umes should not be used; instead, fractional control-ling volume measures should be used to assess the effects of sex. The difference between male subjects and female subjects was not statistically significant after we controlled for head size by using the %GM. We found a 4.9% difference in %GM between the younger group and the older groups; this observation indicated that a significant age-related GM loss oc-curs with advancing age. Our finding of a linear de-cline in %GM (Fig 2A) that started from the young-est subject age (age 20 years) indicates that the GM degeneration process could begin in the early stage of adult life. This idea was also proved in another study by Pfefferbaum et al (24), which was based on seven sections of the brain. Similarly, a recent study by Courchesne et al (20), which involved volumetric MR imaging, revealed that the absolute GM volume in-creased from early childhood (19–33 months) to later childhood (6–9 years) and decreased thereafter. They limited their study to an analysis of the absolute tissue volumes rather than the controlled measures for head size. Furthermore, they focused on brain
develop-ment and offered few data on the normal aging pro-cess. However, the phenomenon of an early decline in GM volume in the healthy aging process is still not well known; this decline may be due to the neuronal and synaptic pruning in the human cortex reorgani-zation period (25) after the neural maturation (ie, neurulation, proliferation, migration). This early re-gression event may be a normal process that may not reflect degeneration, but rather, the elimination of redundant neurons and synaptic connections in early adult life. Our study demonstrated that this decrease in GM volume is linear (as reflected by a global normalized measure) throughout adult life, with no difference in the rates of GM decline. This result is consistent with that of a longitudinal study (26) in which certain regions of brain GM were measured. However, findings from postmortem studies in mid-dle and late adult life (27–29) have suggested that the GM loss (shrinkage) might be correlated with a de-crease in the size of large neurons rather than a notable decrease in the number of neurons.
Although age-related brain tissue loss has often been described as GM loss or cortical atrophy (30), WM loss was also found in normal aging (13, 14). We found that the %WM volume change that occurred with advancing age in adults was not linear but qua-dratic. It showed a slight increase between the ages of 20 and 40 years, and then it decreased until later life (Fig 2B). This finding agrees with the results from other volumetric studies (20, 24, 31) that suggested the WM maturation may continue into the midlife after a large increase from early childhood to adoles-cence. However, the measures of WM volume in those studies were based on regional or non-normal-ized analyses. The incidence of similar findings with the uses of different methods suggests that, relative to the early decrease in GM, WM volume loss occurs relatively late in adulthood in healthy individuals. Com-pared with these other studies (20, 24, 31), our study was more focused on adult brains and involved a normalized global measure that was designed to quantify the total tissue loss and avoid the difficulty in regional brain FIG 3. Regression analysis of fractional volume estimates on age in the brain tissues of healthy male and female subjects. Despite the lack of statistical power, some trends seem to be present.
A, Faster decrease in %GM in male subjects with aging (solid predicted line).
apparent, whereas GM loss is constant and starts from late childhood. Although the biologic mecha-nism of brain maturation in WM expansion to midlife is not fully understood, it is likely associated with continued myelination and axonal growth (25). How-ever, in the elderly, the periventricular hyperintensi-ties in WM have been shown to be unrelated to the total WM volume loss (32). Additional data from diffusion-weighted and magnetization transfer (MT) imaging studies (33, 34) reveal that fractional anisot-ropy and the MT ratio (measures of the integrity of the microstructure) in WM significantly decrease with age. This decrease suggests that WM volume loss may result from these microscopic structural changes, which include myelin and axonal destruction (17, 35, 36), dilatation of perivascular spaces (37, 38), and gliosis (39, 40).
Regarding sex-related differences, despite no dif-ference in the rate of %WM change across ages in male subjects and female subjects, female subjects generally had a higher %WM at every age (Fig 3B); however, this tendency was not statistically significant (P ⫽ .085). Further, a consensus exists regarding a significant sex-related difference in intracranial space and GM volume (8, 41), as determined with absolute size measurements. No sex difference in %GM was observed once GM volume was adjusted for head size. This observation indicates that differences in brain sizes between men and women are primarily attributable to the differences of total GM volume. We also observed a trend toward greater %GM loss in male subjects (Fig 3A) although the difference was not statistically significant, and it was not as large as that of other groups, which showed that the loss of brain tissue in men was greater than that of women (9, 42–45). However, our results were based on the total intracranial %GM and %WM volumes, which may have diluted the sex effects, whereas others’ results were based on absolute values in the whole brain or subregional areas of different lobes.
In our study, the GM/WM ratio changed only slightly within the age range of 20–86 years. No significant effects of either age or sex on the GM/WM ratio were found. This ratio shows that at no period was the volume of WM greater than that of GM. As shown in Figure 2C, the ratio of GM to WM slowly decreased until the age of approximately 50 years and increased slightly thereafter. In the present study,
of this volumetric study of GM and WM suggest that the normal aging process may start with WM loss, which begins at midlife and becomes more profound in later life, as compared with the GM loss.
Several limitations should be noted in the present study. First, this was a cross-sectional study without a direct comparison within subjects. Ideally, a longitu-dinal study over several decades should be per-formed. Second, we excluded subjects with past or present neurologic symptoms but not subjects with some periventricular WM hyperintensities on MR images, a feature common in older adults (47). Thus, this approach may have made the comparison of images in younger subjects and those in older subjects more difficult. However, Guttmann et al (13) demon-strated that no correlation existed between high-signal-intensity foci in WM on MR images and brain volume in healthy adults. Further, these hyperintense spots in the periventricular regions do not distinguish patients with Alzheimer disease from healthy elderly adults; thus, these spots are more likely to be associated with the normal aging process rather than with notable diseased patterns (48). Third, although a quantitative estimation of brain tissue loss in aging can be performed in healthy, living subjects to avoid the fixation artifacts of postmor-tem study, the accuracy of computer-generated segmen-tation of young and older brains may not be the same. This issue needs to be further evaluated.
Conclusion
References
1. Biegon A, Eberling JL, Richardson BC, et al. Human corpus callosum in aging and Alzheimer’s disease: a magnetic resonance
imaging study.Neurobiol Aging1994;15:393–397
2. Giedd JN, Vaituzis AC, Hamburger SD, et al.,Quantitative MRI of the temporal lobe, amygdala, and hippocampus in normal human
development: ages 4 –18 years.J Comp Neuro1996;366:223–230
3. Daigneault S, Braun CMJ, Whitaker HA.Early effects of normal aging on preservative and nonpreservative prefrontal measures.
Dev Neuropsychol1992;8:99–114
4. Convit A, de Leon MJ, Hoptman MJ, Tarshish C, De Santi S, Rusinek H.Age-related changes in brain: I. Magnetic resonance imaging measures of temporal lobe volumes in normal subjects.
Psychiatr Q1995;66:343–355
5. Luft AR, Skalej M, Schulz JB, et al.Patterns of age-related shrink-age in cerebellum and brainstem observed in vivo using
three-dimensional MRI volumetry.Cerebr Cortex1999;9:712–721
6. Coffey CE, Wilkinson WE, Parashos IA, et al.Quantitative cere-bral anatomy of the aging human brain: a cross-sectional study
using magnetic resonance imaging.Neurology1992;42:527–536
7. Miller AK, Alston RL, Corsellis JA.Variation with age in the volumes of grey and white matter in the cerebral hemispheres of man:
mea-surements with an image analyzer.Neuropathol Appl Neurobiol1980;
6:119–132
8. Cowell PE, Turetsky BI, Gur RC, Grossman RI, Shtasel DL, Gur
RE.Sex differences in aging of the human frontal and temporal
lobes.J Neurosci1994;14:4748–4755
9. Xu J, Kobayashi S, Yamaguchi S, Iijima K, Okada K, Yamashita K.
Gender effects on age-related changes in brain structure.Am J
Neuroradiol2000;21:112–118
10. Jernigan TL, Press GA, Hesselink JR. Methods for measuring brain morphologic features on magnetic resonance images:
valida-tion and normal aging.Arch Neurol1990;47:27–32
11. Raz N, Gunning FM, Head D, et al.Selective aging of the human cerebral cortex observed in vivo: differential vulnerability of the
prefrontal gray matter.Cereb Cortex1997;7:268–282
12. Pruessner JC, Collins DL, Pruessner M, Evans AC.Age and gender predict volume decline in the anterior and posterior hippocampus
in early adulthood.J Neurosci2001;21:194–200
13. Guttmann CR, Jolesz F, Kikinis R, Killiary RJ, Moss MB, Sandor T, Albert MS.White matter changes with normal aging.Neurology
1998;50:972–978
14. Meier-Ruge W, Ulrich J, Bruhlmann M, Meier E. Age-related
white matter atrophy in the human brain. Ann N Y Acad Sci
1992;26:260–269
15. Double KL, Kalliday GM, Kril JJ, et al., Topography of brain
atrophy during normal aging and Alzheimer’s disease.Neurobiol
Aging1996;17:513–521
16. DeCarli CD, Murphy G, et al.Lack of age-related differences in
temporal lobe volume of very healthy adults.AJNR Am J
Neurora-diol1994;15:689–696
17. Salat DH, Kaye JA, Janowsky JS.Prefrontal gray and white matter
volumes in healthy aging and Alzheimer disease.Arch Neurol1999;
56:338–344
18. Sullivan EV, Marsh L, Mathalon DH, Lim KO, Pfefferbaum A. Age-related decline in MRI volumes of temporal lobe gray matter
but not hippocampus.Neurobiol Aging1995;16:591–606
19. Giedd JN, Snell JW, Lange N, et al.Quantitative magnetic
reso-nance imaging of human brain development: ages 4 –18. Cereb
Cortex1996;6:551–560
20. Courchesne E, Chisum HJ, Townsend J, et al.Normal brain devel-opment and aging: quantitative analysis at in vivo MR imaging in
healthy volunteers.Radiology2000;216:672–682
21. Udupa JK, Oduhner D, Samaraskera S, et al.3DVIEWNIX: an open, transportable, multidimensional, multimodality,
multipara-metric imaging software system.Proc SPIE1994;2164:58–73
22. Udupa JK, Wei L, Samarasekera S, Miki Y, van Buchem Grossman
RI.Multiple sclerosis lesion quantification using
fuzzy-connected-ness principles.IEEE Trans Med Imaging1997;16:598–609
23. Ge Y, Grossman RI, Udupa JK, Babb JS, Nyul LG, Kolson DL. Brain atrophy in relapsing-remitting multiple sclerosis: a
frac-tional volumetric analysis of gray matter and white matter.
Radi-ology2001;220:606–610
24. Pfefferbaum A, Mathalon DH, Sullivan EV, Rawles JM, Zipusky RB, Lim KO.A quantitative magnetic resonance imaging study of
changes in brain morphology from infancy to late adulthood.Arch
Neurol1994;51:874–887
25. Webb SJ, Monk CS, Nelson CA.Mechanisms of postnatal
neuro-biological development: implications for human development.Dev
Neuropsychol2001;19:147–171
26. Mueller EA, Moore MM, Kerr DC, et al.Brain volume preserved
in healthy elderly through the eleventh decade.Neurology1998;51:
1555–1562
27. Haug H. Are neurons of the human cerebral cortex really lost
during aging? A morphometric evaluation.In: Traber J, Gispen
WH, eds.Senile Dementia of the Alzheimer TypeBerlin,Germay: Springer-Verlag; 1985:150–163
28. Terry RD, Deteresa R, Hansen LA. Neocortical cell counts in
normal human adult aging.Ann Neurol1987;21:530–539
29. Peters A, Morrison JH, Rosene DL, Hyman BT.Feature article: are neurons lost from the primate cerebral cortex during normal
aging?Cereb Cortex1998;8:295–300
30. Kitagaki H, Hirono N, Ishii K, Mori E.Corticobasal degeneration: evaluation of cortical atrophy by means of hemispheric surface
display generated with MR images.Radiology2000;216:31–38
31. Bartzokis G, Beckson M, Lu PH, Nuechterlein KH, Edwards N, Mintz J.Age-related changes in frontal and temporal lobe volumes
in men: a magnetic resonance imaging study.Arch Gen Psychiatry
2001;58:461–465
32. Braffman BH, Zimmerman RA, Trojanowski JQ, Gonatas NK, Hickey WF, Schlaepfer WW. Brain MR: pathologic correlation with gross and histopathology, II: hyperintense foci in the elderly.
Am J Neuroradiol1988;9:629–636
33. Scheltens P, Barkhof F, Leyes D, Wolters EC, Ravid R, Kamphorst
W.Histopathologic correlates of white matter changes on MRI in
Alzheimer’s disease and normal aging.Neurology1995;45:883–888
34. Virta A, Barnett A, Pierpaoli A.Visualizing and characterizing white matter fiber structure and architecture in the human
pyra-midal tract using diffusion tensor MRI.Magn Reson Imaging1999;
17:1121–1133
35. van Swieten JC, van Den Hout JHW, van Ketel BA, Hydra A, Wokke JHJ, van Gijn J.Periventricular lesions in the white matter on
mag-netic resonance imaing in the elderly.Brain1991;114:761–774
36. Sze G, DeArmond S. Brant-Zawadski M, Davis RL, Norman D, Newton TH.Foci of MRI signal (pseudo lesions) anterior to the
frontal horns: histologic correlations of a normal finding.Am J
Neuroradiol1986;7:381–387
37. Fazekas F, Kleinert R, Offenbacher H, et al.Pathologic correlates
of incidental MRI white matter signal hyperintensities.Neurology
1993;43:1683–1689
38. Awad IA, Johnson PC, Spetzler RF, Hodak JA.Incidental subcortical lesions identified on magnetic resonance imaging in the elderly, II:
postmortem pathological correlations.Stroke1986;17:1090–1097
39. Fazekas F, Kleinert R, Offenbacher H, et al. The morphologic correlate of incidental white matter hyperintensities on MR im-ages. Am J Neuroradiol1991;12:915–921
40. Grafton ST, Sumi SM, Stimac GK, Alvord EC. Jr., Shaw CM, Nochilin D.Comparison of postmortem magnetic resonance
imag-ing and neuropathologic findimag-ings in the cerebral white matter.Arch
Neurol1991;48:293–298
41. Hofman PA, Kemerink GJ, Jolles J, Wilmink JT.Quantitative anal-ysis of magnetization transfer images of the brain: effect of closed
head injury, age and sex on white matter.Magn Reson Med1999;42:
803–806
42. Narayana PA, Borthakur A.Effect of radio frequency inhomoge-neity correction on the reproducibility of intra-cranial volumes
using MR image data.Magn Reson Med1995;33:396–400
43. Passe TJ, Rajagopalan P, Tupler LA, Byrum CE, MacFall JR, Krishnan KR. Age and sex effects on brain morphology.Prog Neuropsychopharmacology Biol Psychiatry1997;21:1231–1237 44. Oguro H, Okada K, Yamaguchi S, Kobayashi S.Sex differences in
morphology of the brain stem and cerebellum with normal ageing.
Neuroradiology1998;40:788–792
45. Murphy DG, Decarli C, Mclntosh AR, et al.Sex differences in human brain morphometry and metabolism: an in vivo quantitative magnetic resonance imaging and positron emission tomography study on the
effect of aging.Arch Gen Psychiatry1996;53:585–594
46. Schuff N, Ezekiel F, Gamst AC, et al.Region and tissue differences of
metabolites in normally aged brain using multislice 1H magnetic
resonance spectroscopic imaging.Magn Reson Med2001;45:899–907
47. Autti T, Raininko R, Vanhanen SL, Kallio M, Santavuori P.MRI of the normal brain from early childhood to middle age, II: age dependence of signal intensity changes on T2-weighted images.
Neuroradiology1994;36:649–651
48. Leys D, Soetaert G, Petit H, Fauquette A, Pruvo JP, Steinling M. Periventricular and white matter magnetic resonance imaging hy-perintensities do not differ between Alzheimer’s disease and