ISSN: www.jatit.org E-ISSN:
4248
ARC FLASH IDENTIFICATION FOR SELECTION OF
PERSONAL PROTECTION EQUIPMENT IN THE REAL
INDUSTRIAL POWER SYSTEM USING LEVENBERG
MARQUARDT BACKPROPAGATION
1MARGO PUJIANTARA, 2ANDIKTA DWI HIRLANDA, 3DIMAS OKKY ANGGRIAWAN, 4ANANG TJAHJONO, 5ARDYONO PRIYADI
1Assoc. Prof., Electrial Engineering Department, Institut Teknologi Sepuluh Nopember, Indonesia 2Engineer, Electrical Engineering Department, Pertamina Corporation
3Lecturer, Electrical Engineering Department, Politeknik Elektronika Negeri Surabaya, Indonesia 4Assoc. Prof, Electrical Engineering Department, Politeknik Elektronika Negeri Surabaya, Indonesia
5Asst. Prof, Electrical Engineering Department, Politeknik Elektronika Negeri Surabaya, Indonesia
E-mail: 1[email protected], 3[email protected] ABSTRACT
Arc flash hazard is an important concern for who works on an industrial electrical system. Arc flash hazard incident energy can lead damage to equipment and injury to workers. Therefore, arc flash identification required to determine category of personal protective equipment (PPE) based on NPFA 70E. Calculations of Arc flash hazard incident energy using numerical techniques based on IEEE std. 1584. However, the calculations just determine value of arc flash incident energy. Therefore, in this paper, proposes Levenberg Marquardt Backpropagation (LMBP) for identification of Arc flash. The proposed method applied in HESS Indonesia Corporation. In the simulation result demonstrates that the proposed method presents high accuracy in identification of arc flash for selection of PPE.
Keywords: Arc Flash, personal protective equipment, NPFA 70E, Identification, Levenberg Marquardt Backpropagation
1. INTRODUCTION
The phenomena to hazards associated with arc flash is a topic of significant interest to engineer and scientist. In the industrial power system, the explosion of Arc flash causes damage to equipment and severe injury to anyone who work on an electrical system [1]. The standards and regulations focus on study of arc flash in low and medium voltage especially reducing of arc flash hazard incident energy. NFPA 70E-2004: standard for electrical safety in the workplace [2] and IEEE standard 1584-2002: IEEE for performing arc flash hazard calculation [3] give guidelines to protecting persons who work on electrical system. The value of incident energy obtained by collection of existing test data and the equations presented by NFPA 70E and IEEE 1584.
To be aware the arc flash hazard then required the arc flash hazard analysis. In the many papers have used to arc flash hazard analysis [4]-[9]. Ravel F. Ammerman et al [4], proposed arc flash hazard
incident energy calculations using IEEE 1584 and NFPA 70E. Tom A. Short et al [5], discussed analysis of arc flash on medium voltage distribution with compare of 4 techniques. Gerald T. Homce et al [6], presented arc flash hazard analysis implemented in the mining industry. H. W. Tinsley
et al [7], discuss a technique for arc flash calculations for specific area in the power distribution system. A. C. Parsons et al [8], used simplified ach flash hazard analysis using energy boundary curves to obtain reductions in data collection and analysis time. M. Lang et al [9], presented the result of testing of arc flash event to evaluate effort to prevent arc flash hazard exposures to operators.
4249 applications cause the calculation of arc flash hazard incident energy becomes more complicated and requires a long time.
Artificial intelligence can be used to identification, classification, modelling, control and prediction [10], [11], [12]. it mostly used is supervised neural network [13]. One of supervised neural network is adaptive learning rate and momentum (BPAM) [14], conjugate gradient [15]. These methods have a weakness are accuracy and convergence rate [16]. To increasing accuracy and learning process, levenberg marquardt backpropagation can be used [17]-[18].
Therefore, in this paper, propose to develop arc flash identification to selection of PPE using levenberg marquardt backpropagation (LMBP). The results under different numbers of neurons are compared to obtain the accurate arc flash identification. In this paper, the proposed method implemented in HESS Indonesia Corporation.
2. ARC FLASH INCIDENT ENERGY
CALCULATIONS
The calculation of the incident energy is one of the important parameters of an arc flash hazard analysis. The amount of energy during an arc flash is obtained from this calculation. Incident energy is delivered in J/cm2 (joule) or cal/cm2 (calories). To
obtain the value of incident energy with equations from NFPA 70E and IEEE 1584-2002. The initial steps to get incident energy with using calculations of arc fault. The equations (1) – (3) show calculations to obtain arc fault with voltage under 1000 V.
Arcing Fault calculations
) (lg 00304 , 0 ) (lg 5588 , 0 000526 , 0 0966 , 0 lg 662 , 0 bf bf bf a g I G I V G V I K I l
(1)
Where
Ig = log10
K = - 0.153 for open configurations and -0.097 for box configuration
Ibf = bolted fault current in three phase fault (kA)
V = system voltage (kV)
G = gap between conductors (mm) (table 1) Whereas for system voltage over 1000 V using equation (2) as follow
)
(
983
,
0
00402
,
0
g bfa
g
I
l
I
l
(2)) (
10
Ig Iaa
I
(3)Incident energy calculations
G
I
l
K
K
E
I
g n
1
2
,1
081
g a
0
,
0011
(4)) lg(
10
Enn
E
(5)Where
En= normalized incident energy (J/cm2)
K1 = - 0.792 for open configurations and
-0.555 for box configurations
K2 = 0 for ungrounded system and high resistance
grounder
-0.113 for grounded system
G = gap between conductors (mm) (table 1)
C
fE
nt
D
xxE
610
2
,
0
184
,
4
(6)Where
E = Incident energy (J/cm2)
Cf = calculation factor based on 1 for voltage
system over 1 kV and 1.5 for voltage system below 1 kV
t = duration of arcing fault (second)
D = distance between person with arcing point (mm) (table 2)
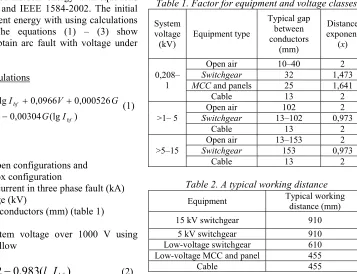
[image:2.612.161.518.454.728.2]x = distance factor (table 1)
Table 1. Factor for equipment and voltage classes
System voltage
(kV) Equipment type
Typical gap between conductors (mm) Distance exponent
(x)
0,208– 1
Open air 10–40 2
Switchgear 32 1,473
MCC and panels 25 1,641
Cable 13 2
>1– 5 Switchgear Open air 13–102 102 0,973 2
Cable 13 2
>5–15 Switchgear Open air 13–153 153 0,973 2
Cable 13 2
Table 2. A typical working distance
Equipment Typical working distance (mm)
15 kV switchgear 910
5 kV switchgear 910
Low-voltage switchgear 610
Low-voltage MCC and panel 455
ISSN: www.jatit.org E-ISSN:
[image:3.612.87.521.69.268.2]
4250
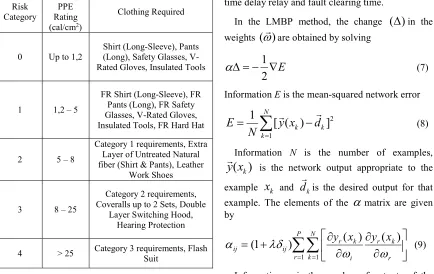
Figure 1. PPE based on hazard category
3. SELECTION OF PERSONAL
PROTECTIVE EQUIPMENT (PPE)
The result of arc flash incident energy calculations can be classified to determine of personal protective equipment, which it applied by anyone who work in the electrical system.
In the table 3, shows PPE based on NFPA 70E-2004. PPE applied suitable for risk category shown by fig. 1.
Table 3. Summary of protective clothing categories
Risk Category
Minimum PPE Rating (cal/cm2)
Clothing Required
0 Up to 1,2 Shirt (Long-Sleeve), Pants (Long), Safety Glasses, V-Rated Gloves, Insulated Tools
1 1,2 – 5
FR Shirt (Long-Sleeve), FR Pants (Long), FR Safety Glasses, V-Rated Gloves, Insulated Tools, FR Hard Hat
2 5 – 8
Category 1 requirements, Extra Layer of Untreated Natural fiber (Shirt & Pants), Leather
Work Shoes
3 8 – 25
Category 2 requirements, Coveralls up to 2 Sets, Double
Layer Switching Hood, Hearing Protection
4 > 25 Category 3 requirements, Flash Suit
4. LEVENBERG MARQUARDT
BACKPROPAGATION
LMBP is used to identification of arc flash for selection of PPE. Hidden layer uses different number of neurons, which used to evaluate performance LMBP. The number of neurons in the hidden layer are 10 neurons and 5 neurons. The number of input neuron into LMBP depends on the data of equipment in the electrical system.
In the paper, data of equipment involve numbers of generators, voltage level, thevenin impedance, time delay relay and fault clearing time.
In the LMBP method, the change
( )
in the weights( )
are obtained by solving1
2
E
(7)Information E is the mean-squared network error
2
1
1
N[ ( )
]
k k
k
E
y x
d
N
(8)Information N is the number of examples,
( )
ky x
is the network output appropriate to the examplex
k andd
k
is the desired output for that example. The elements of the
matrix are given by1 1
( )
( )
(1
)
P N r k r kij ij
r k i r
y x
y x
(9) [image:3.612.89.523.430.704.2]4251
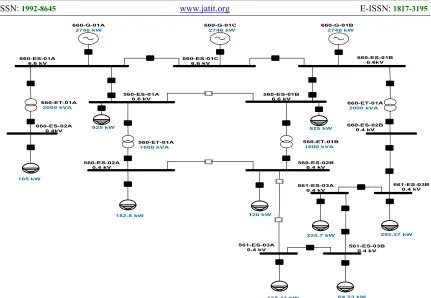
Fig. 2. Single Line Diagram Of Electrical System In The HESS Indonesia Corporation
Generator
Voltage level
Thevenin impedance
Time delay relay
Fault clearing time
Input Layer Hidden Layer Hidden Layer
Output Layer
Arc flash
Fig. 3. Architecture Of 5 Neurons LMBP
5. FLOWCHART OF ARC FLASH
IDENTIFICATION
In this paper, application in the industrial power system is discussed to evaluate arc flash identification for selection of PPE using LMBP. Application is performed in the HESS Indonesia Corporation. Data is obtained from Single line diagram in the electrical system of HESS Indonesia Corporation, which it is shown in the fig. 2. Single
line diagram used to arc flash hazard incident energy calculations. The electrical system of HESS Indonesia Corporation using radial system. The electrical system installed three generators with capacity of 2.746 MW, four transformers to step down with capacity of 2 MW, 1.6 MW, 1.6 MW and 2 MW, respectively. Moreover, there are 9 motor loads and 13 buses. Grounding system of equipment using solid and NGR 50 A.
660-ES-01A
6.6 kV 660-ES-01C 6.6 kV 660-ES-01B 6.6kV
660-ES-02A
0.4kV 660-ES-02B 0.4 kV
560-ES-01A
6.6 kV 560-ES-01B 6.6 kV
560-ES-02A
0.4 kV 560-ES-02B 0.4 kV
661-ES-03A
0.4 kV 661-ES-03B 0.4 kV
925 kW
560-ET-01A
1600 kVA 560-ET-01B1600 kVA
925 kW
660-ET-01A
2000 kVA 660-ET-01A2000 kVA
561-ES-03A
0.4 kV 561-ES-03B 0.4 kV
165 kW
182.8 kW 120 kW
225.7 kW 295.27 kW
138.43 kW 64.23 kW
[image:4.612.98.515.399.554.2]ISSN: www.jatit.org E-ISSN:
4252
Start
Modelling of Single line diagram
Arc Flash Incident Energy Calculations
Taking of Data
Training of LMBP
Testing of LMBP
Analysis for Arc flash Identification
Result Check
Yes
No
[image:5.612.89.489.65.389.2]End Selection of Personal Protective Equipment
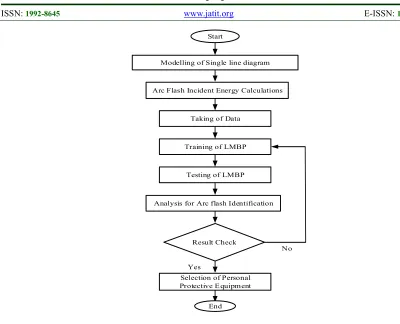
Fig. 4. Flow Chart Of The Proposed Algorithm
Data is obtained in form of numbers of generators, voltage level, thevenin impedance, time delay relay and fault clearing time, which they are used as input of LMBP. Whereas, arc flash used as output of LMBP. The architecture of 5 neurons LMBP is shown by fig. 3. LMBP is simulated by different numbers of neurons to evaluate the performance of LMBP. In the table 4, demonstrate example of data for training of LMBP.
The results of LMBP to arc flash identification used to selection of PPE. In the fig. 4, show the complete flow chart of the proposed algorithm.
6. SIMULATION RESULT AND ANALYSIS
Application in the electrical system of HESS Indonesia corporations used to evaluate arc flash identification using LMBP, which it used to selection of PPE. LMBP is implemented using different numbers of neurons and each case is trained for 100 iterations. LMBP is trained using data from Single line diagram in the electrical system, which it involves numbers of generators, voltage level, Thevenin impedance, time delay relay and fault clearing time. Moreover, for output data is arc flash incident energy. Training of LMBP
using combination input data with matrix 5x336 and output data with matrix 1x336.
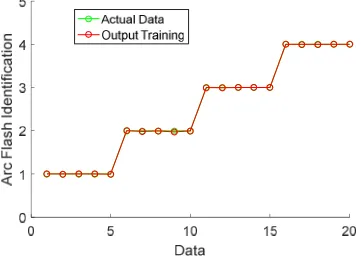
Training of the 5 neurons LMBP has performace of mean square error is 1.32x10⁻⁷, which the result
of training of 5 neurons LMBP is shown by fig. 5. Moreover, Training of the 10 neurons LMBP has performace of mean square error is 6.95x10⁻⁸,
which The result of training of 10 neurons LMBP is shown by fig. 6. The detailed results of arc flash identification are listed in the tables 5 and 6.
4253 Fig. 5. The result of training of 5 neurons LMBP
Ar
c
Fl
as
h
Id
en
tif
ic
at
io
[image:6.612.100.281.259.389.2]n
Fig. 6. The result of training of 5 neurons LMBP
Ar
c
Fl
as
h
Id
en
tif
ic
at
io
[image:6.612.104.285.424.547.2]n
[image:6.612.311.526.512.625.2]Fig. 7. The result of testing of 5 neurons LMBP
Fig. 8. The result of testing of 10 neurons LMBP
Table 4. Example data is used as input of LMBP
Bus
Input
Energy (cal/cm²) Generator kV thev X Time CB FCT
660- ES-01B
1 6,6 2,5 0,1 0,2 1,198
1 6,6 2,5 0,2 0,3 1,704
1 6,6 2,5 0,25 0,35 1,989
1 6,6 2,5 0,3 0,4 2,273
1 6,6 2,5 0,35 0,45 2,557
1 6,6 2,5 0,4 0,5 2,841
1 6,6 2,5 0,45 0,55 3,125
1 6,6 2,5 0,5 0,6 3,409
1 6,6 2,5 0,55 0,65 3,693
1 6,6 2,5 0,6 0,7 3,977
1 6,6 2,5 0,65 0,75 4,261
1 6,6 2,5 0,7 0,8 4,545
Table 5. Identification result for selection of PPE with 5 neurons
Testing Category Err. 1 (%)
Err. Category
2 (%)
Err. Category
3 (%)
Err. Category
4 (%)
1 0.017 0.042 0.017 0.006
2 0.018 0.263 0.008 0.008
3 0.119 0.039 0.077 0.003
4 0.004 0.352 0.001 0.032
5 0.147 0.335 0.006 0.002
Average 0.061 0.206 0.022 0.010
Table 6. Identification result for selection of PPE with 10 neurons
Testing Category 1 Category 2 Category 3 Category 4
1 0.357 0.414 0.009 0.040
2 0.363 0.410 0.096 0.038
3 0.104 0.415 0.119 0.040
4 0.358 0.390 0.009 0.037
5 0.422 1.159 0.009 0.040
Average 0.321 0.558 0.048 0.039
For category 4, the 10 neurons LMBP obtains more accurate results compared by the 5 neurons LMPB with average percentage error is 0.01 % and 0.039 %, respectively.
[image:6.612.103.285.583.711.2]ISSN: www.jatit.org E-ISSN:
4254 average percentage errors of arc flash identification for selection of PPE are less than 1 %, which it demonstrate the proposed algorithm is accurate and encouraging.
The results also demonstrate the average percentage errors of arc flash identification for selection of PPE using LMBP decreases when the number of neurons increases. Therefore, in the industrial power system, arc flash identification for selection of PPE using LMBP can be developed become smart meter to prevent injury to workers.
7. CONCLUSION
In this paper, the proposed algorithm used to arc flash identification for selection of PPE, which it is performed in the industrial power system of HESS Indonesia corporation. To evaluate arc flash identification, the proposed algorithm developed using different numbers of neurons and each case is trained for 100 iterations. The results show that the average percentage errors of arc flash identification for selection of PPE are less than 1 %. Therefore, the proposed algorithm to arc flash identification is accurate and encouraging. Future research focus on develope of real time implementation of smart meter for arc flash identification.
REFERENCES
[1] Gary Z.P.E., Hugh, H., “Arc Flash Hazard Assessment Requirements”, IEEE Rural Electric Power Conference, 2007
[2] Standard for Electrical Safety in the Workplace, NFPA Std. 70E, 2012.
[3] IEEE Guide for Performing Arc-Flash Hazard Calculations, IEEE Std. 1584, Sep. 2002 [4] Ammerman, R.F., Sen, P.K., Nelson, J.P., “Arc
Flash Hazard Incident Energy Calculations A Historical Perspective and Comparative Study of the Standards: IEEE 1587 and NPFA 70E”, IEEE Petroleum and Chemical Industry Technical Conference, 2007
[5] Short, T.A., “Arc Flash Analysis Approaches for Medium-Voltage Distribution”, IEEE Trans. Industry Applications, vol. 47, no.4, Aug. 2011
[6] Homce, G.T., Cawley, J.C., “Understanding and Quantifying Arc Flash Hazards in the Mining Industry”, IEEE Trans. Industry Applications, vol. 47, no. 6., Dec. 2011 [7] Tinsley, H.W., Hodder, M., Graham, A.M.,
“Arc Flash Hazard Calculations”, IEEE
Industry Applications Magazine, Vo. 13, Iss. 1, Feb. 2007
[8] Parsons, A.C., Leuschner,W.B., Jiang, K.X., “Simplified Arc-Flash Hazard Analysis Using Energy Boundary Curves”, IEEE Trans. Industry Applications, vol. 44, no. 6, Dec. 2008 [9] Lang, M., Jones, K., “Exposed to the Arc Flash Hazard”, IEEE Trans. Industry Applications, vol. 51, no. 1., Feb. 2015
[10] A. Tjahjono, D.O. Anggriawan, A. Priyadi, M. Pujiantara, M.H. Purnomo, “Digital Overcurrent Relay with Conventional Curve Modeling Using Levenberg Marquardt Backpropagation”, IEEE International Seminar on Intelligent and Its Applications, 2015 [11] A. Tjahjono, O. A. Qudsi, N. A. Windarko, D.
O. Anggriawan, A. Priyadi, M. H. Purnomo, “Photovoltaic Module and Maximum Power Point Tracking Modelling Using Adaptive Neuro Fuzzy Inference System”, IEEE Makassar International Conference on Electrical Engineering and informatics, 2014 [12] Tjahjono, A., Anggriawan, D.O., Priyadi, A.,
et al.: ‘Overcurrent relay curve modeling and its application in the industrial power systems using adaptive neuro fuzzy inference system’. IEEE Int. Conf. on Computational Intelligence and Virtual Environments for Measurement Systems and Applications, 2015
[13]L.M. Saini, M.K. Soni, “Artificial neural network based peak load forecasting using levenberg-marquardt and quasi-Newton methods” IET Gener. Transm. Distrib., vol. 149, Iss. 5., Sept. 2017
[14] T. P. Vogl et al., “Accelerating the convergence of the backpropagation method,”
Biol. Cybern., vol. 59, pp. 257–263, 1988. [15] S. E. Fahlman, “An empirical study of learning
speed in back-propagation networks,” Carnegie Mellon Univ., Pittsburgh, PA, Tech. Rep. CMU-CS-88-162, Sept. 1988.
[16] B. G. Kermani, S. S. Schiffman., H.T., Nagle., “Performance of the levenberg-marquardt neural network training method in electronic nose applications”, Sensors and Actuators B:Chemical, Vol. 110, Iss. 1, Sept. 2015 [17]I.S. Faradisa, D.O. Anggriawan, T.A. Sardjono,
4255 [18] Sudiharto, I., Anggriawan, D.O., Tjahjono, A.,