Article
1
Evaluation of Workability on Microstructure and
2
Mechanical Property of Modified 9Cr-2W Steel for
3
Fuel Cladding by Cold Drawing Process and
4
Intermediate Heat Treatment Condition
5
Hyeong-Min Heo 1, Jun-Hwhan Kim 2, Sung-Ho Kim 2,
Jong-Ryoul Kim
1,*6
1 Department of Materials Engineering, Hanyang University, 55, Hanyangdaehak-ro, Sangnok-gu, Ansan-si,
7
Republic of Korea
8
2 Advanced Fuel Development Division, KAERI, 989-111 Daedeok-daero, Yuseong-gu, Daejeon, 305-353,
9
Republic of Korea
10
* Correspondence: [email protected]; Tel.:+82-31-400-4279
11
12
Abstract: In this study, we evaluated the cold drawing workability of two kinds of modified
9Cr-13
2W steel containing different contents of boron and nitrogen, depending on the temperature and time
14
of normalizing and tempering treatments. Using ring compression tests at room temperature, the
15
effect of intermediate heat treatment condition on workability was investigated. It was found that the
16
prior austenite grain size can be changed by the austenite transformation, and the grain size increases
17
with increasing temperature during normalizing heat treatment. Alloy B and Alloy N showed
18
different patterns after normalizing heat treatment. Alloy N had higher stress than Alloy B, and the
19
reduction in alloy N increased, while the reduction in alloy B decreased. Alloy B showed a larger
20
number of initially formed cracks and a larger average crack length than Alloy N. Crack length and
21
number increased proportionally in Alloy B as the stress increased. Alloy B had lower crack resistance
22
than Alloy N due to boron segregation.
23
Keywords: intermediate heat treatment; boron; fabrication process
24
25
1. Introduction
26
A Generation IV SFR (sodium-cooled fast reactor) uses liquid sodium as a coolant and creates
27
nuclear fission using fast neutrons [1]. The main components of the SFR are the nuclear fuel
28
assemblies and nuclear fuel cladding. Because irradiation with fast neutrons generates thermal creep
29
and swelling, the nuclear fuel cladding tube needs to provide excellent swelling resistance, creep
30
resistance and high temperature strength for long periods of time. To meet these requirements, the
31
nuclear fuel cladding of sodium cooled fast reactors is typically 9-12% FM (ferritic martensitic) steel,
32
which exhibits outstanding thermal conductivity, a low thermal expansion coefficient, and high
33
resistance to void swelling [2].
34
Nonetheless, 9-12% Cr FM steels have a problem, because their high temperature strength and
35
creep characteristics deteriorate when they are subjected to high temperature for long periods of time.
36
To improve mechanical properties such as creep strength and high temperature strength, the steel’s
37
carbon content can be optimized by the addition of Mo and W, which are solid solution hardening
38
elements, and Nb and V, which are elements that form carbides and nitrides [3]. Boron is also known
39
to reduce the coarsening of M23C6 carbides and decrease minimum creep rate, which improves
40
microstructure stability and improves the creep life of the material [4]. Nitrogen reacts to
41
precipitation hardening elements such as V, Nb, Cr to form fine nitrides (Nb, V)N and Cr2N. These
42
nitrides effectively contribute to the high-temperature creep properties, and improve microstructure
43
stability, due to their extremely high thermal stability [5].
44
In previous studies, nuclear fuel cladding has been fabricated using several procedures. These
45
include VIM (vacuum induction melting), hot working such as hot forging and hot extrusion, and
46
cold working such as cold pilgering, which reduces the thickness and outer diameter by more than
47
90%, and several cold drawing methods with intermediate heat treatment. After fabrication with the
48
desired specifications the manufactured nuclear fuel cladding tube is finally normalized and
49
tempered. Some studies have shown that when boron and nitrogen are added to improve creep
50
characteristics and mechanical properties, the additives also affect the material’s workability,
51
depending on content and heat treatment [6,7].
52
9-12% Cr FM steel was used to conduct a SIMS analysis of the distribution of boron at grain
53
boundaries caused by the effects of normalizing and tempering [8]. Studies on high temperature
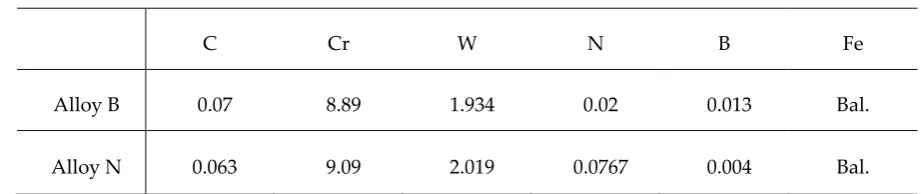
54
ductility were carried out to examine surface cracks and corner cracks which occur during the
55
continuous casting process in boron added steel [9]. Boron has been reported to change its mechanical
56
properties depending on the cooling rate, the heat treatment temperature [10]. These indicate that
57
boron precipitates as compounds such as BN and M23(B, C)6 at grain boundaries, weakening the grain
58
boundary and reducing high temperature ductility [11].
59
In this study, we evaluated the cold drawing workability of two kinds of modified 9Cr-2W steel
60
with different contents of boron and nitrogen, depending on normalizing and tempering temperature
61
and time. Ring compression testing at room temperature was used to investigate the effect of heat
62
treatment on workability.
63
64
2. Materials and Methods
65
The chemical compositions of the two different kinds of modified 9Cr-2W steel, designated
66
Alloy B and Alloy N, are shown in Table 1.
67
68
Table 1 Chemical compositions of the modified 9Cr-2W steels (wt %).
69
70
C Cr W N B Fe
Alloy B 0.07 8.89 1.934 0.02 0.013 Bal.
Alloy N 0.063 9.09 2.019 0.0767 0.004 Bal.
71
The modified 9Cr-2W steel ingot was melted in VIM (vacuum induction melting) and then
hot-72
forged at 1170oC to form rods. The fabricated modified 9Cr-2W steel rods were processed into billets
73
and hot extruded at 1170oC to produce extruded pipes with a 46 mm outer diameter and 3.5 mm
74
thickness. The manufactured mother tube was finally fabricated into a drawn tube with a 19.05 mm
75
outer diameter and 1.15 mm thickness by a cold drawing process.
76
The drawn tubes were sealed in quartz tubes in an atmosphere of argon gas, and then
77
normalized at 1038-1180oC for 6 and 30 min, followed by air cooling to room temperature. A
78
tempering treatment of the normalized specimens was carried out at 760oC for 40 min, followed by
79
air cooling to room temperature. The heat treatment conditions of the modified 9Cr-2W steel are
80
shown in Table 2. In order to observe the microstructure produced by the particular heat treatment
81
condition, the specimens were observed by optical microscope after etching with a mixed solution of
82
HF (hydrofluoric acid): HNO3 (nitric acid): H2O (distilled water) = 2: 3: 95.
83
Table 2 Heat treatment conditions of the modified 9Cr-2W steels.
86
87
Normalizing Tempering
Alloy B
AlloyN
1038oC, 6min
760oC, 40min 1038oC, 30min
1100oC, 6min 1180oC, 6min
X 760oC, 40min
88
In order to evaluate the mechanical properties and workability of the Modified 9Cr-2W steel as
89
a result of the particular heat treatment conditions, ring compression testing was performed at room
90
temperature using an INSTRON-3367.
91
The cold pilgering and cold drawing induce tensile stress in the axial direction, and
92
compressive stress in the circumferential direction. Ring compression tests have also been conducted
93
to evaluate the workability of zirconium alloys after cold pilgering [12]. In this test, compressive stress
94
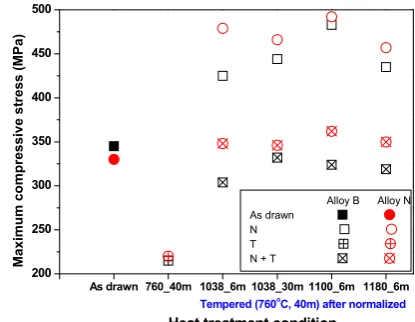
after cold working was evaluated. The compression test specimens were compressed at a rate of 1
95
mm/min for cladding with a 19.05 mm outer diameter and 1.15 mm thickness and 10 mm length. We
96
performed ring compression tests at room temperature based on the heat treatment conditions, and
97
used a stereoscope to observe the shape of cracks produced by the respective heat treatment
98
conditions.
99
In order to investigate the change in hardness produced by the various heat treatment
100
conditions, the Vickers hardness test was performed. The results were measured 12 times for each
101
specimen under a load of 500g, and the minimum and maximum values were excluded, and then
102
standard deviation and mean were evaluated.
103
104
3. Results
105
3.1. Changes in microstructure according to heat treatment conditions
106
Figure 1 and 2 show photographs of Alloy B and Alloy N following heat treatment, respectively.
107
The pilgering and drawing processes created an elongated grain boundary in the drawing direction
108
in the as-drawn specimens.
109
110
111
112
113
114
115
116
Figure 1 Optical micrographs of Alloy B for different heat treatment conditions: (a) as-drawn, (b)
117
normalized at 1038℃ for 30 min, (c) normalized at 1180℃ for 6 min, (d) tempered at 760℃ for 40 min after
as-118
drawn, (e) tempered at 760 for 40 min after normalized at 1038 for 30min℃ and (f) tempered at 760 for 40 min
119
after normalized at 1180 for 6min℃
120
760℃, 40m
As drawn 1038℃, 30m
760℃, 40m after 1038℃, 30m
1180℃, 6m
760℃, 40m after 1180℃, 6m
On the other hand, elongated grain boundary disappears in the normalized condition. (d)
121
indicates the tempering heat condition, after a treatment at 760°C for 40 minutes without a
122
normalizing heat treatment.
123
124
125
126
127
128
129
130
131
132
133
134
135
136
Figure 2 Optical micrographs of Alloy N for different heat treatment conditions: (a) as-drawn, (b)
137
normalized at 1038℃ for 30 min, (c) normalized at 1180℃ for 6 min, (d) tempered at 760℃ for 40 min after
as-138
drawn, (e) tempered at 760 for 40 min after normalized at 1038 for 30min and (f) ℃ tempered at 760 for 40 min
139
after normalized at 1180 for 6min℃
140
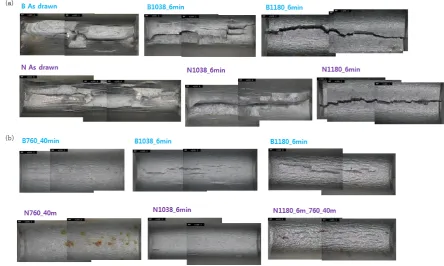
141
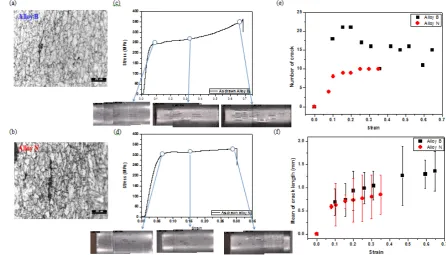
Figure 3 shows the effect on austenite grain size for Alloy B and Alloy N, based on normalizing
142
conditions. In the initial state as-drawn Alloy B and Alloy N have an austenite grain size of 48 and 55
143
㎛, respectively. In particular, at 1180°C the prior austenite grain size increased to more than twice
144
the size of the prior austenite grain at 1038°C.
145
146
147
148
149
150
151
152
153
154
155
156
157
158
159
160
Figure 3 Variation in prior austenite grain size of Alloy B and Alloy N with different normalizing conditions
161
162
3. 2 Effect of heat treatment conditions on mechanical properties
163
Figure 4 shows a specimen (Alloy B) normalized at 1038°C for 6 min. A ring compression test
164
was conducted at room temperature and the results are represented in the schematic diagram. The
165
ring compression test was performed by pressing the sample in the cladding tube with a plate fixed
166
top and bottom, at a constant strain rate. The cladding tube gradually turns into an ellipse, because
167
the applied stress deforms the cladding tube as the axial load on the cladding tube increases. The
168
As drawn
760℃, 40m
(d) (e) (f)
1038℃, 30m 1180℃, 6m
760℃, 40m after 1038℃, 30m 760℃, 40m after 1180℃, 6m
20 40 60 80 100 120 140 160
1180o C_6m 1100oC_6m
1038o C_30m 1038oC_6m
1038oC_6m
P
rior
a
u
stenite gr
ain siz
e (
m)
Normalizing condition (o C)
Alloy B Alloy N
aspects of the cracks at maximum compressive stress were found to be different for the normalizing
169
condition, as compared to the tempering condition. In the normalizing condition, the generated
170
cracks grew and then failed due to interactions, as the stress was increased.
171
172
173
174
175
176
177
178
179
180
181
Figure 4 Stage of ring compression test (1038oC, 6m)
182
183
However, with the tempering condition, many cracks tended to occur, but unlike the normalizing
184
condition case, when the stress increased, the length and width of the cracks increased, but the cracks
185
did not interact with cracks grew and then failed due to interactions, as the stress was increased.
186
Figure 5 shows the results of maximum compressive strength and stiffness for the ring
187
compression testing at room temperature, based on heat treatment conditions. The results for the
as-188
drawn steels show that the maximum compressive stress of alloy B is higher than that of alloy N.
189
Since the prior austenite grain size of alloy N is larger than that of alloy B, the maximum compressive
190
stress of alloy N has a smaller value in the Hall-Petch equation. The stress in alloy N has a higher
191
value than that of alloy B after normalizing.
192
193
(a)194
195
196
197
198
199
200
201
202
203
204
205
206
207
208
209
210
As drawn 760_40m 1038_6m 1038_30m 1100_6m 1180_6m 200
250 300 350 400 450 500
Heat treatment condition Tempered (760o
C, 40m) after normalized Alloy B Alloy N
As drawn
N
T
N + T
Maxi
mum
compressi
ve
st
ress
(M
(b)
211
212
213
214
215
216
217
218
219
220
221
(c)
222
223
224
225
226
227
228
229
Figure 5 Results of ring compression test with heat treatment condition for Alloy B and Alloy N: (a) Maximum
230
compressive stress, (b) stiffness and (c) reduction in height
231
232
Both alloys were normalized by heat treatment, and below 1100°C the prior austenite grain size
233
was less than that of the as-drawn samples. The prior austenite grain sizes increased but higher than
234
the stress of the as-drawn samples after heat treatment above 1100°C.
235
Overall, the stiffness of Alloy N was found to be higher than that of Alloy B, and Alloy N had
236
a constant stiffness after heat treatment. On the other hand, Alloy B exhibited a higher stiffness than
237
that of as-drawn B when it was annealed at 760°C for 40 min.
238
239
240
241
242
243
244
245
246
247
248
249
250
251
252
Figure 6 Results of hardness testing with heat treatment condition for Alloy B and Alloy N
253
As drawn 760_40m 1038-6m 1038-30m 1100_6m 1180_6m 4000
5000 6000 7000 8000 9000
Heat treatment condition
Tempered (760o
C, 40m) after normalized Alloy B Alloy N
As drawn
N
T
N + T
St
if
fn
ess
(N
/m
)
As-drawn 760_40m 1038_6m 1038_30m 1100_6m 1180_6m 30
35 40 45 50 55 60 65 70 75
Alloy B Alloy N
As drawn
N
T
N + T
Re
d
u
ct
ion in h
ei
ght (%)
Heat treatment condition
Tempered (760o
C, 40m) after normalized
As drawn 760_40m 1038_6m 1038_30m 1100_6m 1180_6m 150
200 250 300 350 400 450 500
Tempered (760o
C, 40m) after normalized
Alloy B Alloy N
As drawn
N
T
N + T
H
ar
dness
(H
V)
Normalized specimens of the two alloys were tempered at 760°C for 40 min and had high
254
stiffness. Therefore, Alloy N was determined to have high resistance to deformation in response to
255
an applied force.
256
Comparing the reduction in height of the two alloys, the reduction in height of as-drawn B was
257
higher than that of as-drawn N. The reduction in height of the two alloys was different before and
258
after the normalizing heat treatment. In the case of Alloy B, the reduction in height decreased as the
259
normalizing temperature increased.
260
Figure 6 shows the hardness results based on heat treatment. These results show a tendency
261
similar to that for stress.
262
3. 3 Crack formation and observation
263
Figure 7 shows photographs of cracks and the number and length of cracks for the as-drawn
264
conditions. The crack lengths and the numbers of cracks were compared in order to determine the
265
effect on workability induced by crack resistance during fuel cladding manufacture. Cracks were
266
formed in the Alloy B when stress reached 241MPa, while in alloy N cracks were generated when
267
stress reached 310MPa.
268
269
270
271
272
273
274
275
276
277
278
279
280
281
282
283
284
285
286
287
288
Figure 7Observation of cracks by OM image (a-b), Stress-strain curve and stereo image (c-d), (e) number
289
of cracks depending on strain and (d) mean of crack length depending on strain
290
291
Figure 8 shows cracks that were observed after carrying out compression testing at room
292
temperature, based on heat treatment conditions. Between temperatures of 1038 to 1100°C, multiple
293
cracks were generated when the maximum compressive stress was reached, and when the maximum
294
tensile stress was applied in the longitudinal direction, the existing cracks were connected and
295
formed into a shape like stair steps. As the tensile stress increased in the axial direction in the center
296
part in the specimen at 1180°C, the sample seemed to be fractured by an existing single crack.
297
Multiple cracks existed without connecting in the tempering condition. The tempering heat treatment
298
changed the sample from a martensitic structure with brittleness to a tempered martensitic structure
299
with increasing ductility, and following the transition the cracks were different in appearance.
300
301
303
Figure 8 Observation of cracking with heat treatment (a) normalizing condition and (b) tempering condition
304
(760℃, 40 min after normalizing)
305
306
4. Discussion
307
This study investigated the mechanical properties of cladding tubes fabricated with two types
308
of alloy, Alloy B and Alloy N, and evaluated the effects of normalizing and tempering heat treatments
309
on the workability of the tubes, which is required for manufacturing cladding tube. In Figure 1 and
310
2, as drawn specimen has an elongated grain boundary in the drawing direction due to deformation
311
by drawing and pilgering process. On the other hand, the deformed microstructure was transformed
312
into an austenitic structure by heating at the AC3 transformation point or higher in the normalized
313
condition. The deformed structure disappears due to recrystallization, and forms a lath martensitic
314
structure with a high dislocation density after air cooling [13]. The tempering heat treatment does not
315
cause recrystallization, so some deformed microstructure remains. A typical tempered martensitic
316
structure is produced by the tempering condition after normalizing. There is no recrystallization
317
during the tempering heat treatment, and the strength decreases and the ductility increases due to
318
dislocation recovery, but the previous austenite grain size is not affected [14].
319
The change of prior austenite grain boundary size is related to normalizing temperature. When
320
the as-drawn specimens were normalized at 1038°C, the austenite transformation resulted in
321
recrystallization of the deformed microstructure and an increase in nucleation sites, resulting in
322
smaller grain sizes. At a normalizing temperature above 1100°C, the grain sizes increased because
323
the growth rate of the grain was faster than the rate at which the nucleation sites occurred. As the
324
normalizing temperature increases, compressive stress also increases. During the normalizing heat
325
treatment, carbide is solubilized in the matrix and has a low fraction of precipitate, which increases
326
the stress induced by carbon in the matrix[14]. When the as-drawn conditions were tempered at
327
760°C for 40 min, stress was reduced because the dislocation density decreased, and solute atoms in
328
the matrix precipitated with a high fraction precipitate [14].
329
Stiffness is the rigidity of an object against deformation in response to an applied force. This
330
upon the various physical dimensions which describe that component. For example, for an element
332
in tension or compression, the axial stiffness is
333
334
k = AE L
335
336
where A is the cross section area, E is the (tensile or compression) elastic modulus (or Young’s
337
modulus), and L is the length of the element.
338
Cracks are generated because the stress applied to the material changes elastic regions into
339
plastic regions during ring compression test at room temperature. These are thought to be formed by
340
the accumulation of many small cracks in a direction that is tangential to the inner surface. It appears
341
that more than 10% tensile strain is sufficient to produce the occurrence of cracks [15]. The cracks are
342
generated in the grain boundaries. The grain boundary between boron and steel is known to occur
343
due to equilibrium and non-equilibrium segregation [16]. Equilibrium grain boundary segregation
344
occurs with the movement of solute atoms from the matrix to grain boundaries and free surfaces. The
345
driving force for the equilibrium segregation is the reduction in the grain boundary free energy. NGS
346
(Non-equilibrium grain boundary segregation) occurs during cooling from high temperatures when
347
mobile vacancy-solute complexes diffuse down vacancy gradients towards vacancy sinks [16]. The
348
NGS mechanism depends on the formation of sufficient quantities of vacancy-solute complexes. It
349
has been widely accepted that the NGS of boron in steel is the dominating process [17].
350
Since the vacancy concentration also increases as the normalizing temperature increases, the
351
vacancy-solute complexes increase and the segregation of boron often occurs at the grain boundary.
352
Segregation of boron may weaken the grain boundary bonding force. Therefore, the reduction in
353
height is decreased by the segregation of boron, and it decreases especially sharply at 1180°C. In the
354
case of Alloy N, the reduction in height increased as the normalizing temperature increased. During
355
the normalizing heat treatment, carbide is solubilized in the matrix and has a low fraction of
356
precipitate, which decreases the interaction between carbon and dislocations. As a consequence, the
357
reduction in height increases as the normalizing temperature increases.
358
When as-drawn Alloy B samples were tempered at 760°C for 40 min, the decrease in height
359
reduction was attributed to the segregation of boron. Some studies have analyzed the tempering heat
360
treatment by APT (atom probe tomography). The APT results show that the concentrations of Cr,
361
Mo, V and Mn in the matrix decrease, and then Nb, B and N are depleted from the matrix. It is
362
noteworthy that the M23C6 precipitate at a PAGB contains a very high concentration of boron [8].
363
Segregation were analyzed from the view point of grain boundary characteristics by using EBSD
364
(Electron back scattered diffraction) [18]. It is well known that the segregation is thermodynamically
365
preferential to occur at high energy boundaries such as high angle random boundaries (Prior
366
austenite grain boundary and packet boundary) [19].
367
Comparing the two alloys, a larger number of cracks initially formed in Alloy B, and the cracks
368
had a larger average length than those in Alloy N. The cracks in Alloy B increased proportionally as
369
the stress increased. Alloy B had a lower crack resistance than Alloy N. The reason for the low crack
370
resistance of Alloy B is considered to be weakening of grain boundary due to segregation of excess
371
boron.
372
5. Conclusion
373
This study investigated the mechanical properties of cladding tubes fabricated with two types
374
of alloy, Alloy B and Alloy N, and evaluated the effects of normalizing and tempering heat treatments
375
on the workability of the tubes, which is required for manufacturing cladding tube. The difference in
376
stress of the as-drawn alloys was indicated by the difference in prior austenite grain size. The prior
377
austenite grain size can be changed by the austenite transformation, and the grain size was found to
378
increase with increasing normalizing temperature in the normalizing heat treatment process. The
379
stiffness after heat treatment. On the other hand, Alloy B had a higher stiffness than that of as-drawn
381
B when it was annealed at 760°C for 40 minutes.
382
Normalized specimens of the two alloys were tempered at 760°C for 40 minutes, and exhibited
383
high stiffness. Alloy N was determined to have high resistance to deformation in response to an
384
applied force. Cracks were formed in Alloy B when applied stress reached 241MPa, while cracks in
385
Alloy N were generated when stress reached 310MPa. Comparing the two alloys, Alloy B showed a
386
larger number of initially formed cracks and a larger average crack length, than Alloy N. Cracking in
387
Alloy B increased proportionally as the stress increased, and Alloy B had a lower crack resistance
388
than Alloy N. The reason for the low crack resistance of Alloy B is considered to be weakening of
389
grain boundary due to segregation of excess boron.
390
After tempering treatment, multiple cracks existed, but without connecting. The tempering heat
391
treatment changes the steel from a martensitic structure with brittleness to a tempered martensitic
392
structure with increasing ductility, and following the change the cracks are different in appearance.
393
394
Acknowledgments: This work was done by the ‘SFR Cladding Development Project’ supported by the National
395
Nuclear R&D program through the Sodium-cooled Fast Reactor development Agency funded by Ministry of
396
Science, Ict & Future Planning.
397
398
Author Contributions: J. H. Kim designed the experiments; J. R. Kim contributed to the discussion of the results;
399
H. M. Heo performed the experiments and wrote the paper; S. H. Kim Supervised the project.
400
401
Conflicts of Interest: The authors declare no conflict of interest.
402
403
References