Data Driven Approach for Eye Disease Classification
with Machine Learning
Sadaf Malik1, Nadia Kanwal1,2*, Mamoona Naveed Asghar2, Mohammad Ali A. Sadiq3,4, Irfan Karamat3,4and Martin Fluery5
1 Department of Computer Science, Lahore College for Women University, Lahore,
Pakistan;[email protected]
2 Software Research Institute, Athlone Institute of Technology, Ireland; [email protected], [email protected] 3 Institute of Ophthalmology, Mayo Hospital, King Edward Medical University, Lahore
4 The Eye Associates, 2 Zafar Ali Road, Lahore, [email protected], [email protected] 5 School of Computer Science and Electronic Engineering, University of Essex, UK;
* Correspondence: [email protected]
Abstract:Medical health systems have been concentrating on artificial intelligence techniques for speedy diagnosis. However, the recording of health data in a standard form still requires attention so that machine learning can be more accurate and reliable by considering multiple parameters. The aim of this study is to develop a general framework for recording diagnostic data in an international standard format to facilitate auto-prediction of eye diseases. Efforts were made to ensure error-free data entry by developing a user-friendly interface. Furthermore, different machine learning algorithms were used to analyze patient data based on multiple parameters, including age, illness history, and clinical observations. This data was formatted according to structured hierarchies designed by medical experts, whereas diagnosis was made as per the ICD-10 coding developed by the American Academy of Ophthalmology. Furthermore, the system is designed to evolve through self-learning by adding new classifications for both diagnosis and symptoms. The classification results from tree-based methods demonstrated that the proposed framework performs satisfactorily given a sufficient amount of data. The random forest and decision tree algorithms predicted more accurately as compared to neural networks and the naïve Bayes algorithm owing to structured data arrangement.
Keywords:Machine Learning, Classification, Framework, Eye diseases, ICD codes
1. Introduction
Artificial intelligence (AI) plays an important role in assisting medical experts with early disease diagnosis. There are a large number of AI-based disease detection and classification systems combining medical test results and domain knowledge. However, correlating the actual symptoms and clinical observations with the corresponding diseases is missing in most of these systems. This is perhaps owing to the variety of observation recording methods by medical experts. For example, some use symbols for diagnosis, whereas others give textual description; hence, there is no standard method. Therefore, this data should be manually converted into a standard format so that machines can use it for analysis. This limits the size of data used in any analytical study, which is the main cause of current gaps in human-knowledge-based diagnosis and machine-intelligence-based predictions.
Commonly, ophthalmic diseases are not life threatening; however, progress over time can have significant impact on the patient’s life. Physical examinations are performed using ophthalmological instruments, and a comprehensive interpretation is used for diagnosis. Therefore, any machine-based solution should concurrently consider observations, symptoms, and standardized test results for predictions. Furthermore, the use of a standard description for clinical data and medical test results can be the key to success. The first step toward this is the use of health records in electronic form.
Maintaining patient information as digital data has several potential benefits including rapid retrieval along with timely data transmission among multiple medical experts [1]. Moreover, the use of standard taxonomies for patient data recording can further improve its quality, accuracy, and consistency.
This study focuses on developing a general framework for the standardized recording of patient symptoms and clinical observations, thus assisting medical experts in keeping up with the exponential development of medical knowledge from clinical trials and logical advancements in the field [1]. Similarly, medical cases solved in the past may greatly contribute to the training of machine-learning agents for accurate diagnosis [2]. This is also important because machine-learning algorithms can analyze a large number of parameters required for diagnosis more effectively than humans. Accordingly, intelligent agents, using a carefully designed multi-agent-based classification model, can outperform humans by efficiently analyzing all parameters along with previous information [3].
The rest of the paper is organized as follows. In Section2, existing machine-based solutions for medical diagnosis are briefly described. In Section3, the proposed methods for data modeling and pre-processing are explained, as well as the framework designed for analyzing and predicting eye diseases. In Section4, the results are described, and the paper is concluded in Section5.
2. Related Work
A large amount of research has been conducted on developing medical expert systems to automate diagnostic processes [4–8]. These expert systems can produce accurate responses based on pre-defined rules; however, the use of static rules results in restricted learning, and therefore failure to respond to new situations. With the advancement in machine learning algorithms, the focus shifted toward machine learning through training data. Hence, almost all medical fields are now experiencing rapid growth in machine-based research activities, in particular ophthalmology. A brief review of related work will now be provided.
In [7,9–12], textual and numeric data was used for certain eye problems, namely, dry eye diseases, refractive error, esotropic eyes, and progression in glaucomatous visual field defects. Moreover, probabilistic classifiers such as naïve Bayes and support vector machines were used. In 2011, research on cataract disease was conducted by the Electronic Medical Records and Genomics Network. ICD-9 (International Classification of Diseases) [13] codes and current procedural terminology codes were used for cataract diagnosis in patients without surgery. Furthermore, natural language processing (NLP) and intelligent character recognition (ICR) were the machine-learning techniques used to identify cataract cases and their type. Specifically, written documents were scanned, and after ICR and NLP were performed, they were used in the diagnosis process [14,15]. In 2014, a study was conducted to analyze clinical data for finding the relationship between signs and diagnosis of dry eyes disease [16]. The dataset was obtained from 344 patients, and the analysis was based on independent component analysis (ICA) and Pearson correlations. The highest correlations were found between conjunctiva and corneal staining. Furthermore, each component of the ICA mixing matrix exhibited minimal residual information. Consequently, no consistent relationship was found among the most frequently used signs and symptoms.
Moreover, a number of studies focused on analyzing image data for direct conversion into diagnostic data. The most common disease leading to blindness is glaucoma [17], for which image-based detection was relatively more efficient than for other diseases. In [18–21], algorithms were used for the detection of abnormal retina along with the classification of a normal retina. Furthermore, multiple diagnostic images of the retina were used along with patient clinical records. In [22], a survey of various computer-based ocular disease identification methods was presented. Multilayer perceptron, support vector machines, and linear and quadratic discriminant classifiers were found to be more successful in identifying different eye problems.
intraocular lenses and refractive surgery. EyeView was used to optimize vision quality. Furthermore, computing solutions have been presented for identifying specific eye diseases such as age-related macular degradation [30], for the auto-detection of a diabetic retina [31,32], and for automatic localization of the optic disc using image classification with support vector machines [33].
Moreover, to predict cataract, visual quality was determined using contrast sensitivity [29]. Fageeri et al. [12] diagnosed refractive error based on the spherical, cylindrical, and axis values of wearing glasses. The model was based on decision tree, naïve Bayes, and support vector machine classification algorithms, and used four classes of patients suffering from hyperopia astigmatism, myopia (nearsightedness), myopia astigmatism, and hyperopia (farsightedness). The analysis was conducted using the Waikato environment for knowledge analysis, and the proposed model was used for disease classification and for determining the relationship between symptoms and diagnosis with accuracy up to 98.75%. In [34], a gene network was designed to define disease expression involving the determinants corresponding to nodes.
3. Proposed Methodology
The literature review demonstrated that almost all existing studies are disease based, and thus the algorithms developed or used were tested for specific eye diseases , e.g., glaucoma disease prediction in [9] and refractive error classification in [35]. Accordingly, no general solution is available. This is primarily due to the lack of standardization in recording medical information, a major difficulty that has hindered general automated solutions. A critical challenge in applying machine-learning methods to data obtained by multiple experts is inconsistencies owing to differences in expression style/vocabulary for disease description and diagnosis. Hence, a standardized framework is required to facilitate direct data entry by experts as efficiently as possible, which in turn may facilitate classification, as shown in the results section.
3.1. Data Modeling
To resolve the ambiguity caused by variations in medical language for representing the same concepts, controlled terminologies have been established, ensuring effective communication across health care entities and information systems. These terminologies map synonyms of medical terms to a common concept so that similar objects can be grouped together, thereby providing the infrastructure to support powerful features such as retrospective data analysis, prospective clinical trials, and evidence-based practice [1]. Various standards in medical terminologies are available, such as the 10th version ofInternationalClassification ofDiseases (ICD-10),SystematizedNomenclature ofMedicine,
ClinicalTerms, andMedicalEntitiesDictionary [1].
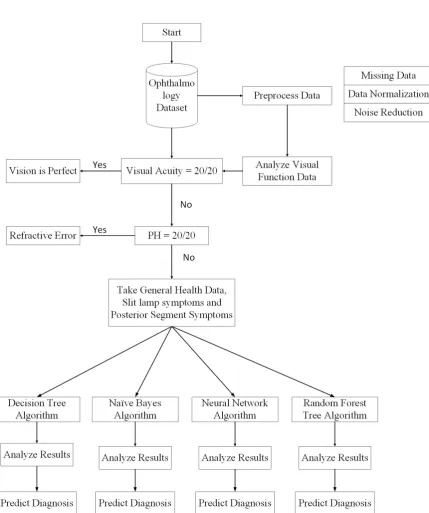
In ophthalmology, multiple factors are considered, such as illness history (including general health information), anterior eye examination (through a slit lamp), and posterior segment examination (through a specialized lens). Therefore, data from slit lamp examination and posterior segment examination are combined for diagnosis, as shown in Figure1. ICD-10 [13] is also based on structured hierarchies for eye-related disease diagnosis. Therefore, these examinations were used for AI-based learning and were arranged in a hierarchical structure similar to the physician decision tree shown in Figure2. After rigorous analysis and discussion with experts, the most suitable hierarchical structures of ICD-10 coding for eye diseases were adopted. Diagnosis consisted of multiple levels, according to the existing eye problem. There were six levels at maximum involved in the definition of any symptom. However, for flexibility, less than six hierarchical levels were required for cases where the disease is at a premature stage. Therefore, in the proposed framework, the definition of a symptom varies according to the situation. An example of a symptom identified from slit examination can be seen below.
Cornea → Endothelium → KPs → Fine → Site → Generalized
Figure 1.Eye disease diagnosis mechanism
Figure 3.Data entry of symptoms through selection: A symptom is added for the cornea of the right eye shown in the sign pane on the right side of the screen; if a symptom cannot be found, “Others" is the option where new symptoms can be added
developed so that the doctor or any other medical expert should click only three times (on average) to select the entire hierarchy of a particular symptom. Figure3shows the definition of a symptom using a graphical user interface. The mouse is pointed to the plus symbol of “Cornea” for either the right or the left eye, and the next level of available options appears as a dropdown menu. When the user further hovers the mouse over “Endothelium” the next level of available options appears. Continuing further, multiple options appear for the final definition of the symptom. Finally, the last option is selected, and all the above levels are concatenated. In the example, when “Generalized” is selected, the complete hierarchy will be displayed.
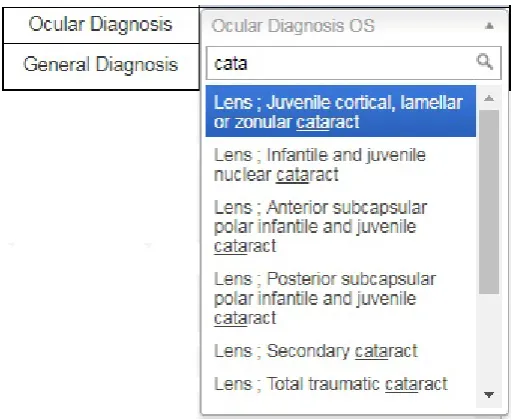
Furthermore, a graphical user interface was also developed for providing a diagnosis in standard format. This is achieved by introducing a search option in the diagnosis dropdown menu because it is difficult to scroll through all available options to reach the required diagnosis. After entering the keywords, the user clicks on the desired diagnosis in a standard format, as shown in Figure4. This approach has the advantage of obtaining the same data format from all users.
Thereby, all the symptoms as well as the diagnosis are stored, providing the foundation for machine learning. Initially, the predicted results are compared with the actual diagnosis by medical experts. As shown in the results section, the predicted results may be as accurate as the expert opinion by increasing the amount of data.
Table 1.Example of data recording in proposed system for a patient. Combined code for symptoms facilitates the fast matching and efficient diagnosis. Blank cells indicate absence of corresponding symptom in particular patient and therefore, represented by zeros in the code.
Categroy
Selected Symptoms
Codes
Sorted codes per category
Lids
Lids ; Swelling ; Site ; Upper
11111
111110-000000-000000-000000-Lid ; Involving Medial Part
000000
Conjunctiva
Conjunctiva ; Discharge;
241
214000-000000-000000-000000-Purulent
000000
Tear Film
Tear Film ; Special tests ;
Marginal tear meniscus ;
3311
320000-331100-000000-000000-<
1 mm Tear file ; Unhealthy
32
000000
Cornea
000000-000000-000000-000000-000000
Anterior
000000-000000-000000-000000-Chamber
000000
Iris
000000-000000-000000-000000-000000
Lens
Lens ; Phakic ; Opacity;
71212
712120-000000-000000-000000-Sub-capsular ; Posterior
000000
Anterior
Viterous
000000-000000-000000-000000-000000
Combined
Code
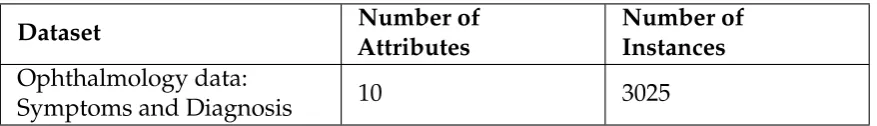
Table 2.Dataset description
Dataset
Number of
Attributes
Number of
Instances
Ophthalmology data:
Symptoms and Diagnosis
10
3025
Data recording does not end there. For machine-learning algorithms, searching is the most important step, and the characters in a symptom are difficult to match efficiently and accurately. Furthermore, the selection order results in false matches. If, for example, lid swelling is selected as the first symptom, followed by three other symptoms, but some other expert selects the symptoms in different order, the machine considers that two separate eye problems are defined. Therefore, symptoms are stored as ordered numeric codes. Table1describes different symptoms and their corresponding codes recorded for a patient. Mathematically, the numbers 452111 and 452 are considered far apart, but in the proposed system, they belong to the same hierarchy and should thus be grouped together. Therefore, to unify coding, zeros are appended to the symptom code so that all codes contain six digits, i.e., 452111 and 452000 for the aforementioned case. The absence of a symptom is represented by six zeros.
3.2. Data Collection and Description
The dataset used in the present study was composed of real-time data on which data mining techniques and classification algorithms were applied. Professional doctors directly recorded the data for research and development, and confidentiality was ensured. Table2shows the size and description of the dataset. There are 10 attributes, namely, age, gender, complaint, VA (left eye), VA (right eye), pinhole (left eye), pin hole (right eye), slit lamp exam, posterior segment exam, and diagnosis. Among these, only age is numeric, whereas all others are nominal, and diagnosis is a class attribute with nominal values.
3.3. Data Pre-processing
In order that machine learning be performed in accordance with medical rules, pre-processing is required that involves data cleaning and normalization, noisy data filtering, and handling of missing values [35]. It is important to mention that data pre-processing highly affects the performance of machine-learning algorithms, and if not performed properly, it may produce biased output [37]. The Weka knowledge analysis tool provides various pre-processing and transformation algorithms.
Feature selection and extraction are aimed at a more robust machine-learning process by identifying and removing irrelevant attributes from the dataset to reduce dimensionality and improve performance. However, ignoring a small symptom may have serious consequences. Fortunately, following standard taxonomies eliminates unnecessary data, and therefore no feature is ignored in analysis and diagnosis.
Missing values may adversely affect machine learning. In this study, two techniques were used for handling missing values, namely, deletion of records with more than 60% missing values, and a two-step diagnostic method using segmentation, which will be explained later.
3.4. Methods
classification algorithms were used, namely, decision tree, random forest, naïve Bayes, and neural networks. The neural network and naïve Bayes algorithms have been reported to be better medical classifiers; however, in this study, the data was stored as a hierarchical structure, and therefore tree-based methods were expected to exhibit better performance.
3.5. Model Description
The proposed model is based on real-time patient data from electronic health records. It uses multiple examinations and analyzes patient records from various perspectives, as medical experts do.
Figure5shows the entire process in detail. Initially, the visual function test is used to start the diagnostic process. If the visual acuity of a patient is observed to be perfect (i.e., measured to be 20/20 or 6/6), then there is no vision problem; however, the patient may have some allergic eye disorders. Thus, the first decision will be made on the basis of visual acuity. If it is not perfect, then the pinhole value is considered. If pinhole vision improves to 20/20 or 6/6 according to selected scales, then the patient will be prescribed glasses, and the diagnosis, according to ICD-10, will be pediatric/strabismus → refractive error. More specifically, the diagnosis will be myopia for nearsightedness and hypermetropia for longsightedness. If pinhole vision is not improved to perfect values, then slit lamp posterior segment examination will be performed to reach a diagnosis. A Java code on the MyEclipse tool was developed that decides on the basis of visual acuity and pinhole values whether the patient requires further investigation or not.
If the problem is not refractive error, then the slit lamp posterior segment examination will facilitate the prediction of the predefined diagnosis class. In this step, missing values are removed from the dataset. If the diagnosis is refractive error, then the anterior and posterior segment examination attributes will remain empty. Therefore, by removing those instances, complete data is passed to the classification module. Thus, after the first step, the data is divided into two parts: one for patients with refractive error, and the other for all other diseases.
Another goal is to add general health data (illness history) as a contributing attribute for automatic disease classification. Accordingly, keyword selection was performed based on frequently presented complaints, such as decreased vision and watering eyes. It was observed that patients do not generally know or understand medical terms; therefore, they always use ordinary words to describe their problem, such as itching, watering, or frequent blinking. Moreover, experts should be aware of other medical conditions, such as diabetes, hypertension, migraine, or uveitis. Therefore, it is more convenient to compile a keyword list of history/health data and store it as the complaint attribute value.
Data from the slit lamp exam is in the form of structured hierarchies written as textual values. The record of a single patient may contain one or multiple symptoms originating in the same or different parts of the eye. To handle this, a multi-label data mechanism is used for arranging multiple symptoms. In addition to symptoms from the slit lamp examination, there is another vital diagnostic test based on symptoms from the posterior eye segment that identifies disorders in macula, retina, or the optic nerve. The machine-learning algorithm will then use the behavior learned from previous records available in the database and compare the current combination of slit lamp/external exam symptoms and posterior segment symptoms with those in the database to give an accurate diagnosis on the basis of all input attributes. Diagnosis is also in the form standard taxonomies defined by ICD-10 and maintained by the World Health Organization. Thereby, machine learning algorithms are used for decision making at various stages, and they use their learning capabilities for the prognosis of eye diseases. Most of the data considered in this study was either in numeric or nominal/textual form.
4. Results
A step-wise decision system generates the classification results presented in Tables3and4. The performance of the classification algorithms was evaluated using several statistical measures, namely, kappa statistics, root mean squared error (RMSE), accuracy, precision, recall, and the area under the curve (AUC) of receiver operating characteristics (ROC) graphs.
Table 3.Camparision of forur different classifires using statistical measures, the results are average of 74 classes (diseases) classification
Test
Decision
Naïve
Random
Neural
Stattistics
Tree
Bayes
Forest
Network
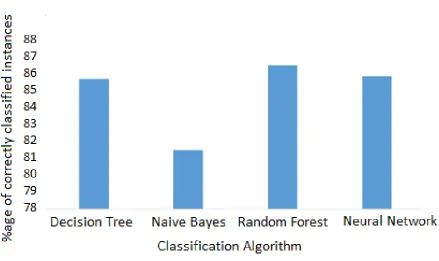
Correctly Classified Instances
85.81%
81.53%
86.63%
85.98%
Incorrectly Classified Instances
14.18%
18.47%
13.36%
14.02%
Kappa Statistics
0.84
0.79
0.85
0.81
Mean Absolute Error
0.029
0.038
0.0233
0.0779
Root Mean Squared Error
0.1204
0.1481
0.106
0.1857
Relative Absolute Error
19.69%
25.80%
15.81%
36.81%
Root Relative Squared Error
44.38%
54.55%
39.05%
57.25%
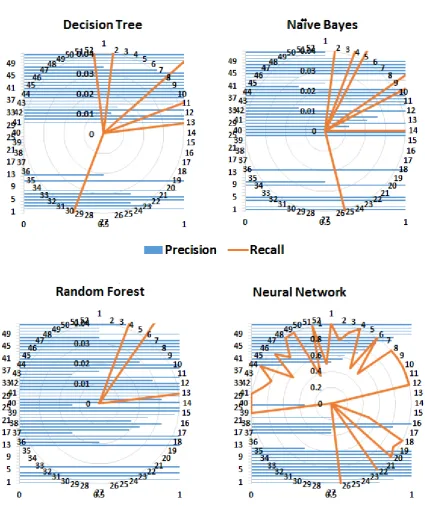
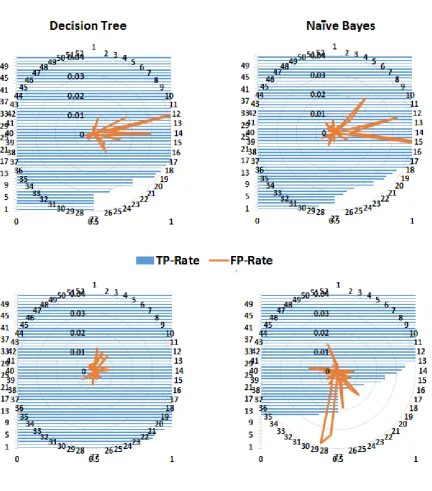
More than one measure are usually considered when classifiers are compared because one measure, e.g., accuracy, considers only correct predictions, whereas others, e.g., RMSE, consider only false predictions. However, some measures consider both correct and false predictions, e.g., precision and recall, but with different proportion. Therefore, most of the commonly used performance measures were considered. As expected, tree-based methods performed better than probability-based methods (Naïve Byes). The kappa statistics demonstrated that both the decision tree and random forest algorithms performed better than the neural network. Similarly, according to the values of precision, recall, and the F-measure, the random forest algorithm performed well. Conventionally, precision, recall, and ROC are considered graphical measures, where curves are drawn to display the performance of an algorithm. For ROC curves, the true positive rate (TPR) is drawn against the false positive rate (FPR). However, to demonstrate the performance of the entire framework for predicting different classes (diseases), these performance measures for each class are shown in Figures6and8. Precision is a measure of relevance, whereas recall is the fraction of retrieved relevant instances over the total number of relevant instances (obtained usually in the range 0—1); therefore, high values for both measures indicate better performance. Similarly, FPR is the fraction of wrong true predictions,
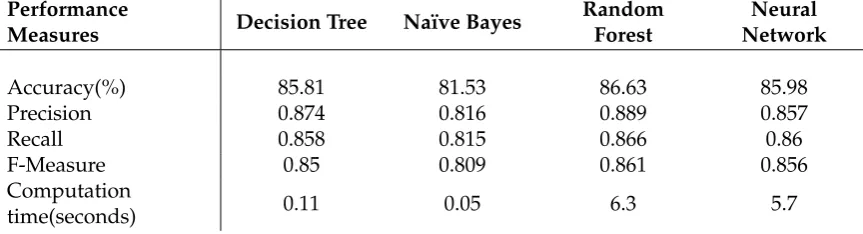
Table 4. Comparison of Classification Algorithms. The measures are average result produced for classifying 74 classes (diseases)
Performance
Measures Decision Tree Naïve Bayes
Random Forest
Neural Network
Accuracy(%) 85.81 81.53 86.63 85.98
Precision 0.874 0.816 0.889 0.857
Recall 0.858 0.815 0.866 0.86
F-Measure 0.85 0.809 0.861 0.856
Computation
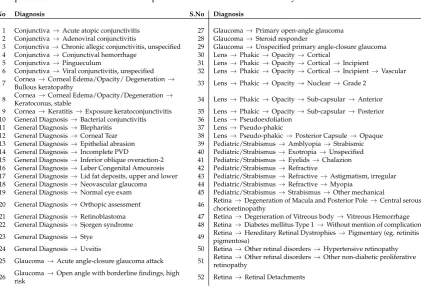
Table 5.52 different diagnosis (classes for classification) for which the data was recorded by medical experts. The list has been sorted in alphabetic order for understandability.
S.No Diagnosis S.No Diagnosis
1 Conjunctiva→Acute atopic conjunctivitis 27 Glaucoma→Primary open-angle glaucoma 2 Conjunctiva→Adenoviral conjunctivitis 28 Glaucoma→Steroid responder
3 Conjunctiva→Chronic allegic conjunctivitis, unspecified 29 Glaucoma→Unspecified primary angle-closure glaucoma 4 Conjunctiva→Conjunctival hemorrhage 30 Lens→Phakic→Opacity→Cortical
5 Conjunctiva→Pingueculum 31 Lens→Phakic→Opacity→Cortical→Incipient
6 Conjunctiva→Viral conjunctivitis, unspecified 32 Lens→Phakic→Opacity→Cortical→Incipient→Vascular 7 Cornea→Corneal Edema/Opacity/ Degeneration→
Bullous keratopathy 33 Lens→Phakic→Opacity→Nuclear→Grade 2
8 Cornea→Corneal Edema/Opacity/Degeneration→
Keratoconus, stable 34 Lens→Phakic→Opacity→Sub-capsular→Anterior 9 Cornea→Keratitis→Exposure keratoconjunctivitis 35 Lens→Phakic→Opacity→Sub-capsular→Posterior 10 General Diagnosis→Bacterial conjunctivitis 36 Lens→Pseudoexfoliation
11 General Diagnosis→Blepharitis 37 Lens→Pseudo-phakic
12 General Diagnosis→Corneal Tear 38 Lens→Pseudo-phakic→Posterior Capsule→Opaque 13 General Diagnosis→Epithelial abrasion 39 Pediatric/Strabismus→Amblyopia→Strabismic 14 General Diagnosis→Incomplete PVD 40 Pediatric/Strabismus→Exotropia→Unspecified 15 General Diagnosis→Inferior oblique overaction-2 41 Pediatric/Strabismus→Eyelids→Chalazion 16 General Diagnosis→Leber Congenital Amourosis 42 Pediatric/Strabismus→Refractive
17 General Diagnosis→Lid fat deposits, upper and lower 43 Pediatric/Strabismus→Refractive→Astigmatism, irregular 18 General Diagnosis→Neovascular glaucoma 44 Pediatric/Strabismus→Refractive→Myopia
19 General Diagnosis→Normal eye exam 45 Pediatric/Strabismus→Strabismus→Other mechanical
20 General Diagnosis→Orthopic assessment 46 Retina→Degeneration of Macula and Posterior Pole→Central serous chorioretinopathy
21 General Diagnosis→Retinoblastoma 47 Retina→Degeneration of Vitreous body→Vitreous Hemorrhage 22 General Diagnosis→Sjorgen syndrome 48 Retina→Diabetes mellitus Type 1→Without mention of complication 23 General Diagnosis→Stye 49 Retina→Hereditary Retinal Dystrophies→Pigmentary (eg. retinitis
pigmentosa)
24 General Diagnosis→Uveitis 50 Retina→Other retinal disorders→Hypertensive retinopathy 25 Glaucoma→Acute angle-closure glaucoma attack 51 Retina→Other retinal disorders→Other non-diabetic proliferative
retinopathy
26 Glaucoma→Open angle with borderline findings, high
risk 52 Retina→Retinal Detachments
and TPR or sensitivity is the fraction of correct classifications (for a classifier). TPR and FPR also range between 0 and 1, and high TPR and low FPR reflect good performance. Figure8shows that the random forest algorithm yields high TPR for more classes (diseases) compared to the decision tree and naïve Bayes algorithms. Although the FPR of the naïve Bayes algorithm has the lowest value, its TPR is also low for a number of classes.
4.1. Hierarchical Prediction Accuracy
In Section3.1, the data modeling was described, in which the diagnosis was also stored in a hierarchical structure, and it was suggested that the classification could be performed at each level. For example, the diagnosis for Keratoconjunctivitis, generated by the system, is as follows:
Cornea → Keratitis → Neurotrophic keratoconjunctivitis
Here “Cornea" represents a first-level diagnosis, “Cornea → Keratitis" represent second-level diagnoses, whereas complete diagnosis will be considered “Cornea → Keratitis → Neurotrophic keratoconjunctivitis". To relate data frequency and to verify system reliability by prediction level, accuracies were calculated. This was important because in case of a rare disease, the system should be able to give a reliable diagnosis.
For example, if machine-learning algorithms are unable to give a complete diagnosis (e.g.,Cornea
→ Keratitis → Neurotrophic keratoconjunctivitis), a second-level diagnosis, namely,Cornea → Keratitis, should be given, or at least a first-level diagnosis, i.e.,Cornea. The advantage of this scheme is that if the system is unable to give a complete diagnosis, then it should at least specify a direction or the part of the eye in which the issue may exist, that is, partial but accurate diagnosis.
Figure 7.Accuracy of classification algorithms
Table 6.Accuracy (%) for classification output at different levels of diagnosis
Diagnosis
Level
Decision Tree
Naïve Bayes
Random
Forest
Neural
Network
Level 1
90.79
87.21
91.57
89.12
Level 2
87.14
84.76
89.82
87.46
Complete
Diagnosis
85.81
81.53
86.63
85.98
low frequency of the data available for complete diagnosis. This demonstrates that the proposed framework is quite effective with data of sufficient frequency.
4.2. Discussion
Table 7.Performance comparison
Reference
Purpose
Performance
[
7
]
Expert system for eye diseases using if-else
rules
positive response from
patients
[
10
]
Pattern recognition in data
sensitivity 89–94% &
specificity 37–42%
[
39
]
classification of liver disease using
unstructured data
accuracy 93.3 %
[
40
]
Heart failure identification using
unstructured data
accuracy 92%
Proposed
method
eye disease classification using structured
data
accuracy 93.5 %
algorithms is significantly higher than that by the random forest and neural network algorithms, but the results are based on only 14 patients’ data. Therefore, reliability is questionable. In the present study, a substantially larger number of classes, hence more data, were considered, as compared to other studies. The comparison of the proposed method with existing solutions (shown in Table7) demonstrated that this framework is capable of predicting eye diseases as accurately as analogous specialized frameworks presented for other medical diagnoses.
The results demonstrated that classification by tree algorithms had better prediction accuracy. This is because data was arranged in hierarchical structure, and therefore the decision tree and random forest algorithms made better predictions using step-by-step analysis of pruned trees. Moreover, tree algorithms had lower error rate than other algorithms. The neural network algorithm also performed well owing to the multiple hidden layers involved. The results by the naïve Bayes classifier were not as good as by the others.
5. Conclusion
A general framework for improved classification of eye diseases was presented. It is based on symptoms recorded in the form of standard taxonomies directly by the medical experts. It can incorporate anterior and posterior segment signs along with general health data to correlate a disease with symptoms. Furthermore, a two-step diagnostic process was designed in which patient data related to refractive error was filtered out before analysis by machine-learning algorithms. Different classification algorithms were used, namely, decision tree, random forest, naïve Bayes, and artificial neural network algorithms. Tree-based methods performed better than the artificial neural network. Furthermore, efficiency and accuracy were demonstrated to be positively correlated with the amount of available data. According to ICD-10 (used for diagnostic data), the highest accuracy was achieved for first-level diagnosis owing to a sufficiently large amount of data followed by second- and third-level diagnosis. Although the random forest algorithm appeared to be better than the artificial neural network, its execution time was slightly longer than that of the decision tree algorithm. However, as computer technology is advancing, this is expected to be resolved in the near future. Finally, the user interface developed for data recording is unique and has been greatly admired for its ease of use.
1. Hwang, J.C.; Alexander, C.Y.; Casper, D.S.; Starren, J.; Cimino, J.J.; Chiang, M.F. Representation of ophthalmology concepts by electronic systems: intercoder agreement among physicians using controlled terminologies. Ophthalmology2006,113, 511–519.
2. Kononenko, I. Machine learning for medical diagnosis: history, state of the art and perspective. Artificial Intelligence in medicine2001,23, 89–109.
3. Huang, M.J.; Chen, M.Y.; Lee, S.C. Integrating data mining with case-based reasoning for chronic diseases prognosis and diagnosis.Expert systems with applications2007,32, 856–867.
4. Saito, K.; Nakano, R. Medical diagnostic expert system based on PDP model. Proceedings of IEEE international conference on neural networks, 1988, pp. 255–262.
5. Liao, S.H. Expert system methodologies and applications—a decade review from 1995 to 2004. Expert systems with applications2005,28, 93–103.
6. Polat, K.; Güne¸s, S. An expert system approach based on principal component analysis and adaptive neuro-fuzzy inference system to diagnosis of diabetes disease. Digital Signal Processing2007,17, 702–710. 7. Naser, S.S.A.; Ola, A.Z.A. AN EXPERT SYSTEM FOR DIAGNOSING EYE DISEASES USING CLIPS.
Journal of Theoretical & Applied Information Technology2008,4.
8. Agrawal, P.; Madaan, V.; Kumar, V. Fuzzy rule-based medical expert system to identify the disorders of eyes, ENT and liver. International Journal of Advanced Intelligence Paradigms2015,7, 352–367.
9. Sample, P.A.; Boden, C.; Zhang, Z.; Pascual, J.; Lee, T.W.; Zangwill, L.M.; Weinreb, R.N.; Crowston, J.G.; Hoffmann, E.M.; Medeiros, F.A.; others. Unsupervised machine learning with independent component analysis to identify areas of progression in glaucomatous visual fields. Investigative ophthalmology & visual science2005,46, 3684–3692.
10. Imberman, S.P.; Ludwig, I.; Zelikovitz, S. Using Decision Trees to Find Patterns in an Ophthalmology Dataset. FLAIRS Conference, 2011.
11. Arbelaez, M.C.; Versaci, F.; Vestri, G.; Barboni, P.; Savini, G. Use of a support vector machine for keratoconus and subclinical keratoconus detection by topographic and tomographic data. Ophthalmology 2012,119, 2231–2238.
12. Fageeri, S.O.; Ahmed, S.M.M.; Almubarak, S.A.; Mu’azu, A.A. Eye refractive error classification using machine learning techniques. Communication, Control, Computing and Electronics Engineering (ICCCCEE), 2017 International Conference on. IEEE, 2017, pp. 1–6.
13. Organization, W.H. Internation Classification of Diseases (ICD).http://www.who.int/classifications/icd/ ICD10Volume2_en_2010.pdf. Accessed: 2017-01-01.
14. Waudby, C.J.; Berg, R.L.; Linneman, J.G.; Rasmussen, L.V.; Peissig, P.L.; Chen, L.; McCarty, C.A. Cataract research using electronic health records. BMC ophthalmology2011,11, 32.
15. Peissig, P.L.; Rasmussen, L.V.; Berg, R.L.; Linneman, J.G.; McCarty, C.A.; Waudby, C.; Chen, L.; Denny, J.C.; Wilke, R.A.; Pathak, J.; others. Importance of multi-modal approaches to effectively identify cataract cases from electronic health records. Journal of the American Medical Informatics Association2012,19, 225–234. 16. Sullivan, B.D.; Crews, L.A.; Messmer, E.M.; Foulks, G.N.; Nichols, K.K.; Baenninger, P.; Geerling, G.;
Figueiredo, F.; Lemp, M.A. Correlations between commonly used objective signs and symptoms for the diagnosis of dry eye disease: clinical implications.Acta ophthalmologica2014,92, 161–166.
17. An, G.; Omodaka, K.; Tsuda, S.; Shiga, Y.; Takada, N.; Kikawa, T.; Nakazawa, T.; Yokota, H.; Akiba, M. Comparison of machine-learning classification models for glaucoma management. Journal of healthcare engineering2018,2018.
18. Quellec, G.; Lamard, M.; Erginay, A.; Chabouis, A.; Massin, P.; Cochener, B.; Cazuguel, G. Automatic detection of referral patients due to retinal pathologies through data mining. Medical image analysis2016,
29, 47–64.
19. Burgansky-Eliash, Z.; Wollstein, G.; Chu, T.; Ramsey, J.D.; Glymour, C.; Noecker, R.J.; Ishikawa, H.; Schuman, J.S. Optical coherence tomography machine learning classifiers for glaucoma detection: a preliminary study.Investigative ophthalmology & visual science2005,46, 4147–4152.
22. Zhang, Z.; Srivastava, R.; Liu, H.; Chen, X.; Duan, L.; Wong, D.W.K.; Kwoh, C.K.; Wong, T.Y.; Liu, J. A survey on computer aided diagnosis for ocular diseases.BMC medical informatics and decision making2014,
14, 80.
23. Chan, K.; Lee, T.W.; Sample, P.A.; Goldbaum, M.H.; Weinreb, R.N.; Sejnowski, T.J. Comparison of machine learning and traditional classifiers in glaucoma diagnosis.IEEE Transactions on Biomedical Engineering2002,
49, 963–974.
24. Bock, R.; Meier, J.; Michelson, G.; Nyul, L.G.; Hornegger, J. Classifying glaucoma with image-based features from fundus photographs. Joint Pattern Recognition Symposium. Springer, 2007, pp. 355–364. 25. Treigys, P.; Šaltenis, V. Neural network as an ophthalmologic disease classifier. Information technology and
control2007,36.
26. Park, S.B.; Sung, K.R.; Kang, S.Y.; Kim, K.R.; Kook, M.S. Comparison of glaucoma diagnostic capabilities of Cirrus HD and Stratus optical coherence tomography. Archives of Ophthalmology2009,127, 1603–1609. 27. Mookiah, M.R.K.; Acharya, U.R.; Lim, C.M.; Petznick, A.; Suri, J.S. Data mining technique for automated
diagnosis of glaucoma using higher order spectra and wavelet energy features.Knowledge-Based Systems 2012,33, 73–82.
28. Nongpiur, M.E.; Haaland, B.A.; Friedman, D.S.; Perera, S.A.; He, M.; Foo, L.L.; Baskaran, M.; Sakata, L.M.; Wong, T.Y.; Aung, T. Classification algorithms based on anterior segment optical coherence tomography measurements for detection of angle closure.Ophthalmology2013,120, 48–54.
29. Ginsburg, A.P. Contrast sensitivity: determining the visual quality and function of cataract, intraocular lenses and refractive surgery.Current opinion in ophthalmology2006,17, 19–26.
30. Brilliant, M.H.; Vaziri, K.; Connor, T.B.; Schwartz, S.G.; Carroll, J.J.; McCarty, C.A.; Schrodi, S.J.; Hebbring, S.J.; Kishor, K.S.; Flynn, H.W.; others. Mining retrospective data for virtual prospective drug repurposing: l-DOPA and age-related macular degeneration.The American journal of medicine2016,129, 292–298. 31. Fadzil, M.A.; Izhar, L.I.; Nugroho, H.; Nugroho, H.A. Analysis of retinal fundus images for grading of
diabetic retinopathy severity. Medical & biological engineering & computing2011,49, 693–700.
32. Osareh, A.; Mirmehdi, M.; Thomas, B.; Markham, R. Automated identification of diabetic retinal exudates in digital colour images. British Journal of Ophthalmology2003,87, 1220–1223.
33. Farooq, U.; Sattar, N.Y. Improved automatic localization of optic disc in Retinal Fundus using image enhancement techniques and SVM. Control System, Computing and Engineering (ICCSCE), 2015 IEEE International Conference on. IEEE, 2015, pp. 532–537.
34. Loscalzo, J.; Kohane, I.; Barabasi, A.L. Human disease classification in the postgenomic era: a complex systems approach to human pathobiology.Molecular systems biology2007,3, 124.
35. Fageeri, S.O.; Ahmed, S.M.M.; Almubarak, S.A.; Mu’azu, A.A. Eye refractive error classification using machine learning techniques. Communication, Control, Computing and Electronics Engineering (ICCCCEE), 2017 International Conference on. IEEE, 2017, pp. 1–6.
36. of Ophthalmology, A.A. ICD-10 Physician Tree. https://www.aao.org/assets/8810b98c-6158-444e-883e-c4629df941d3/635672059826530000/persons-with-diabetes-icd-10-physician-decision-tree-pdf?inline=1. Accessed: 2017-01-01.
37. Bowd, C.; Hao, J.; Tavares, I.M.; Medeiros, F.A.; Zangwill, L.M.; Lee, T.W.; Sample, P.A.; Weinreb, R.N.; Goldbaum, M.H. Bayesian machine learning classifiers for combining structural and functional measurements to classify healthy and glaucomatous eyes. Investigative ophthalmology & visual science2008,
49, 945–953.
38. Chimieski, B.F.; Fagundes, R.D.R. Association and classification data mining algorithms comparison over medical datasets. Journal of health informatics2013,5.
39. Acharya, U.R.; Sree, S.V.; Ribeiro, R.; Krishnamurthi, G.; Marinho, R.T.; Sanches, J.; Suri, J.S. Data mining framework for fatty liver disease classification in ultrasound: a hybrid feature extraction paradigm.Medical physics2012,39, 4255–4264.