Copyright1999 by the Genetics Society of America
Single- and Multiple-Trait Mapping Analysis of Linked Quantitative Trait Loci:
Some Asymptotic Analytical Approximations
Yefim I. Ronin, Abraham B. Korol and Eviatar Nevo
Institute of Evolution, University of Haifa, Haifa 31905, Israel
Manuscript received January 20, 1998 Accepted for publication September 28, 1998
ABSTRACT
Estimating the resolution power of mapping analysis of linked quantitative trait loci (QTL) remains a difficult problem, which has been previously addressed mainly by Monte Carlo simulations. The analytical method of evaluation of the expected LOD developed in this article spreads the “deterministic sampling” approach for the case of two linked QTL for single- and two-trait analysis. Several complicated questions are addressed through this evaluation: the dependence of QTL detection power on the QTL effects, residual correlation between the traits, and the effect of epistatic interaction between the QTL for one or both traits on expected LOD (ELOD), etc. Although this method gives only an asymptotic estimation of ELOD, it allows one to get an approximate assessment of a broad spectrum of mapping situations. A good correspondence was found between the ELODs predicted by the model and LOD values averaged over Monte Carlo simulations.
M
ANY efforts have been devoted to increasing the a complicated problem arising when the considered chromosome contains several QTL (e.g., Jiang and efficiency of marker analysis of quantitative traits,Zeng1995;Korolet al. 1998). If one tries to fit a single-including interval analysis (LanderandBotstein1989;
locus model to such a case, a ghost QTL can be detected KnottandHaley1992), selective sampling (Lebowitz
in an interval that has no effect on the trait (Knott
et al. 1987; Darvasi andSoller 1992, 1994; Weller
and Haley 1992; Martinez and Curnow 1992;
et al. 1997), replicated progeny testing (Soller and
WrightandKong1997). Especially difficult are
situa-Beckmann 1990), and sequential experimentation
tions with trans effects of linked QTL (Knott and (BoehnkeandMoll1989;MotroandSoller1993).
Haley1992;LuoandKearsey1992). That trans-associ-Recently, a general method to improve the efficiency
ation of QTL could be a common phenomenon even of quantitative trait loci (QTL) mapping was proposed
in interspecific crosses has been demonstrated by by taking into account simultaneous segregation at
DeVicenteandTanksley(1993) in tomato: they found many genomic segments that affect the trait in question
that up to 36% of the detected QTL had alleles with (Jansen and Stam 1994; Zeng 1994). A situation in
effects opposite to the direction expected from the pa-which one QTL (or a chromosome segment) affects
rental differences. several traits simultaneously can also be considered to
The usual way of dealing with several linked QTL is result in increased power (Korolet al. 1987, 1994, 1995,
multiple regression analysis or mixture model analysis 1998; Jiangand Zeng 1995; Ronin et al. 1995; Zeng
that includes markers as regression cofactors to account 1997). Such an analysis may be important in
marker-for segregation of QTL of the same chromosome ( Jan-assisted breeding strategies, dissecting heterosis as a
sen andStam1994;Zeng1994). The third possibility multilocus multitrait phenomenon, developing
opti-is to construct two- to three-interval mixture models, mized programs for evaluation and bioconservation of
although this approach is rather cumbersome and genetic resources, and revealing genetic architecture of
needs intensive calculations. Employing Monte Carlo fitness systems in natural populations, etc. Multiple-trait
simulations with mixture models, we demonstrated re-mapping analysis proved to be very useful within the
cently the advantage of multiple trait analysis in detec-framework of the selective genotyping design (Weller
tion of linked QTL effects (Korol et al. 1998). The et al. 1997;Roninet al. 1998).
goal of this article is to elaborate an analytical model The multiple-trait approach may help in coping with
enabling us to evaluate in a general form the expected LOD values in cases of two linked QTL. Such a model can be used as a tool to predict the expected resolution Corresponding author: A. B. Korol, Institute of Evolution, University
in different complicated situations. As a practical appli-of Haifa, Mt. Carmel, Haifa 31905, Israel.
E-mail: [email protected] cation one can consider the possibility of calculating
the minimum sample size needed to detect linked QTL with certain effects on either of the correlated quantita-tive traits or to prove the existence of epistasis for any of the traits. Likewise, the proposed analysis allows us to predict situations where a ghost QTL will be detected using interval analysis and to evaluate the minimum marker density needed to prevent such a possibility for given effects of the linked QTL. Recently, a similar tech-nique, referred to as “deterministic sampling,” was ap-plied to single-QTL situations in single-trait analysis, with the expected LOD values calculated numerically (MackinnonandWeller1995;Mackinnonet al. 1996;
Wright and Kong 1997). Our major target here is analytical and numerical deterministic sampling for
two-Clearly, situations (d) and (e) are equivalent (up to trait analysis with linked QTL. We first treat the case of parameter replacement) to (b) and (a), respectively. a single-trait analysis and then generalize the results for Our intention is to evaluate how misspecification of the two-trait analysis. The consideration will be based on the model (assumption of one QTL when actually two a modification of the maximum-likelihood technique
linked QTL reside on the chromosome) affects the pa-relevant to asymptotic properties of the LOD test, which rameter estimation. This is done by scanning across a will be referred to as “regression of the log-likelihood large number of markers, so that besides situations (a), function.” For the case of single-marker analysis this (c), and (e), one could also encounter situations close modification is equivalent to the usual procedure of to those of (b) and (d). Moreover, in all of the cases expected LOD (ELOD) calculation (LanderandBot- we assume that the trial marker exactly coincides with stein1989) with the only difference that it is a function the putative (single) QTL. Due to the foregoing assump-of the variable position assump-of marker. tions, the true expected densities of the trait distribution
in the alternative marker groups for an arbitrary marker will be
SINGLE-TRAIT ANALYSIS
hMM(x)5 h15 a1f11(x)1 a2f12(x)1 b2f21(x)1 b1f22(x), The major target of our analysis is analytical and
nu-hmm(x)5 h25 b1f11(x)1 b2f12(x)1 a2f21(x)1 a1f22(x), merical deterministic sampling with linked QTL.
There-fore, analytical expression of ELOD should be obtained
where in case that allows us to compare H2(two linked QTL) and H1
(single QTL) for any set of parameter values.
Single-QTL models: Let a trait x be dependent on two linked loci Q1/q1and Q2/q2and let the trait values in the four QTL groups Q1Q1Q2Q2, Q1Q1q2q2, q1q1Q2Q2, and q1q1q2q2of a mapping population have normal densities f11(x), f12(x), f21(x), and f22(x) with (unknown) means
m*11, m*12, m*21, and m*22 and standard deviations s*11, s*12,
(a) a15 (12r1)(12 r), a25(12 r1)r,
b15 r1(12 r), b25r1r, (b) a15 12 r, a25r,
b15 0, b250,
(c) a15 (12r1)(12 r2), a25(12 r1)r2,
b15 r1r2, b25r1(1 2r2),
(d) a15 12 r, a250,
b15 0, b25r,
(e) a15 (12r)(12r2), a25rr2,
b15 (12r)r2, b25r(12 r2).
s*21, and s*22, respectively. Usually, the mapping proce-dure is started with the assumption of one QTL in the chromosome and then one can try to apply some ver-sions of single-marker or interval analysis. Reduced test power, biased parameter estimates, and detection of
ghost factors may result from this simplification, as dem- (1)
onstrated by simulation studies (Knott and Haley
Then the expected mean values and variances in the 1992;LuoandKearsey1992;MartinezandCurnow
alternative groups can be represented as 1992;Korolet al. 1998). This question is treated here
analytically for both single-marker and single-interval m˜15 a1m*111 a2m*121 b2m*211 b1m*22, analysis (see alsoWrightandKong1997).
m˜25 b1m*111 b2m*121 a2m*211 a1m*22, Consider a random sample of individuals genotyped
s˜2
15 a1s*1121 a2s*1221 b2s21*21 b1s*2221G(a1,a2,b1,b2), for marker loci from the chromosome that carries the
two QTL. With a dense molecular map, one analyzes s˜2
25 b1s*1121 b2s*1221 a2s21*21 a1s*2221G(b1,b2,a1,a2), consequently a series of markers with five different
TABLE 1
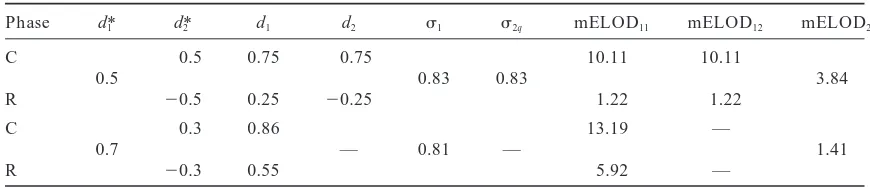
Asymptotic estimates of parameters and max ELODs (mELODs) of a single-QTL model when applied to the case of two linked QTL (r50.25) for coupling and repulsion phases
Phase d*1 d*2 d1 d2 s1 s2q mELOD11 mELOD12 mELOD2
C 0.5 0.75 0.75 10.11 10.11
0.5 0.83 0.83 3.84
R 20.5 0.25 20.25 1.22 1.22
C 0.3 0.86 13.19 —
0.7 — 0.81 — 1.41
R 20.3 0.55 5.92 —
The results of application of single marker sliding are presented. It appears that the ELOD function may have two local maxima (mELOD11and mELOD12) coinciding with the true positions of the QTL (see also Hyneand Kearsey1995; Wrightand Kong1997), resulting in two sets of parameter estimates. For comparison, we also provide the results of two-QTL sliding, mELOD2for the hypothesis H2(two linked QTL) vs. H1(single QTL), assuming the sample size n5250. C and R stand for coupling and repulsion phases, respectively; d*1,
d*2, d1, and d2, are the true and estimated values of the effects of the first and second QTL, respectively;s1 ands2are the estimates of the residual standard deviations (the true value wass*50.8). Note that the same values of mELOD2are presented for the two linkage phases, C and R (for further details see thetwo-trait analysissection).
where a single-QTL mapping model to a situation with two
linked QTL. In particular, we compare the expected G(a, b, c, d)5a(c(m*112 m*22)1d(m*112 m*21))2 LOD scores corresponding to the hypotheses H1, “one
QTL in the considered chromosome” and H0, “no QTL
1 b(c(m*122 m*22)1 d(m*122 m*21))2
in the chromosome.” Then, we have consequently
1 d(a(m*212 m*11)1b(m*212 m*12))2
for H1→ma
lx V1(s˜1(l ),s˜2(l ))5V1; for H0→U0(m,s)
1 c(a(m*222 m*11)1 b(m*222 m*12))2
5Elog
p
n
i51
(s√2p)21exp(2(x
i2 m)2/(2s2)),
1 a b(m*112 m*12)2(11 c1d)
1 c d(m*222 m*21)2(11 a1b).
and Assuming that our trial marker is tightly linked to (or
V05 maxm,s U0(m,s) coincides with) the putative (single) QTL and that the
trait distributions in alternative groups are normal, we 5 Elog
p
ni51
(sˆ
√2
p)21exp(2(xi2 mˆ )2/(2sˆ2)),can calculate the regression of the log-likelihood as a function of parameter setu 5(m1,m2,s1,s2):
where
U1(u)5E
o
n1
i51
log
h
(s1√2p)21exp[2(xi2 m1)2/(2s21)]j
mˆ 51⁄2(12r)m*1111⁄2rm*12 11⁄2rm*21 11⁄2(12r)m*22,
sˆ251⁄2(12r)s*2
11 11⁄2rs*12211⁄2rs*21211⁄2(12r)s*222 1E
o
n i5n111
log
h
(s2√2p)21exp[2(xi2 m2)2/(2s22)]j
,1G(1⁄2(12 r),1⁄2r,1⁄2(12r),1⁄2r). where E stands for expectations. To obtain the
asymp-It is easy to show that V05 20.5n(11 log(2p)1log totic estimates of parameter values, one can calculate s
ˆ2) and one can obtain the expression for the maximum max U1(u):
expected LOD value, max ELOD5V12V0.
These results allow us to evaluate the consequences ma
uxU1(u)5 U1(m˜1,m˜2,s˜1,s˜2)
of model misspecification. The behavior of the score
5 20.5n(11log(2ps˜1s˜2))5V1(s˜1,s˜2),
ELOD5V1(·)2V0as a function of trial marker position and the parameters characterizing the effect of Q1/q1 wheres˜1ands˜2are as defined in (2).
Clearly, s˜1 and s˜2 depend on the position l of the and Q2/q2 are represented in Table 1 and Figure 1. Clearly, V1(·)2V0 reaches a local maximum when the trial marker with respect to Q1/q1 and Q2/q2 loci. For
any trial marker position l the conditional max of U1 marker coincides with one of the QTL. One can easily see from the presented illustrations that the possibility (u) is V1(s˜1(l ),s˜2(l )). We now maximize V1(s˜1(l ),s2(l ))
with respect to marker position l. To save space we skip of finding an indication of the existence of two QTL by revealing two local maxima depends on linkage phase the details and provide here only the final results. Our
and magnitudes of the QTL effects and their ratio (see Figure 1 and Table 1).
Two linked QTL: ELOD for testing H2vs. H1: As before,
consider a situation when the target trait x depends on the two linked loci Q1/q1 and Q2/q2 with normal trait densities f11(x), f12(x), f21(x), f22(x) in the QTL groups Q1Q1Q2Q2, Q1Q1q2q2, q1q1Q2Q2, and q1q1q2q2of the dihaploid
(a) a1 5 (12r1)(12r2)(12r3)/sab,
a2 5 (12r1)(12r2)r3/sab,
b1 5 r1r2r3/sab,
b2 5 r1r2(1 2r3)/sab, sab5 r1r21 (12r1)(12r2);
t1 5 (12r1)r2r3/std,
t2 5 (12r1)r2(12r3)/std,
d1 5 r1(12 r2)(12r3)/std,
d2 5 r1(12 r2)r3/std,
std 5 (12r1)r2 1r1(1 2r2); mapping population characterized by unknown means
m*11,m*12,m*21, andm*22, and (residual) standard deviations
s*11,s*12,m*21, ands*22. Employment of two markers instead of one allows us to take into account both QTL. Several basic situations of marker loci positioning relative to the QTL could be considered:
(b) a15(1 2r1)(12r3), a2 5(12r1)r3,
b15r1r3, b25 r1(12 r3),
t1 5(1 2r1)r3, t2 5(12 r1)(12r3),
d1 5r1(12r3), d2 5 r1r3;
(c) a15(1 2r1)(12 r2), a2 5r1r2,
b15(1 2r1)r2, b2 5r1(12 r2),
t1 5(1 2r1)(12 r2), t2 5r1r2,
d1 5(1 2r1)r2, d2 5 r1(12 r2);
Clearly, other possible situations are equivalent to these four, up to a replacement of parameters. In the foregoing single-marker sliding, we had two discrepan-cies between the model specification and the real
situa-(d) a1 5(12 r1)(12r2)(12r3)/sab,
a2 5(12 r1)r2r3/sab,
b1 5r1(12r2)r3/sab,
b2 5r1r2(12 r3)/sab,
sab5(1 2r1)(12r2)(12r3)
1(12 r1)r2r31 r1r2(1 2r3)
1r1(12r2)r3,
t1 5(1 2r1)(12r2)r3/std,
t2 5(1 2r1)r2(12 r3)/std,
d1 5r1(12r2)(12 r3)/std,
d2 5r1r2r3/std,
std 5(1 2r1)(12r2)r3
1(12 r1)r2(12 r3)1 r1r2r3
1r1(12r2)(12 r3). tion: (i) only one QTL was assumed, and (ii) the trial
marker was treated as if its position coincides with that of the putative QTL. Now the model is improved, because the first assumption is removed. Therefore, we can con-sider a process of sliding with a pair of markers along the chromosome as a tool to locate the pair of QTL. Such a procedure is equivalent to two-interval mapping analysis
(3) (HaleyandKnott1992;MartinezandCurnow1992;
Jansen1993;Korolet al. 1998) with vanishing lengths of For any pair of markers, one can assume that they coin-the trial intervals. Because of coin-the foregoing assumptions, cide with (or are closely linked to) the corresponding the true expected densities of the trait distribution in four QTL. If so, the parameter values characterizing these alternative marker groups for an arbitrary pair of trial QTL are easily derived by employing maximization of markers can be written as regression of the log-likelihood function analogous to the procedure described in the previous section. Conse-h11(x)5 a1f11(x)1 a2f12(x)1 b2f21(x)1 b1f22(x)
quently, one can calculate, for the current pair of
mark-5 H(a1,a2,b1,b2), ers, the expected LOD assuming two linked QTL (H2 hypothesis), which can be compared to the expected h12(x)5 H(t1,t2,d1,d2),
log-likelihood obtained under the assumption of one h21(x)5 H(s1,d2,t1,t2), QTL (H1). We found that given independent variance effects of the linked QTL, the maximum of ELOD over h22(x)5 H(b1,b2,a1,a2),
coin-ference (Haldane mapping function) was assumed. For each sample, we employed two subsets of markers, using the information on intervals 12 and 48. Table 2 shows the behavior of the average LOD values and the discrep-ancy between the estimated and simulated QTL posi-tions as dependent on sample size and number of mark-ers. The main conclusion from the simulations is that the proposed method can indeed serve as a basis to get an approximate prediction of the expected LOD for interval mapping of two linked QTL (compare the aver-age max LODs with max ELODs).
It follows from the presented results that the differ-ence between predicted max ELOD and the averaged over simulations max LOD in repulsion phase is smaller Figure1.—Behavior of ELOD for a single-marker sliding
than that in coupling phase, in spite of the fact that our in the single-QTL model when applied to situations with two
linked QTL, as a function of the QTL positions and effects. theory predicts the same value for the two phases. In CP and RP, coupling and repulsion phases. The effects of the both cases the experimental LODs are smaller than QTL are denoted by the following: jj, d*1 5 0.5 and the predicted ones; i.e., for the same combinations of
d*2 50.5;m, d*1 50.6 and d*2 50.4;d, d*1 50.7 and d*2 5
parameters the simulated LODs were higher in repul-0.3. The residual standard deviation was 0.8.
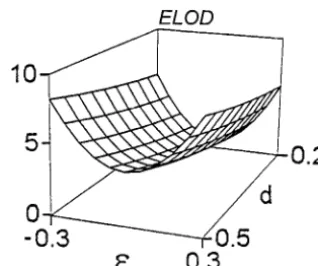
sion phase. A simple explanation can be proposed for this effect. The simulated procedure includes analyses for two hypotheses, H1and H2. In Monte Carlo experi-cide with those of the QTL (the proof is available from ments with two linked QTL, we can consider two options authors upon request). The surface ELOD 5 for fitting parameters of the maximum-likelihood func-ELOD(l1,l2) represented in Figure 2 manifests an impor- tion to the H1hypothesis (LanderandBotstein1989; tant asymptotic property of interval QTL mapping with Haleyand Knott 1992; Korol et al. 1998): (i) fixed vanishing interval length and increasing sample size: a position of the putative QTL, when its position is assumed faster-than-linear growth of the criterion when ap- to be known and coincides with either of the two simu-proaching the true position of the QTL (the second lated positions (which would not necessarily be true derivatives are positive). Note that the same max ELOD in the practical data analysis when these positions are is predicted for coupling and repulsion phases. unknown); (ii) variable position of the putative QTL that Comparison of the analytical and simulation results: The is assumed unknown, but can be found because it pro-foregoing model allows us to deduce the expected LOD vides maximum value of the maximum-likelihood func-values in the QTL mapping analysis in the case of two tion. Certainly, the achievable maximum is higher in linked QTL. However, these results are essentially as- the second situation resulting in an underestimation of ymptotic and may be biased at small samples. Therefore, the LOD value for H2vs. H
1(not shown).
it is important to assess how the obtained estimates Applications: The proposed analytical tool allows us converge to the expected parameter values when the to evaluate easily, without the necessity of Monte Carlo sample sizes and marker density are increasing. To do simulations, the behavior of the ELOD values across all that we employed Monte Carlo simulations. Chromo- possible locations of the putative QTL, for any fixed somes with two linked QTL were modeled for two popu- sets of parameters (see Figure 2), which is important lation sizes (n5500 and 2000). No crossing-over inter- for designing mapping experiments. For example, using the obtained expression of max ELOD, we can get an estimate of the minimum sample size needed to discrimi-nate between H1and H2, when H2is true (i.e., when we have a pair of linked QTL with some effects d1and d2), with a certain preset test power. This is based on the fact that the expected LOD value is distributed as noncentral chi-square with degrees of freedom equal to the differ-ence in the number of parameters specifying the alter-natives (H2and H1) (Wald1943). This tool enables us to compare different practical situations with respect to the foregoing prediction of the minimum sample size (see Lander and Botstein 1989). The usefulness of such an option is especially obvious for mapping of Figure2.—The ELOD surface for the alternative H2(two
linked QTL, where the efficiency of the experimental linked QTL) vs. H1(one QTL in the chromosome). (a)
un-known “configuration” of the problem: the distance of the putative QTL, their relative effects on trait mean value and variance, linkage phase (coupling vs. repul-sion), and presence or absence of epistatic interaction, etc. We now consider two examples to illustrate the possibilities of the proposed analysis: the dependence of ELOD for H2vs. H1on epistasis and the detectability of epistasis provided H2is already proved.
The effect of epistatic interaction on ELOD for QTL detec-tion: In the example on epistatic interactions the trait values in the four QTL classes were modeled as:
m115 m010.5(d11d2)1 ε, Figure3.—The behavior of the maximum ELOD (H2vs. H1) as a function of the effects of the QTL (d) and the level
m215 m020.5(d12d2)2 ε, of epistasis (ε). Here d is the effect of the first QTL and we assumed that the effect of the second QTL also varies, in such m125 m010.5(d12d2)2 ε, a manner that the sum of the absolute values of both effects is equal to 1. The numerical values of the parameters were m225 m020.5(d11d2)1 ε,
n5250, r525%, ands 50.8. where ε is the epistatic effect. It is of high practical
importance to predict the expected power of detection
of epistatic interactions within the framework of QTL of the effects and positions of the involved QTL. Clearly, if epistasis is present it also may affect the results of mapping analysis (HaleyandKnott1992;Eaves1994;
Korolet al. 1994;FuandRitland1996). This problem such a fitting. Then, when fitting H2for data with epista-sis, one can either adopt or ignore epistaepista-sis, which may is addressed in the next section. Here we consider first
the question of how the presence of epistasis may affect affect the final result. Figure 3 shows the behavior of max ELOD for testing H2vs. H1(testing for the presence the power of QTL detection. The fitted single-QTL
model of two-QTL data may depend on the peculiarities of two linked QTL as compared to one QTL). Two
TABLE 2
Comparison of the average LOD values (over 200 Monte Carlo runs) with the asymptotic values of max ELOD for comparing the hypotheses H2(two linked QTL in the chromosome)vs.
H1(one QTL in the choromosome)
Number of intervals
12 48
12 48 Average estimated positions of the QTL
Average LOD value
n max ELOD Phase L1 L2 L1 L2
C 5.26 5.88 14.37 49.66 14.10 49.47
500 7.68 (1.46) (1.49) (3.36) (3.22) (2.38) (2.52)
R 6.64 7.15 14.80 49.48 14.29 49.49
(2.17) (2.25) (3.64) (3.50) (2.60) (2.66)
C 23.46 26.84 14.29 49.15 14.29 49.02
2000 30.72 (3.55) (3.61) (1.54) (1.12) (0.56) (0.62)
R 27.33 29.07 14.72 49.12 14.41 49.19
(4.64) (4.73) (1.59) (1.18) (0.70) (0.73)
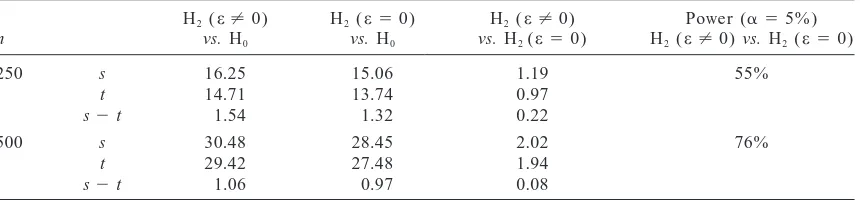
TABLE 3
Comparison of the average LOD values (over 100 Monte Carlo runs) with the asymptotic values of max ELOD for comparing the hypotheses H2(two linked QTL with epistasis), H2(two linked
QTL with no epistasis), and H0(no QTL in the chromosome)
H2(e?0) H2(e50) H2(e?0) Power (a 55%)
n vs. H0 vs. H0 vs. H2(e50) H2(e?0) vs. H2(e50)
250 s 16.25 15.06 1.19 55%
t 14.71 13.74 0.97
s2t 1.54 1.32 0.22
500 s 30.48 28.45 2.02 76%
t 29.42 27.48 1.94
s2t 1.06 0.97 0.08
A situation with two linked epistatically interacting QTL was considered for coupling phase. The positions, the additive effects, and the residual variances of the QTL are as described in Table 2. The epistatic effect wase50.125. Here s denotes the average LOD resulting from simulation experiments whereas t denotes the predicted max ELOD for the compared alternatives H2(e?0) vs. H2(e50) (d.f.51).
conclusions can be derived from our analysis: (i) the may increase the mapping resolution in situations with linked QTL, i.e., when H2 (two linked QTL) and H1 effect of epistasis on detection power is symmetric with
respect to the sign ofε, and (ii) epistasis may have either (one QTL) are compared. The higher the residual cor-relation the better the expected LOD. In two-trait analy-a positive or neganaly-ative effect on manaly-ax ELOD of the test
of H1 vs. H0 (not shown) and always a positive effect sis, the residual correlation between the traits in the QTL groups may be caused by nongenetic mechanisms, when testing H2vs. H1(Figure 3; see alsoEaves1994).
The detectability of epistasis (comparison of H2under ε? pleiotropy, or linkage of genes from other
chromo-somes affecting either of the traits, and by pleiotropy 0 vs. H2underε50): In the foregoing section we could
see how epistasis affects the expected LOD values when and linkage of genes from the chromosome under con-sideration.
single-QTL and two-QTL models are applied to the
anal-ysis. The proposed tool allows us also to predict the As in single-trait analysis, to analyze two-QTL situa-expected LOD for the situation when one wants to con- tions we calculate max ELOD for the alternative hypoth-trast two versions of the hypothesis H2(two linked QTL eses: H2 vs. H1. This means that we need to develop in the chromosome): H2(ε50), i.e., additive effects of bivariate analogues of the foregoing single-QTL and the QTL, and H2(ε?0), i.e., assuming epistasis. Testing two-QTL models based on single- and two-marker slid-for epistasis (coadaptation) and evaluating the magni- ing procedures. Hence, the goal of the first part of this tude of epistasis have recently become an important section is to obtain the regression of the log-likelihood component of QTL mapping analysis (Doebley et al. function assuming that only one QTL resides in the 1995;Liet al. 1997). This meaningful subject has a long chromosome that in fact carries two linked QTL. Let history in both evolutionary genetics (Dobzhansky the traits x and y be dependent on two loci, Q1/q1and 1970; Wright 1977), theories of recombination and Q2/q2, residing in the marked chromosome and let the sex evolution (Barton 1995; Otto and Feldman bivariate trait distributions in the four QTL groups 1997), and agricultural genetics (Yuet al. 1997). How- Q1Q1Q2Q2, Q1Q1q2q2, q1q1Q2Q2, and q1q1q2q2 of dihaploid ever, only with QTL mapping can epistatic effects be mapping population be normal densities f11(x, y), f12(x, objectively detected and evaluated. Each of the forego- y), f21(x, y), and f22(x, y) with unknown vectors of means ing alternative versions of H2, without and with epistasis, {m*x}5{m*11x,m*12x,m*21x,m*22x} and {m*y}5{m*11y,m*12y,m*21y,
can be compared to H0(no QTL in the chromosome), m*22y}, residual standard deviations {s*x} 5{s*11x,s*12x,
using the proposed approximation. The difference be- s*21x,s*22x} and {s*y}5{s*11y,s*12y,s*21y,s*22y}, and correla-tween the resulting max ELODs will give us max ELOD tions {r*xy}5(r11,* r*12,r*21,r*22), respectively. Usually, the for the presence of epistasis. An example presented in mapping procedure is started with the assumption of Table 3 illustrates the closeness between the predicted one QTL in the chromosome, and then one could try to LOD values and the average LODs obtained in direct apply some versions of single-marker or interval analysis. Monte Carlo simulations. Reduced test power, biased parameter estimates, and detection of ghost factors may result from this simplifi-cation, as demonstrated by many simulation studies. TWO-TRAIT ANALYSIS
The foregoing analytical treatment of this problem de-veloped for a single-trait analysis is expanded now to As was shown in our previous simulation study (Korol
Consider a random sample of individuals each charac- hood function. The regression of the log-likelihood now looks like
terized for traits x and y and a set of marker loci from the chromosome in question. For an arbitrary marker,
U2xy({mx}, {sx}, {my}, {sy}, {rxy})5U2xy(·)
we take into account the same five situations (a–e) as
those considered above for the single-trait analysis. 5
Elog (
p
2j,k51
p
njkijk51
N(xijk,mjkx,mjky,sjkx,sjky,rjk)),
Then the true expected densities of the bivariate trait distribution in the alternative marker groups for an
where N (·) is a bivariate normal density, {mx} 5 {m11x,
arbitrary scanning marker will be
m12x, m21x,m22x), {my} 5 (m11y,m12y,m21y,m22y), {sx} 5(s11x,
hMM(x, y)5 h15 a1f11(x, y)1 a2f12(x, y) s12x,s21x,s22x), {sy}5(s11y,s12y,s21y,s22y), {rxy}5(r11,r12,
r21,r22), and nklare the frequencies of the four marker
1 b2f21(x, y) 1 b1f22(x, y),
classes for the current pairs of markers, n111n121n211 hmm(x, y)5 h25 b1f11(x, y)1 b2f12(x, y) n225n. Then,
1 a2f21(x, y) 1 a1f22(x, y), max U2xy(·)5U2xy({m˜x}, {s˜x}, {m˜y}, {s˜y}, {r˜xy})
whereaiandbjare as defined in (1). To proceed with 5 2n(11log 2p)
the analysis we need to make the following note.
11⁄
2((12r˜)log (s˜11xs˜11ys˜22xs˜22y Consider an arbitrary bivariate distribution with finite
central moments (up to the fourth). Then the maxi- 3√(12 r˜2
11)(12 r˜222)) mum of log-likelihood per individual for the Gaussian
1r˜ log(s˜12xs˜12ys˜21xs˜22y√(12 r˜212)(12 r˜221))) model will converge in probability to the maximum of
the regression of the log-likelihood function per individ- 5V
2xy(r˜, {s˜x}, {s˜y}, {rxy})5V2xy(·), ual. Assume that the trial marker is exactly at the same
where the components of vector ({m˜x},{s˜x},{m˜y},{s˜y},{r˜xy})
position as our putative QTL and the trait distributions
in the alternative groups MM and mm are bivariate nor- and r˜ are calculated routinely. This presentation allows mals. The regression of the log-likelihood will take the us to obtain the following results.
form Assume independent variance effects of the linked
QTL for each of the traits (i.e., s*11x 5 s*x,s*12x5 U1xy(u)5Elog(
p
n1
i51
N(x1i,m1x,m1y,s1x,s1y,r1) axs*x,s*21x 5 bxs*x, s*22x 5 axbxs*x, s*11y5 s*y,s*12y 5ays*y,
s*21y5bys*y,s*22y5aybys*y*) and equal residual
correla-tion between the target traits in all of the four QTL
3
p
nj5n111
N(x2j,m2x,m2y,s2x,s2y,r2)),
groups (i.e., r*ij 5 r*; i, j 5 1.2). Then, if one of the
traits, x, depends additively on both linked QTL (Q1/ whereu 5(m1x,m2x,m1y,m2y,s1x,s2x,s1y,s2y,r1,r2). Then, q
1and Q2/q2), whereas the correlated trait y is indepen-dent of the considered QTL, then the global maximum ma
ux U1xy(u)5 2n(111⁄2log(4p2s˜1xs˜2xs˜1ys˜2y
of V2xy(·) over all possible locations of the trial pair of
3
√(1
2 r˜21)(12 r˜2))2markers in the chromosome is attained exactly when these locations coincide with those of the QTL.
Like-5 V1sy(s˜1x,s˜2x,s˜1y,s˜2y,r˜1,r˜2),
wise, if each of the two linked QTL (i) affects one and wheres˜iu(u5x or y) andr˜i(i51,2) are some functions only one of the traits or (ii) has a pleiotropic effect on
of the main parameters. both traits, x and y, but in such a manner that d1x/d2x5 Consider now a process of scanning with a pair of d1y/d2y 5 c, then the maximum of V2xy(·) over possible markers along the chromosome. Because of the forego- locations of the trial pairs of markers in a sufficiently ing assumptions, the true expected densities of the trait small neighborhood of the QTL is attained exactly when distribution in four alternative marker groups for an these locations coincide with those of the QTL (the arbitrary pair of trial markers can be written as proof is available from the authors upon request).
To illustrate how the proposed model works we now h11(x, y)5 a1f11(x, y)1 a2f12(x, y)1 b2f21(x, y)
address two questions concerning the dependence of
1 b1f22(x, y)5H(a1,a2,b1,b2),
the expected LOD value for discrimination between H1 h12(x, y)5H(t1,t2,d1,d2), h21(x, y)5H(d1,d2,t1,t2),
and H2on (i) the residual correlation between the traits h22(x, y)5H(b1,b2,a1,a2),
and (ii) epistasis. Let us fix the effect of one of the QTL (say Q1/q1) and consider how max ELOD depends on where the mixture parameters ai,bi, ti, anddi(i 5 1,
the effect of the second QTL (Q2/q2) and on the residual 2) are as defined in (3). For any pair of markers, one
correlation (r) between the quantitative traits. We are can assume that they coincide with (or are closely linked
interested here in testing H2vs. H1, assuming additive to) the corresponding QTL. If so, the parameter values
effects of the two QTL. Two situations are considered: characterizing these QTL are easily derived by
Figure5.—The behavior of the maximum ELOD (H2vs. Figure4.—The behavior of the maximum ELOD (H2vs. H1) in the two-trait model with two linked QTL as a function H1) in the two-trait model with two linked QTL as a function of the parameters. In (a), the first QTL affects only the trait of the residual correlation and the effect of one of the QTL x (d1x 50.35), whereas the second QTL affects both traits: on one of the two traits (y). (a) A situation with the first d2x50.15, and d2yvaries, as shown in the figure. The residual QTL affecting the trait x (d1x 5 0.25), whereas the second correlation wasr 5 20.5; the variablesεand dy5d2ydenote QTL affects the trait y. (b) The first QTL affects only the trait the epistatic interaction between the QTL for the trait x and
x (d1x 5 0.35), whereas the second QTL affects both traits the effect of the second QTL on trait y, respectively. In b, (d2x50.25; d2yvaries, as shown in the figure). (a and b) r5 both QTL affect both traits (all effects were equal to 0.35).
25%,s 50.5, and n5250. The residual correlation wasr 5 20.5. (a and b) r525%,
s 50.5, and n5250.
QTL (Figure 4a), whereas in the second case both QTL
5b) demonstrates a situation in which the QTL interact affect the first trait and one of the QTL affects the
epistatically for both traits. Clearly, the provided examples second trait (Figure 4b). One can conclude that the
are not more than illustrations of the possibilities of the detection power increases with the residual correlation
proposed analytical tool. Each of the questions discussed between the analyzed traits. An additional conclusion
in these illustrations can be dealt with in necessary detail. is that the power increases with the effect of Q2/q2up
to some “saturation” point. In the first situation the saturation is reached when the effect of Q2/q2becomes
CONCLUSION equal to that of Q1/q1(see Figure 4a). The only
differ-ence in the second situation is that the saturation point Resolution power of mapping analysis of linked QTL remains a difficult problem, which was previously ad-depends onr: the larger abs(r) the earlier (at lower
effects of Q2/q2) the saturation (see Figure 4b). For dressed mainly in terms of Monte Carlo simulations. This has restricted the possibilities of detailed evaluation the second situation, let us consider the complication
caused by epistasis. Namely, we allow for epistatic inter- and comparison of different mapping situations and experimental designs. The proposed analytical method action between the QTL with respect to the trait x. As
in the foregoing example on single-trait analysis, it is of evaluating the expected LOD generalizes for the case of two linked QTL the corresponding estimates derived interesting here to evaluate how epistasis affects the
expected detection power. Figure 5a demonstrates that byLanderandBotstein(1989),Mackinnonand Wel-ler(1995), andMackinnonet al. (1996) (referred to epistasis may be helpful in discriminating between H2
(two linked QTLs) and H1 (only a single QTL in the as “deterministic sampling”). Our model allows us to analyze situations with variance effect and epistatic inter-chromosome). This effect is manifested for both positive
and negative residual correlations, but the sign of r is action between the putative QTL. We developed here also a two-locus analogue of our previous analytical pre-important in determining the details of the behavior of
Jiang, C.,andZ.-B. Zeng,1995 Multiple trait analysis and genetic cated questions can be addressed, like dependence of
mapping for quantitative trait loci. Genetics 140: 1111–1127. the QTL detection power on residual correlation be- Knott, S. A.,andC. S. Haley,1992 Aspects of maximum likelihood
methods for mapping of quantitative trait loci in line crosses. tween the traits, accounting of epistatic interaction
be-Genet. Res. 60: 139–151. tween the QTL for one or both traits, and the influence
Korol, A. B., I. A. PreygelandN. I. Bocharnikova,1987 Linkage of variance effect for one or both traits on ELOD. Al- between loci of quantitative traits and marker loci: 5. Simultane-ous analysis of a set of marker and quantitative traits. Genetika though this method gives only an asymptotic estimation
(USSR) 23: 1421–1431.
of ELOD, it allows one to get an approximate assessment Korol, A. B., I. A. PreygelandS. I. Preygel,1994 Recombination of a broad spectrum of specific mapping situations. Variability and Evolution. Chapman & Hall, London.
Korol, A. B., Y. I. RoninandV. M. Kirzhner,1995 Interval mapping Clearly, any asymptotic effect found by the proposed
of quantitative trait loci employing correlated trait complexes. tool can (and should) be checked by Monte Carlo simu- Genetics 140: 1137–1147.
lations for given sample sizes. Our comparisons made Korol, A. B., Y. I. Ronin, E. NevoandP. Hayes,1998 Multi-interval mapping of correlated trait complexes: simulation analysis and for a series of situations indeed show a good
correspon-evidence from barley. Heredity 80: 273–284.
dence between the predicted max ELODs and LOD Lander, E. S.,andD. Botstein,1989 Mapping Mendelian factors values averaged over Monte Carlo runs. An important underlying quantitative traits using RFLP linkage maps. Genetics
121:185–199. point is that our results prove (for the considered class
Lebowitz, R. J., M. SollerandJ. S. Beckmann,1987 Trait-based of situations) the important theoretical fact of consis- analyses for the detection of linkage between marker loci and quantitative trait loci in crosses between inbred lines. Theor. tency of interval mapping analysis with two linked QTL
Appl. Genet. 73: 556–562. (convergence of the parameter estimates to the true
Li, Z., S. R. Pinson, W. D. Park, A. H. PatersonandJ. W. Stansel,
values with increasing sample size and vanishing interval 1997 Epistasis for three grain yield components in rice (Oryza sativa L.). Genetics 145: 453–465.
length).
Luo, Z. W.,andM. J. Kearsey,1992 Interval mapping of quantitative We thank Z-B. Zeng for valuable comments. Two anonymous review- trait loci in an F2 population. Heredity 69: 236–242.
ers provided useful criticisms and suggestions on the earlier version Mackinnon, M. J.,andJ. I. Weller,1995 Methodology and accuracy of estimation of quantitative trait loci parameters in a half-sib of the manuscript. This research was supported by the Israeli Ministry
design using maximum likelihood. Genetics 141: 755–770. of Absorption and Ministry of Science.
Mackinnon, M. J., S. van der BeekandB. P. Kinghorn,1996 Use of deterministic sampling for exploring likelihoods in linkage analysis of quantitative traits. Theor. Appl. Genet. 92: 130–139.
Martinez, O.,andR. N. Curnow,1992 Estimating the locations and the size of the effects of quantitative trait loci using flanking LITERATURE CITED
markers. Theor. Appl. Genet. 85: 480–488.
Motro, U.,andM. Soller,1993 Sequential sampling in
determin-Barton, N. H.,1995 A general model for the evolution of
recombi-ing linkage between marker loci and quantitative trait loci. Theor. nation. Genet. Res. 65: 123–144.
Appl. Genet. 85: 658–664.
Boehnke, M.,andP. Moll,1989 Identifying pedigrees segregating
Otto, S. P.,andM. W. Feldman,1997 Deleterious mutations, vari-at a major locus for a quantitvari-ative trait: an efficient strvari-ategy for
able epistatic interactions, and the evolution of recombination. linkage analysis. Am. J. Hum. Genet. 44: 216–224.
Theor. Pop. Biol. 51: 134–147.
Darvasi, A.,andM. Soller,1992 Selective genotyping for
determi-Ronin, Y. I., V. M. KirzhnerandA. B. Korol,1995 Linkage between nation of linkage between a marker locus and a quantitative trait loci of quantitative traits and marker loci: multi-trait analysis with locus. Theor. Appl. Genet. 85: 353–359. a single marker. Theor. Appl. Genet. 90: 776–786.
Darvasi, A.,andM. Soller,1994 Selective DNA pooling for deter- Ronin, Y. I., A. B. KorolandJ. J. Weller,1998 Selective genotyping mination of linkage between a molecular marker and a quantita- to detect quantitative trait loci affecting multiple traits: interval tive trait locus. Genetics 138: 1365–1373. mapping analysis. Theor. Appl. Genet. (in press).
DeVicente, M. C.,andS. D. Tanksley,1993 QTL analysis of trans- Soller, M.,andJ. S. Beckmann,1990 Marker-based mapping of gressive segregation in an interspecific tomato cross. Genetics quantitative trait loci using replicated progeny. Theor. Appl.
Ge-134:585–596. netics 80: 205–208.
Dobzhansky, T.,1970 Genetics of the Evolutionary Process. Columbia Wald, A., 1943 Tests of statistical hypotheses concerning several University Press, New York. parameters when the number of observations is large. Trans. Am.
Doebley, J., A. StecandC. Gustus,1995 teosinte brandched1 and Math. Soc. 54: 426–482.
Weller, J. I., J. Z. Song, Y. I. RoninandA. B. Korol,1997 Experi-the origin of maize: evidence for epistasis and Experi-the evolution of
mental designs and solutions to multiple trait comparisons. Anim. dominance. Genetics 141: 333–346.
Biotechnol. 8: 107–122.
Eaves, L. J.,1994 Effect of genetic architecture on the power of
Wright, S.,1977 Experimental results and evolutionary deductions, human linkage studies to resolve the contribution of quantitative
in Evolution and the Genetics of Populations, Vol. 3. University of trait loci. Heredity 72: 175–192.
Chicago Press, Chicago.
Fu, Y.-B.,andK. Ritland,1996 Marker-based inferences about
epis-Wright, F. A.,andA. Kong,1997 Linkage mapping in experimental tasis for genes influencing inbreeding depression. Genetics 144:
crosses: the robustness of single-gene models. Genetics 146: 417– 339–348.
425.
Haley, C. S.,andS. A. Knott, 1992 A simple regression method
Yu, S. B., J. X. Li, C. G. Xu, Y. F. Tan, Y. J. Gaoet al., 1997 Importance for mapping quantitative trait loci in line crosses using flanking
of epistasis as the genetic basis of heterosis in an elite rice hybrid. markers. Heredity 69: 315–324.
Proc. Natl. Acad. Sci. USA. 94: 9226–9231.
Hyne, V.,andM. J. Kearsey, 1995 QTL analysis: further uses of Zeng, Z-B.,1994 Precise mapping of quantitative trait loci. Genetics ‘marker regression.’ Theor. Appl. Genet. 91: 471–476. 136:1457–1468.
Jansen, R. C.,1993 Interval mapping of multiple quantitative trait Zeng, Z-B., 1997 Combining information from data in mapping loci. Genetics 135: 205–211. analysis: use of multiple markers and multiple traits. Anim.
Bio-Jansen, R. C.,andP. Stam, 1994 High resolution of quantitative technol. 8: 145–150. traits into multiple loci via interval mapping. Genetics 136: 1447–