Copyright 0 1996 by the Genetics Society of America
Dynamics of Repeat Polymorphisms Under a Forward-Backward Mutation
Model: Within- and Between-Population Variability
at
Microsatellite Loci
Marek Kimmel,
*
Ranajit Chakraborty,t David N. Stiverst and Ranjan Deka:
*Department of Statistics, Rice University, Houston, Texas 77251,
’
Human Genetics Center, University of Texas Health Science Center, Houston, Texas 77225 and Department of Human Genetics, University of Pittsburgh, Pittsburgh, Pennsylvania 15261Manuscript received October 25, 1995 Accepted for publication January 27, 1996
ABSTRACT
Suggested molecular mechanisms for the generation of new tandem repeats of simple sequences indicate that the microsatellite loci evolve via some form of forward-backward mutation. We provide a mathematical basis for suggesting a measure of genetic distance between populations based on microsat- ellite variation. Our results indicate that such a genetic distance measure can remain proportional to the divergence time of populations even when the forward-backward mutations produce variable and/ or directionally biased alleles size changes. If the population size and the rate of mutation remain constant, then the measure will be proportional to the time of divergence of populations. This genetic distance is expressed in terms of a ratio of components of variance of allele sizes, based on expressions developed for studying population dynamics of quantitative traits. Application of this measure to data on 18 microsatellite loci in nine human populations leads to evolutionary trees consistent with the known ethnohistory of the populations.
T
HE study of human genome diversity for inferring the history of human genetic differentiation has been a focus of attention of biological anthropological investigations since the discovery of the first polymor- phic marker in the human genome. Traditional sero- logical and immunological markers used for this pur- pose generally do not provide a high resolution for distinguishing populations with close historical connec- tions. This is so because genetic distances between pop- ulations are generally small, except for the major racial groups. This causes statistical error in phylogenetic re- construction of the history of genetic differentiations of world populations. The advent of hypervariable DNA polymorphisms has the potential for increasing the ac- curacy of such studies, as has been empirically demon- strated (BOWCOCK et al. 1994; DEKA et al. 1995a,b). Hypervariable tandem repeat markers have the poten- tial for being particularly efficient for this purpose, be- cause they offer a greater number of segregating alleles. As a consequence, the extent of genetic diversity within and between populations (in absolute scale) is larger for these loci than for the traditional loci.In order that a measure of genetic distance be useful for such studies, it is necessary for it to be a known monotonic increasing function of time of divergence (i.e., the absence of gene flow) between populations. This criterion raises concerns regarding the utility of
hypervariable tandem repeat markers in evolutionary studies, since alleles at such loci evolve by molecular
Cmespondingauthur: Ranajit Chakraborty, Human Genetics Center,
University of Texas Health Science Center, P.O. Box 20334, Houston, TX 77225.
Genetics 1 4 3 549-555 (May, 1996)
processes that involve both contraction and expansion of repeat sizes (WEBER and WONG 1993; JEFF- et al. 1994). As a consequence, alleles of similar sizes are not necessarily evolutionarily related ( KIDD et al. 1991 )
.
Furthermore, the mathematical relationship of the ex- pectations of traditional measures of genetic distances with the time of divergence have specific underlying assumptions regarding mutation processes that may not hold for tandem repeat loci ( SHRIVER et al. 1993; VALDES et al. 1993; DI RIENZO et al. 1994)
.
While the mechanism of mutational changes at tan- dem repeat loci is not precisely known at a molecular level, empirical observations indicate that the allele size changes can be approximated by a forward-backward random walk model. The population dynamics of spe- cific forms of such mutation models has been studied in the context of within- and between-population genetic variation at proteinenzyme loci (WEHRHAHN 1975; LI 1976; CHAKRABORTY and NEI 1982)
.
In these models, mutations were frequently assumed to introduce sym- metric changes of one and/
or two steps in either direc- tion. CHAKRABORTY and NEI ( 1982) considered a gen- eral multi-step random walk model using a bidirectional binomial as a specific example. Mathematically, the same model applies to tandem repeat loci, with allelic states defined by size (number of repeat units) instead of the charge of the protein molecule.More recently, SLATKIN ( 1995) considered a similar index for studying gene differentiation at tandem re- peat loci in a substructured population. SLATKIN further showed that the variance components in his index re- late to the within- and between-population diversity measures proposed by GOLDSTEIN et al. ( 1995a,b )
.
Also, SHRIVER et al. ( 1995) suggested a revised measure of genetic distance that they argue is appropriate for mi- crosatellite tandem repeat markers and that is propor- tional to the time of divergence between populations under some specific conditions of forward-backward mutation of alleles.In this paper our goal is to demonstrate that SLAT-
KIN'S ( 1995) index, which is identical with an index
introduced by CHAKRABORTY and NEI ( 1982), has prop- erties more general than those indicated in the litera- ture; namely, that the time linearity of the index holds for stepwise mutations with arbitrary distributions of changes of allele size. Therefore, the index is applicable for studying genetic differentiation in the presence of allele-size expansion or contraction bias in mutations, such as those postulated by RUBINSZTEIN et al. ( 1995). We show this by using both a direct population dynam- ics approach and the theory of coalescence for a gener- alized stepwise mutation model.
We also illustrate that the CHAKRABORTY-NEI-SLATKIN index, applied to a new set of microsatellite loci typed
in several of human populations of African, Oriental and Indoeuropean origin, leads to interpopulation dis- tances consistent with the accepted ancestry of human
populations. The importance of the model assump
tions, including constancy of population size and muta- tion rate, are discussed in light of the above theoretical and empirical observations.
THEORY
We show that under any general forward-backward mutation model, the within-population allelic variation in a finite population reaches a state of equilibrium when variation is measured in terms of the distribution of allele size differences in genotypes of diploid individ- uals. In addition, when the population sizes of two di- verging populations remain constant over time, we show that the ratio of between- us. within-population variance of allele size differences is linearly related to the time of divergence and is independent of mutation rate.
Within-population variability: Consider a population
of diploid individuals and a locus with a denumerable set of alleles indexed by integer numbers. The within- population component of genetic variance
E
( x
- X ) * / ( 2 N - 1 ) ,[
i= 2 N 11
where E ( * ) denotes the expectation of a random vari-
able, and
x
is the size of the allele in the ith chromo- some present, is equal to V,/2, whereK
= E [ (Xi -q * 1
9 ( 1 )and
x ,
4
are the sizes of two alleles randomly selectedfrom the population.
x
andX,
are timedependent ran- dom variables, ie., Xi =x
( t ) andXj
=3(
t ) , but for notational simplicity the argument tis suppressed, since the time dependence is always clear from the context. In V,, subscript t denotes chronological time (in units of generations) counted from a convenient reference point. We consider the time evolution of V, in a stepwise mutation model with sampling from the finite allele pool. We assume the following:In each generation, the genotypes of all individuals are sampled with replacement from the 2N chromo- somes present in the previous generation (FISHER-
WRIGHT model, EWENS 1979).
Each chromosome independently is subject, with probability u per generation, to a mutation that re- places an allele of size Xwith an allele of size X
+
U , where U is an integer-valued random variable with probability generating functionf f i
y ( s ) = s " P r [ U = u ] = ~ ( s ~ ) ,
( 2 )
1(="mdefined for s in the neighborhood of 1.
The version of the model in CHAKRABORTY and NEI
( 1982) considers the binomial special case of
y
( s ).
The generalization below is straightforward.Based on WEHRHAHN ( 1975) and CHAKRABORTY and
NEI ( 1982), the probability generating function
P ( s, t ) = E ( sx~-xl)
of X , -
X,
is given byP(s,
t ) =P(s,
0 ) exp[-a(s) t ]where
1 2N
a ( s ) = - - 2v[$(s) - 13, ( 4 )
and $(s) = [cp(s)
+
c p ( l / s ) ] / 2 is the symmetrized form of cp( s ).
In the vicinity of s = 1 for which a ( s) is positive, the solution of this equation converges, as t + m , towardwhich can be represented as
where
4Nu ' = l + 4 N u '
Variation at Microsatellite Loci 55 1
Under equilibrium conditions, the same result can be derived using the coalescent approach (APPENDIX )
.
Before passing to variances, let us note that $( s),
the symmetrized form of the probability generating func- tion cp( s),
does not embody any assumptions imposed on our formulation. On the contrary, its presence in the expressions ( 4 ) - ( 6 ) is a direct consequence of considering the difference of sizes of two randomly se- lected alleles ( X i -4)
,
which is a random variable with a symmetric distribution. The most important conse- quence of this fact is that all the results we obtain are valid for general asymmetric (directionally biased) mu- tation mechanisms and not only for the symmetric sin- gle-step special case.The variance of Xi - X,,
d‘
dS2
v,
= - P ( s, t )I
s = l= V ,
+
(V, - V , ) exp[-t/(2r\r)l, ( 8 )where V, = ( 4 N v )
qff
(1 ),
is equivalent to ( 8 ) in CHAK-RABORTY and NEI ( 1982). The within-population vari- ance of allelic size X , is
V,/2
in generation t.Between-population variability: We begin by calculat- ing the probability generating function of the random variables Zl, - Z,, the difference of sizes of two alleles randomly selected from two subpopulations (say, 1 and
2
) , which resulted from a split at time 0 in an ancestral population.The probability generating function D( s, t ) of Zlj -
Z Z j at time t is equal to
D ( s , t ) = Wo(s)R(s, t ) , ( 9 )
where Wo ( s ) is the probability generating function of the size difference between randomly selected alleles in the ancestral population at t = 0 , while R ( s, t ) repre- sents the change in that difference during the time interval [ 0 , t]
.
Based on the model assumptions, we obtainR ( s , t ) = e x p ( ( 2 4 [ $ ( s ) - 111, (10)
which can be interpreted as the Poisson distribution of the number of mutation events compounded with the random size of the mutation events. If we denote D, = Var ( Zli -
Z,,)
,
then the above yieldsOf
=v,
+
R”(1, t ) =v,
+
( 2 v t ) $ ” ( l ) . (11) In the formulation of variance components analysis, Zli and Zri can be represented as2 1 , = YI
+
X l i ,2, = Y2
+
x z j .Y1 and Y2 are exchangeable random variables represent-
ing the between-population variability. Likewise, X,,,n are
exchangeable random variables, independent of Yl and
Ki, representing the within-population variability in populations 1 and 2 [for an extended discussion of
components of the genetic variance, see e.g., COCK- ERHAM and WEIR (1987) and references therein]. Therefore,
Var ( Zli - 2),
= Var( Y] - Y;r)
+
Var( Xli - X Z j ) . (12)We know that Var ( Zlj - Z Z j ) = Dt, (see Equation 11 ) and Var ( Xli
-
X Z j ) = V, (see Equation 1 ).
The between-population variance at time t is equal to BJ2
where B, = Var ( Yl - Y 2 ) . Using Equation 12 we obtainB, = ( 4 - V,) = ( v , - v , )
(1 - e x p [ - t / ( 2 N ) l )
+
2 v t $ ” ( l ) , (13)which is asymptotically equivalent to 2vt$“ (1). If the ancestral population was at equilibrium at time t = 0
( i e . , if V, =
E ) ,
thenB, = 2 v t $ ” ( l ) . ( 1 4 )
Under the same condition, V, = V , , and ( 8 ) and (14) yield the expression
2
Bt/ V, = t/ N . (15)This is the index introduced by CHAKRABORTY and NEI
( 1982), which is linear as a function of time of diver- gence of populations 1 and 2.
Relationship to the TR index: SLATKIN ( 1995 ) , based on a coalescence argument, introduced an index
T H = 4Rw/(1 - Rsr), (16)
where RST = (
3
-
Sw)
/
3,
$is twice the estimated total variance of allele size in two populations pooled to- gether, and S, is twice the average of the estimated total variance of allele size within each population.Let us suppose that nl and n, chromosomes have been sampled from each of the two populations, respec- tively. In the standard notation of analysis of variance
( SOKAL and ROHLF 1981 )
,
S =
2 . SSOt/
(721+
n, - 1 ) =2 .
MSOt,
(17)
S w = 2*S&,t,/(nl
+
- 2 ) = 2.M&,,,. (18)It is known that E ( M&*) =
K / 2
and E ( M k m ) =V,/
2
+
%Bf/
2, where
is the harmonic mean of n1 andn, in our notation for the components of population variance. This leads first to
E ( S w )
= V,, (19)and then to
E ( S ) = [ 2 / ( n 1
+
% - 1)1[E(S&m)
+
E(S&,)l=
K +
noB,/(n1+
n, - I ) , (20)which leads to
E ( S - S,) = ?k)Bt/(n1
+
n, - 1)= 2 n 1 a B t / [ ( a
+
n,-
1 ) (nl+
% ) I ,
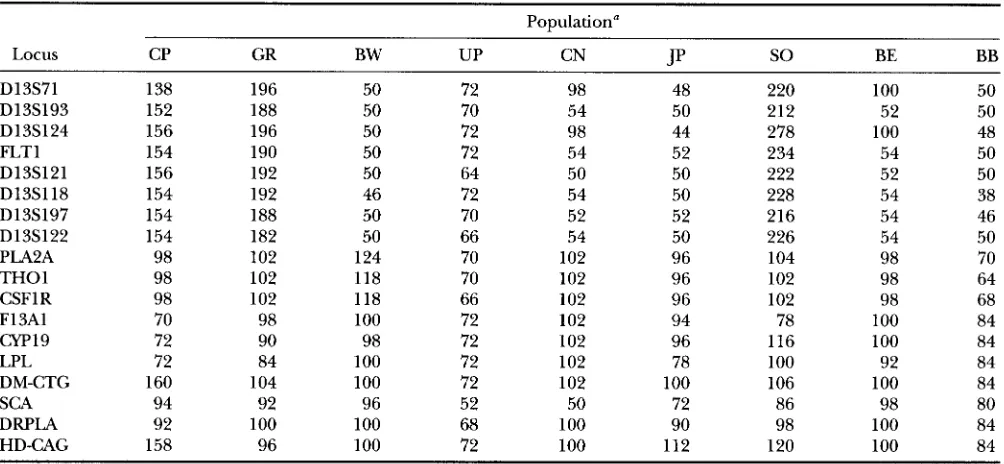
(21)TABLE 1
Number of chromosomes sampled at loci for the populations analyzed
Population“
Locus CP GR BW UP CN J P
so
BE BBD13S71 138 196 50 72 98 48 220 100 50
D13S193 152 188 50 70 54 50 212 52 50
D13S124 156 196 50 72 98 44 278 100 48
FLTl 154 190 50 72 54 52 234 54 50
D13S121 156 192 50 64 50 50 222 52 50
D13S118 154 192 46 72 54 50 228 54 38
D13S197 154 188 50 70 52 52 216 54 46
D13S122 154 182 50 66 54 50 226 54 50
PLA2A 98 102 124 70 102 96 104 98 70
THO1 98 102 118 70 102 96 102 98 64
CSFl R 98 102 118 66 102 96 102 98 68
F13A1 70 98 100 72 102 94 78 100 84
cYP19 72 90 98 72 102 96 116 100 84
LPL 72 84 100 72 102 78 100 92 84
DM-CTG 160 104 100 72 102 100 106 100 84
SCA 94 92 96 52 50 72 86 98 80
DRPLA 92 100 100 68 100 90 98 100 84
HD-CAG 158 96 100 72 100 112 120 100 84
The population names are abbreviated as follows: GR, German; CP, unrelated Caucasian from CEPH pedigree panel; BW, Brazilian White; UP, Uttar Pradesh; CN, Chinese; JP, Japanese; SO, Sokoto Nigerian; BE, Benin; BB, Brazilian Black.
sizes are large and are of comparable magnitude. Therefore, based on the definition of Slatkin’s index in ( 1 6 ) , and (20) and
( 2 1 ) above, we have
E ( T R )
=
4 E ( S - S , ) / E ( S , )=
2B,/V,. (22)This shows that Slatkin’s result can be derived from CHAKRABORn and NEI ( 1982) formulation.
If a population at equilibrium under mutation-drift balance splits into more than two subpopulations of identical size equal to that of the ancestral population,
( 16)
-
(22) hold with appropriate changes of nl, %,. . .
, and ( SOKAL and ROHLF 1981 ),
so that (22) is still applicable. As before, V, and B, are the within- and between-populations components of variance of differ- ences in allele sizes.APPLICATION TO DATA ON REPEAT LOCI IN NINE HUMAN POPULATIONS
Recently, DEKA et al. (1995a,b) surveyed for world- wide genetic variation at eight dinucleotide (FLT1, D13S118, D13S121, D13S71, D13S122, D13S197,
D13S193 and D13S124), five trinucleotide (PLA2A,
DM, SCA, DRPLA and HD) and five tetranucleotide
(THO1, CSFIR, F13A1, CW19 and LPL) repeat loci. From these surveys we selected allele size distributions from nine populations (unrelated Caucasians from the
CEPH panel; German; Brazilian Whites; Brahmins from
Uttar Pradesh, India; Sokoto from Nigeria; Benin; Bra- zilian Blacks; Japanese and Chinese) for the present application. The anthropological description of the sampled populations are given in the original surveys
( DEKA et al. 1995a,b). In Table 1 we present the sample
sizes (number of chromosomes sampled) from each of their populations for 18 loci.
For each locus, the locus-specific distances for a pair of populations were estimated by 4
( s
- S,)/
Sw,
in whichs
and S, were computed from (17) and
( 18).
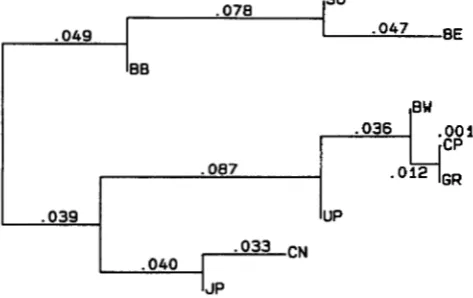
The average distance matrix was computed by taking the simple arithmetic mean of the locus-specific dis- tance matrices over the 18 loci. Table 2 shows the aver- age distance matrix for all pairs of populations. The neighbor-joining dendrogram ( SAITOU and NEI 1987) of this distance matrix is shown in Figure 1. As can be seen from this dendrogram, the average distances over all 18 loci group the populations by their major racial characteristics. The four Caucasian populations (CEPH, German, Brazilian Whites and Uttar Pradesh Brahmins) cluster together; other disjoint clusters are formed by the two Mongoloid populations (Chinese and Japanese) and the three populations of African ancestry (Sokoto Nigerians, Benin and Brazilian Blacks). The Caucasoid and Mongoloid populations cluster together first; the Africans are furthest apart.DISCUSSION AND CONCLUSIONS
The theory developed above shows that SLATKIN’S
553 Variation at Microsatellite Loci
TABLE 2
The distance matrix
GR
0.187 0.159 0.138 0.116 0.029
JP
0.238 0.217 0.160 0.150
CN
0.034 0.040 0.033
UP
0.000 0.000
BW
0.000
SO 0.317 0.342 0.231 0.228 0.194 0.183
BE 0.349 0.363 0.327 0.313 0.269 0.255 0.039
BB 0.152 0.144 0.144 0.125 0.118 0.087 0.042 0.044
CP GR BW UP CN J P
so
BEThe distance index has been computed for all pairs of the nine populations. Submatrices of distances among members of major racial groups are set in boldface type. Abbreviations as in Table 1 .
as expectations of squared differences of allele sizes (Eqs. 1 and 1 2 ) . Thus, a directional bias of size changes by mutations does not affect the linearity of the relation- ship of the expected distance with the time of diver- gence of populations.
Our derivations are carried out at a more general level than those of SLATKIN ( 1995). He derived the mutationdrift equilibrium expectations of the first two moments, while we obtain the transient (Eqs. 3 and 9 ) as well as asymptotic (equilibrium) (Equation 6 ) expressions for the distribution of allele size differ- ences, characterized by their probability generating functions. As a consequence, our theory, see for exam- ple ( 8 ) and ( 11 )
,
can also be used to study within- and between-population dynamics of allele size variation in the absence of mutation drift balance.For example, if the ancestral population was com- pletely homozygous for the locus in question, i e . , if V,
= 0, then based on ( 8 ) and ( 13) we obtain that our i n d e x i s e q u a l t o 2 B , / V , = x / [ l - e e x p ( - x / 2 ) ] - 2 , where x = t / N. Hence, 2BJ V, is less than x by a factor that depends on time of divergence expressed in units of the effective population size. If t = 5N, then 2B,/V, is less than x by a factor of 0.69; if t = 20N, then 2BJ V, is less than x by a factor of 0.90. This effect will lead to underestimation of t if equilibrium in the ancestral
so
.049 .047 BE
I
.039I
IUPI
.040I JP
FIGURE 1.-The neighbor-joining dendrogram of the nine populations based on the distance indices in Table 1.
population is assumed, but in fact it did not exist. Care- ful analysis of the consequences is beyond the scope of this paper.
In the case of within-population variability the as- ymptotic but not transient result can also be obtained using a coalescence approach (APPENDIX )
.
w e should note that our approach can also be used to prove the time-linearity of indices of GOLDSTEIN et al. ( 1995), without their assumptions of single-step symmetric mu- tations.The estimators
Sw
and S, (and consequently31,
as given by Eqs. 9a, 9b and 10 in SLATKIN (1995), are unbiased estimators of the respective parameters only when an equal number of alleles are sampled from each population. In contrast, the variance components estimators (Equations 17 and 18) used in this work are unbiased in the general case as well.Since our index is a ratio of components of variance, its sample value can be negative if
s
<
Sw.
This may occur when two populations are genetically close and within each of them the genetic variation is consider- able. Since distances between populations cannot be negative, we suggest using zero in situations when nega- tive values are obtained. This does not mean that the populations are identical, but that their differences are dominated by statistical noise.The application of the genetic distance measure shown above indicates that the index satisfactorily groups populations according to their known ethnohis- toric clusters. However, caution has to be exercised in applications when populations analyzed include some that have been historically small, or known to have gone through recent bottlenecks during their history. The genetic distance indices among them as well as those between any of these and the larger populations may not conform to linearity. This is as expected, since the constancy of the population size
( N )
is a critical as- sumption of our derivation as well as that of SLATKIN(1995).
et al.
the size fluctuations over generations can be analytically specified. Technically, one way to accomplish this is to
set N = N ( t ) in the differential or difference equation
leading to relationship ( 3 )
.
This was done for a specialcase of symmetric binomial cp( s) by CHAKRABORTY and
NEI ( 1977)
.
Time linearity of 2 B,/ V, cannot be guaran- teed any more, but for an assumed or estimated model of time change of N ( t ) [ e.g., logistic growth of N ( t ) ] ,the time of divergence can still be analytically related to 2 B,/
V,.
We should also note that pooling tandem repeat data over loci may create some problems depending on how the pooling is carried out. In this presentation, we com- puted the distance indices separately for each locus, and then took the arithmetic mean over all loci. In contrast, one could also consider estimates for Sw and
s
- Sw based on data pooled over all loci, and then construct the index of the genetic distance. For 18 loci, considered in aggregate, this alternative approach yields a dendrogram almost identical to the one shown in Figure 1. However, this may not be true in general. For example, when the eight dinucleotide, eight tri- nucleotide or five tetranucleotide loci were considered separately, these two approaches yielded considerable differences in the distance matrices as well as in the resulting dendrograms. At this stage the actual causes of such discrepancies cannot be identified, but the sam- pling variances of the estimates of Sw ands
-Sw
arelikely to contribute to this. Under the model assump- tions the ratio of (
s
- S,)/
Sw estimates a parameter that is independent of the mutation rate at a locus as well as the distribution of allelic size changes caused by mutation. This fact can be used as a rationale of taking a simple average of the distance indices over loci. A more detailed theoretical treatment of this problem requires evaluation of both the stochastic and the con- temporary sampling variance of the ratio estimates pro- posed.We thank Professor 01.1.~ NERMAN of the University of Gotheborg for providing insights underlying the derivation in the APPENDIX. This work was supported by grants GM-41399 (R.C. and D.S.) and GM- 45861 (R.D. and R.C.) from the National Institutes of Health, and DMS 9203436 and DMS 9409909 (M.K.) from the National Science Foundation and by the Keck’s Center for Computational Biology at the Rice University (M.K.) . Part of this work was carried out during M.K.’s visit at the University of Gotheborg in September 1995.
LITERATURE CITED
BOWCOCK, A. M., R.-A. LINARES, J. TOMFOHRDE, E. MINCH, J. R. KIDD
et al., 1994 High resolution of human evolutionary trees with polymorphic microsatellites. Nature 368: 455-457.
CHAKRABORTY, R., and M. NEI, 1977 Bottleneck effects on average heterozygosity and genetic distance with the stepwise mutation model. Evolution 31: 347-356.
CHAKRABORTY, R., and M. NEI, 1982 Genetic differentiation of quan- titative characters between populations of species: I. Mutation and random genetic drift. Genet. Res. Camb. 39: 303-314. C o c m w m , C. C., and B. S. WEIR, 1987 Correlations, descent mea-
sures: drift with migration and mutation. Proc. Natl. Acad. Sci.
DEKA, R., L. JIN, M. D. SHRIVER, L. M. Yu, S. DECROO et al., 1995a USA 8 4 : 8512-8514.
Population genetics of dinucleotide (dC-dA) ( d G d T ) ,, polymorphisms in world populations. Am. J. Hum. Genet. 56: 461 -474.
DEKA, R., M. D. SHRIVER, L. M. Yu, R. E. FERRELL, and R. CHAKRA- BORTY, 1995b Intra- and inter-population diversity at short tan- dem repeat loci in diverse populations of the world. Electropho- resis 16: 1559-1564.
DI RIENZO, A,, A. C. PETERSON, J. C. GARZA, A. M. VALDES, M. SLATKIN
et aZ., 1994 Mutational processes of simple-sequence repeat loci in human populations. Proc. Natl. Acad. Sci. USA 91: 3166-
3170.
EWENS, W. J., 1979 Mathematical Population Genetics. Springer, New York.
GOLDSTEIN, D. B., A. R. LINARES, L. L. CAVALLI-SFORZA and M. W. FELDMAN, 1995a Genetic absolute dating based o n microsatel- lites and the origin of modern humans. Proc. Natl. Acad. Sci.
GOLDSTEIN, D. B., A. R. LINARES, M. W. FELDMAN and L. L. C A V ~ L I - SFORZA, 199513 An evaluation of genetic distances for use with microsatellite loci. Genetics 139: 463-471.
JEFFREYS, A. J., K. TAMAKI, A. MACLEOD, D. G. MONCKTON, D. L. NEIL et al., 1994 Complex gene conversion events in germline mutation a t human minisatellites. Nature Genet. 6: 136-145. KIDD, J. R., F. L. BLACK, K. M. WEISS, I. B w s and K K. KIDD, 1991
Studies of three Amerindian populations using nuclear DNA polymorphisms. Hum. Biol. 6 3 775-794.
LI, W.-H., 1976 Electrophoretic identity of proteins in a finite popu- lation and genetic distance between taxa. Genet. Res. Camb. 28:
RUBINSZTEIN, D. C., W. A M O S , J. LECCO, S. GOODBURN, S. JAIN et al.,
1995 Microsatellite evolution-evidence for directionality and variation in rate between species. Nature Genet. 10: 337-343. SAITOU, N., and M. NEI, 1987 The neighbor-joining method: a new
method for reconstructing phylogenetic trees. Mol. Biol. Evol.
SHRIVER, M. D., L. JIN, R. CHAKRABOR~ and E. BOERWINKLE, 1993 VNTR allele frequency distributions under the stepwise mutation model: a computer simulation approach. Genetics 134: 983-993. SHRIVER, M. D., L. JIN, E. BOERWINKLE, R. DEKA, R. E. FERRELL et al.,
1995 A novel measure of genetic distance for highly polymor- phic tandem repeat loci. Mol. Biol. Evol. 12: 914-920.
SIATKIN, M., 1995 A measure of population subdivision based on microsatellite allele frequencies. Genetics 139 457-462. SOKAI., R. R., and F. J. ROHLF, 1981 Biometly. Freeman, New York. TAVARE, S., 1984 Line-ofdescent and genealogical processes, and
their applications in population genetics models. Theor. Pop. Biol. 26: 119-164.
TAVARE, S., 1995 Calibrating the clock using stochastic processes to measure the rate of evolution, pp. 114-152 in Calculatingthz
Secwts ofLqe, edited by E. S. LANDER and M. S. WATERMAN. Na- tional Academy Press, Washington, DC.
VN.DF.S, A. M., M. SIATKIN and N. B. FREIMER, 1993 Allele frequen- cies at microsatellite loci: the stepwise mutation model revisited. Genetics 133: 737-749.
WEBER, J. L., and C. WONG, 1993 Mutation of human short tandem repeats. Hum. Mol. Genet. 2: 1123-1128.
WEHRHAHN, C. F., 1975 The evolution of selectively similar electro- phoretically detectable alleles in finite natural populations. Ge- netics 80: 375-394.
USA 9 2 6723-6727.
119-127.
4: 406-425.
Communicating editor: W. J. EWENS
APPENDIX: COALESCENT DERIVATION OF THE PROBABILITY GENERATING FUNCTION P( s)
Background mathematics and relevant references for this appendix can be found in either of the two reviews, TAVARE (1984) or TAVARE (1995).
For any two alleles Xi and
4
drawn from the popula- tion at equilibrium, the time T to coalescence is expo-nentially distributed with parameter 1
/
( 2 N ) . Condi- tional on T , the number of mutation events in [ - T ,Variation at Microsatellite Loci 555
ter 2 v ~ . Therefore, the probability generating function of the number of mutation events is equal to
with pas in Equation 7. This corresponds to the geomet- ric distribution. The mutation process in each allele
separately can be viewed as a random walk with step size being a random variable with probability generating function ‘p( s). The contribution of each mutation event to -