Statistical Study on the Distribution and
Concentration of Urban Population
R.Selvam
1, A.Saranya
2Assistant Professor, Department of Statistics, Government Arts College (Autonomous), Salem, Tamil Nadu, India1 M.Phil Research Scholar, Department of Statistics, Government Arts College (Autonomous), Salem, Tamil Nadu,
India2
ABSTRACT: The distribution and concentration of urban population has been studied by Percentage method and Gini‟s concentration ratio using Pareto model. In this article urban population of all districts in Tamil Nadu state as per census 2001 and 2011 were considered for the empirical result. The urban population of districts had moved into the district size class 1541350 – 4700000, when the time is increased. The percentage of the level of urbanization is 44.04% in 2001 census and 48.45% for 2011 census. The urban population had gradually increased from 44.04% in 2001 to 48.45% in 2011. This indicates that the increase is 1.1 times for the last ten years and the Gini‟s concentration ratio of urban population in 2001 census is 0.1448 and for 2011 census 0.2205. It indicates the low concentration and even distribution of urban population in both the census 2001 and 2011, but the increase in urban population of all the districts was significant in Tamil Nadu State.
KEYWORDS: District Size Distribution, Gini‟s concentration ratio, Maximum Likelihood Method, Pareto Model, Percentage method, Urbanization.
I. INTRODUCTION
The population of the region are dichotomized with respect to the residential status such as rural and urban. Urbanization is the process of growth with respect to changes in size and structure of the urban population. Urban population refers to the people living in urban areas as defined by National Statistical Office. It has very high density of population. The value for urban population in Tamil Nadu was 27483998 as of 2001 census and 34949729 as of 2011 census. According to 2011 census, of the 7.21 crore Tamil Nadu population, 3.49 crore stay in Urban areas, but 2.75 crore stay in Urban area out of 6.24 crore population as per 2001 census. This indicates that the urban population are having increasing tendency over the span of ten years in Tamil Nadu State. This motivates to propose the Statistical study on the distribution and concentration of urban population using the percentage method and gini‟s concentration ratio based on Pareto model. The revenue administrative units are described as districts. Distric
t
size is the population of the District. District size distribution is the distribution of District with respect to their population. District size undergoes changes over time and space. The growth of urban population attracts Demographers, planners, etc to study the changes in size and the structure of the urban population. R.B. Bhagat and soumya Mohanty (2009) in this paper, Emerging pattern of urbanization and the contribution of migration in urban growth. R.B.Bhagat (2011) was studied Emerging pattern of urbanization in India. None of the above study analyse the distribution and concentration of urban population in the districts of Tamil Nadu state.II. SCOPE OF RESEARCH
III. METHODOLOGY
The percentage method and Gini‟s concentration ratio using Pareto model have been employed to study the distribution and concentration of urban population.
3.1. PERCENTAGE METHOD
Percentage of change of urban population = Urban Population
National Population x 100
3.2. GINI’S CONCENTRATION RATIO
The Gini‟s concentration ratio named after its originator Gini (1912) is twice the area of concentration between the Lorenz curve and the forty five degree line of perfect equality. Gini co-efficient summarises an entire distribution with a single value. It indicates the overall degree of inequality of the distribution. The Gini‟s concentration ratio lies in between zero and one. Zero imply even or uniform distribution of urban population / perfect equality and one represents a more uneven distribution/ perfect inequality of urban population in all the districts. Lower the value of this ration implies a more uniform distribution of urban population and higher the value of this ratio imply a more uneven distribution. In the present work Gini‟s concentration ratio represents how well the number of districts is distributed among the size of urban population of districts (the level of concentration of urban population). A method of developing Gini‟s concentration ratio is described with Pareto model.
3.2.1 PARETO MODEL
The Pareto distribution was first proposed as a model for the distribution of income. It is also used as a model for the distribution of city population in the given area. The Pareto distribution has been described as follows
The district size (x) is assumed to follow Pareto distribution f(x: a), where f(x: a) is described as, f (x: a) = 𝑎𝑘𝑎
𝑥𝑎 +1 , a > 0 ; x ≥ k
Where, k is the threshold district size. Parameters „a‟ and „k‟ are estimated by using the method of Maximum likelihood (Rao C.R.1973) and obtained as
𝑎 = log 𝑥𝑖
𝑛 − log 𝑘
−1
𝑘 = min
𝑖≤1 𝑥𝑖
Gini‟s concentration ratio for district size using Pareto model was described as,
𝜌 = 1
(2𝑎 − 1)
IV. EMPIRICAL RESULT
Table 1. Distribution of Urban Population (as per census 2001)
Class Interval No .of districts Urban Population Percentage of urban population District size Cumulative percentage of urban population
70000-641350 14 4789154 17.4 355675 17.4
641350-941350 5 3618292 13.2 791350 30.6
941350-1241350 3 3427143 12.5 1091350 43.1
1241350-1541350 6 8485652 30.9 1391350 74
1541350-4700000 2 7163848 26 3120675 100
Total 30 27484089 100
National population = 62405679
Percentage change of urban population = 44.04%
Table 2. Distribution of Urban Population (as per census 2011)
Class Interval No. of districts Urban population Percentage of urban population District size Cumulative percentage of urban population
70000-641350 11 3835520 11 355675 11
641350-941350 7 5463961 15.6 791350 26.6
941350-1241350 2 2137121 6.1 1091350 32.7
1241350-1541350 3 4394052 12.6 1391350 45.3 1541350-4700000 7 19119075 54.7 3120675 100
Total 30 34949729 100
National population = 72138958
Percentage change of urban population = 48.45%
0 20 40 60 80 100 120
0 1000000 2000000 3000000 4000000
P
er
ce
n
tage
of
Ur
b
an
pop
ul
at
ion
of
D
istr
ic
ts
Urban Population of Districts
2001
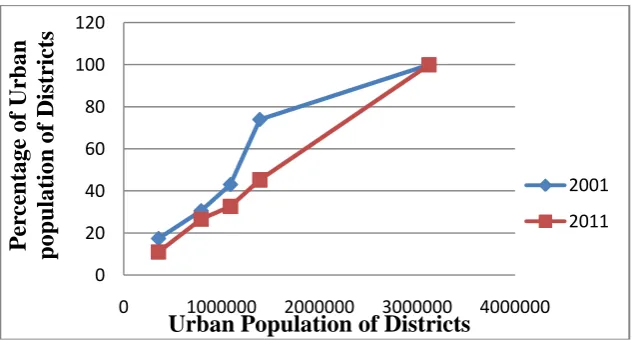
The 2001 curve is not similar to 2011 curve in shape. The percentage of first, second, third, and fourth class districts are decreased. However the population of fifth class districts increased from 26% of total population in 2001 to 54.7% in 2011. The cumulative percentage of first, second, third, and fourth class districts and fifth class districts in 2011 were smaller than those in 2001. This means that the urban population of districts had moved into fifth class (1541350 - 4700000) as the time increased.
Table 3. Empirical District Size Distribution for Urban Population (as per census 2001)
District size Interval
No. Of District
70000-641350 15
641350-941350 5 941359-1241350 4 1241350-1541350 5 1541350- 4700000 1
The estimates of the parameter and Gini‟s concentration ratio are obtained as follows The estimate of the parameter is,
𝑎 = 174 .1217
30 − 5.5511
−1
= 3.9526 Gini‟s concentration Ratio, ρ = 0.1448
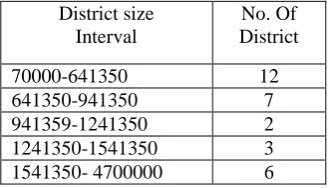
Table 4. Empirical District Size Distribution for Urban Population (as per census 2011)
District size Interval
No. Of District
70000-641350 12
641350-941350 7 941359-1241350 2 1241350-1541350 3 1541350- 4700000 6
The estimates of the parameter and Gini‟s concentration ratio are obtained as follows The estimate of the parameter is,
𝑎 = 177 .3734
30 − 5.5511
−1
= 2.7678 Gini‟s concentration Ratio, ρ = 0.2205
V. DISCUSSION
VI. CONCLUSION
The empirical result on the distribution and concentration of urban population in districts of Tamil Nadu state has been studied using Percentage method and Gini‟s concentration ratio based on Pareto model. In this study it has been found that at first, the urban population of districts had moved into the district size class 1541350 – 4700000 when the increased. Secondly the Gini‟s concentration ratio of urban population in 2001 census is 0.1448 and 2011 census the concentration ratio is 0.2205. This implies more even distribution of the population of urban area in the districts of TamilNadu state for 2001 and 2011 census,but there is more concentration of the size of urban area of the districts in 2011 than 2001 census.
ACKNOWLEDGEMENT
It is with utmost pleasure that we thank to Dr. G. Venkatesan M.Sc., Ph.D., Associate Professor and Head, Department of Statistics, Government Arts College (Autonomous), Salem – 7, Tamil Nadu, India, for his immense help and continuous support to complete this work. The author thanks the referees and editor for constructive suggestions that have improved the content and presentation of manuscript to publish in this journal.
REFERENCES
[1] Asis Kumar Chattopadhyay and Anuj Kumar Saha: “Demography Techniques and Analysis”, Viva Books Private Ltd, PP. 1-14, (2012).
[2] Bhagat, R.B. and Mohanty, Soumya: “Emerging Pattern of Urbanization and the Contribution of Migration in Urban Growth in India”, Asian
Population Studies, PP. 5 – 20, (2009).
[3] Bhagat, R.B.: “Emerging Pattern of Urbanization in India”, Economic and Political Weekly, Vol. 46, No. 34, Aug. 20-26, PP 10-12, (2011).
[4] Brennan, Ellen: “Population, Urbanization, Environment, and Security: A Summary of the Issues”. Washington, D.C: Woodrow Wilson
International Center for Scholars (Comparative Urban Studies Occasional Papers Series, 22) (1999).
[5] Chandana R.C, “Geography of Population: Concepts, Determinants and patterns”, Kalyani Publishers, New Delhi, PP.379, (2007).
[6] Kothari, C.R, “Research Methodology, Methods and Techniques” (2nd ed), New International (P) Ltd, Publisher, New Delhi, (2010).
[7] Ramachandran, R.: “Urbanization and Urban System in India”, Oxford University Press, New Delhi ,(1992).
[8] Renganathan. B and Selvam.R, “A Study on Concentration of Rural Taluk Population in Tamil Nadu State”, International Journal of Innovation and Scientific Research, Vol. 10 N0.2 PP. 476-491, (2014).
[9] Shryock, Elizabeth A. Larmon, Jacob S. Siegel “The Methods and Materials of Demography”, Volume 1, Washington D.C. USA Department of commerce publication. PP .179, (2004).
BIOGRAPHY
Mrs. R. Selvam, M.Sc.,M.Phil., is currently an Assistant Professor, Department of Statistics, Government Arts College (Autonomous), Salem-636007. Prior to her recent appointment at Govt. Arts College (Autonomous), Salem-7, she was a Lecturer in Statistics at various colleges affiliated to Periyar University, Salem, Tamil Nadu, India. She received her M.Sc and M.Phil from Annamalai University, Chidambaram, Tamil Nadu and India and her Ph.D programme is going under process. In 1993, she has been awarded „The Sir Norman Strathic Prize‟by Annamalai University for her excellence in academic. She has teaching experience in Statistics of more than 15 years. She has presented research papers in National and International conference, National level Seminar and National Workshop. She also published research paper in International Journal of Innovation and Scientific Research. Her current research focus is in the area of Mathematical Demography. She is currently working on the study about the concentration of rural Taluk size using probabilistic model.