CENTRE FOR
ADV
ANCED
SP
A
TIAL
ANAL
YSIS
W
orking Paper Series
Paper 49
MULTI-DIMENSIONAL
MODELLING FOR THE
NATIONAL MAPPING
AGENCY
Centre for Advanced Spatial Analysis
University College London
1-19 Torrington Place
Gower Street
London WC1E 6BT
[t] +44 (0) 20 7679 1782
[f] +44 (0) 20 7813 2843
[e]
[email protected]
[w] www.casa.ucl.ac.uk
http//www.casa.ucl.ac.uk/working_papers/paper49.pdf
Date: May 2002
ISSN: 1467-1298
© Copyright CASA, UCL
Multi-dimensional Modelling for the National Mapping Agency
Sarah Louise Smith
Multi-dimensional Modelling for the
National Mapping Agency
A Discussion of Initial Ideas, Considerations, and Challenges
Sarah Louise Smith [email protected]
Ordnance Survey
Research Unit Romsey Road Southampton United Kingdom
SO16 4GU Tel: (+44) 02380 305009
______________________________________________________________
Abstract
The Ordnance Survey, the National Mapping Agency (NMA) for Great Britain, has recently begun to research the possible extension of its 2-dimensional geographic information into a multi-dimensional environment. Such a move creates a number of data creation and storage issues which the NMA must consider. Many of these issues are highly relevant to all NMA’s and their customers alike, and are presented and explored here.
This paper offers a discussion of initial considerations which NMA’s face in the creation of multi-dimensional datasets. Such issues include assessing which objects should be mapped in 3 dimensions by a National Mapping Agency, what should be sensibly represented dynamically, and whether resolution of multi-dimensional models should change over space.
This paper also offers some preliminary suggestions for the optimal creation method for any future enhanced national height model for the Ordnance Survey. This discussion includes examples of problem areas and issues in both the extraction of 3-D data and in the topological reconstruction of such. 3-D feature extraction is not a new problem. However, the degree of automation which may be achieved and the suitability of current techniques for NMA’s remains a largely unchartered research area, which this research aims to tackle.
The issues presented in this paper require immediate research, and if solved adequately would mark a cartographic paradigm shift in the communication of geographic information – and could signify the beginning of the way in which NMA’s both present and interact with their customers in the future.
________________________
Note:
Introduction
The Ordnance Survey1 currently holds a strong position in the GB market, and is the leading
supplier of 2-D geographic information. In September 2001 a new flagship product was released - OS MasterMap™ - the nature of this product represents the changing need and demands of an increasingly global market. OS MasterMap™ is based on object-oriented technology. It is a fully polygonised, topologically structured vector data-set representing a 2-dimensional view of Great Britain. This cartographic representation consists of various themes of geographic information; including the extent of buildings, roads, land and water. Each feature within the dataset has a unique topographic identifier (TOID) which facilitates the linkage of third party data sets with OS MasterMap™.
However, despite this utility OS MasterMap™ is a 2-dimensional product. Increasingly planners, telecommunications companies, architects and environmental consultants are requiring three-dimensional and four dimensional (temporal) data in order to model both the urban and the peri-urban environments. These models are then used in: urban regeneration; tourism; the internal and external visualisation of the built environment; telecommunications cell planning; assessment of noise, air and other pollution; environmental impact assessment; heat loss and carbon budget calculation and monitoring; urban facility location; and virtual reality (VR) gaming. In addition to such use in detailed analysis, city councils and suppliers of geographic information require city model heights for visualisation of the urban environment for tourists and other ‘casual’ users of geographic information.
Currently there is no height layer in OS MasterMap™, however the OS does supply a bare-earth model in both contour and grid format. As such there is a great need for the National Mapping Agency to research potential methodologies for the development of its pre-existing 2.5D height model into the third and fourth dimensions and to incorporate this within OS MasterMap™. This necessitates researching the following topics:
1. The evaluation of different sources of data which may be used to populate the future height model
2. The creation of 3-D topological structures to recreate features extracted from imagery
3. An evaluation of the best storage options and the creation of a design for a suitable 3-D geospatial database
Research presented in this paper concentrates on the methodologies used in the first two of these research topics2. A preliminary evaluation of the suitability of a variety of data sources
for the extraction of buildings, vegetation, and street furniture for the National Mapping Agency is offered. This includes a theoretical discussion regarding the required content and generalisation of the real world objects to be included within the model. An initial topological reconstruction of these objects is briefly suggested, along with a discussion of the challenges and issues which this has produced to date.
The aim of the research presented in this paper is to provide a set of optimal creation methods for a future National Height Model which will include many objects and features which are not currently mapped. A discussion of the inclusion of objects and features is offered in this paper.
1 The National Mapping Agency for Great Britain
2 This constitutes the major part of the 1st Year of PhD which is currently being undertaken at
Background: Introduction to the Current Remit and Requirements of the Ordnance Survey
Ordnance Survey provides topographic mapping of Great Britain, which comprises England, Scotland, and Wales. It is a government agency which covers operating costs through sales of products, services and copyright licenses – and currently acts as a Trading Fund. The Ordnance Survey provide mapping of GB which is supplied as either vector or raster data, these products are traditionally used in geographic information (GI) and CAD (computer-aided design) systems. The organisation has the task of providing an unambiguous geo-referencing and co-ordinate positioning framework for the nation. In order to achieve a high degree of reliability and validity such standards depend in turn upon a precise co-ordinate positioning standard, which is now provided by the National GPS Network, the National Grid Transformation, and the National Geoid model.
Recent changes within the Ordnance Survey have been widely publicised over the last 15 months. The launching of OS MasterMap™, with its the associated re-engineering of the National Topographic Database into a seamless, topologically explicit, object-oriented structure has significantly increased the organisation’s ability to address the commercial need for true geographic information (GI) and location-based-services (LBS).
However, with the aforementioned move into the highly competitive realm of GI and LBS the Ordnance Survey faces new challenges, including new, dynamic competition. The organisation must demonstrate its willingness to enter into new markets and exploit different options for the display of data and information, one significant example of which being the representation of the third and the fourth dimensions.
3-D modelling at Ordnance Survey
The importance of displaying data and information in three dimensions has been recognised for centuries as a tool for aiding human understanding and visualisation. Recently, there has been a significant increase in the demand for 3D data from telecommunications companies, planners, local and central government, insurance and environmental companies and other users of spatial data for use in 3-D models of the real world which are used in order to plan and monitor services and impacts. This augmented demand has been mirrored by an increase in 3-D data capture techniques and visualisation methodologies, and in the number of companies and organisations supplying 3-D products in the location-based-services market. This market requirement has stimulated a variety of research projects within the Ordnance Survey over the last year. This research is focused on identifying possible extensions of the existing 2-dimensional national dataset to satisfy requirements for 3-D in the future. Indeed the aim of this research is to advance current concepts as far as possible into a ‘blue skies’ environment.
Methodologies for the Creation of an ‘Advanced’ National Height Model
Having discussed the remit of the GB National Mapping Agency and the drivers and requirements for multi-dimensional information, the focus of this paper now turns to a discussion of the issues and considerations that a multi-dimensional environment poses.
Some Topics for Consideration
1. Determination of Urban Objects for Inclusion
The most complex environment to map in 3 and 4 dimensions is that of the urban and peri-urban region 3. This comprises dynamic objects, changing through time and space. Whilst it is
accepted that static objects such as roads and buildings, and more dynamic objects such as urban vegetation form the fundamental building blocks of the environment, it must be recognised that the city environment constitutes much more than these objects – such as people, companies and organisations, moving traffic, congestion, road works. In addition and just as importantly, the city constitutes processes and objects which are more abstract – such as the flow of money, job vacancies, land ownership, and noise. If the role of the National Mapping Agency is to represent the real world, then is it justifiable to follow the traditional 2-D mapping principle of recording only static objects – would such a model suffice in the 3-2-D market?
The choice of which objects should be included in a 3-D model is difficult. There are two ways in which such a determination can be made. Firstly, the decision could bepurely driven by technological possibilities and opportunities. This is not optimal, as the derived model may be deemed to have too low a specification, or conversely to be overly complex (and therefore expensive) for potential users. Alternatively, the decision as to which objects to include could be application driven, which has the obvious advantage that users can identify tasks and objects which they commonly deal with, and it would seem logical to rely on their knowledge and experience. Unfortunately, rarely can users identify revolutionary new requirements as they are grounded in organisation, financial and market problems which require immediate attention rather than blue-skies/futuristic thinking. This really constitutes the first consideration for NMA’s during the transfer to the multi-dimensional environment – and as such underpins all future definition of the dataset.
Indeed, a balance between the two approaches must be established. User applications (current and future) must be acknowledged in order to offer the most relevant advanced solution in modelling technology. This solution must also push forward the boundaries of what is technically possible so as to advance research within academia.
In terms of identifying user requirements for any future 3-D model here, there are a number of problems – many of which are specific to the third dimension. Academic research into 3-D modelling potentials has evolved significantly over the last 20 years. However, these developments and advances have largely failed to penetrate the commercial cartographic environment with the result that here the 3-D modelling research area is relatively new and in many respects the commercial applications of emerging technology remain relatively embryonic. As such, user needs and activities are extremely difficult to identify. This issue and its effects must be investigated in more detail by NMA’s if they wish their research to be directed towards identifying real user needs.
It is of significance, therefore, to note that there have been a number of studies of objects of interest in urban/peri-urban areas. These are discussed in more detail below. Clearly, the
3It is beyond the scope of this paper to discuss the definition of the urban and peri-urban
objects of interest in urban areas will change with respect to the application. Yet despite this, there are a number of generic objects which are likely to be a requirement for most models.
It is clearly exemplified in the literature and commonly understood that the most important objects in the urban environment are buildings (Gruen and Dan 1997, Kofler and Gruber 1997, Tempfli 1998b). Indeed, buildings constitute an important part of the 2-D urban map and their significance in any 3-D extension is of no surprise. However, it is significant to note that the characteristics of a 3-D building would be considerably more complex than those of a 2-D footprint, with additional attributes such as building land-use on different floors, building material etc to store in the database. In addition the required resolution of the 3-D building may be significantly higher than that of its 2-D predecessor.
Despite the importance of buildings, a model which only represents buildings would satisfy neither those users requiring realism/visualisation nor those interested in the geometric properties of the objects for urban environmental modelling (for example for mobile phone wave propagation). It is anticipated that vegetation, and additional street ‘clutter’ are also of fundamental importance. Perhaps, therefore, a classification or typology for urban structures is required.
2. What types of objects should be mapped?
The objects identified by user applications and technological advances may be grouped into a number of classes – significantly not all of these groupings will correlate with the OS classification of what should be mapped (either current or in the future).
Most objects of interest will have a spatial extent and a physical presence and as such may be grouped into a ‘topographic’ object class. However, a number of users in previous studies have also highlighted the importance of objects with no spatial extent (Zlatanova, 2000). To date such objects have not been mapped by the Ordnance Survey, whose business model encourages non-spatial objects to be mapped by their business partners. However, it should not be assumed that this will continue to be the case indefinitely . The classic example of the non-spatial object in the urban environment is that of the title deed of a property – which is really a phenomenon which has no physical presence. Currently only the building polygon to which the deeds belong would be mapped by Ordnance Survey, the title-deed attribute could be accessed through 3rd party TOID (unique identifier) linkage to, for example, HMLR (Her
Majesty’s Land Registry). There is a growing need however for the title deed in this example to be an object of interest in its own right (Zlatanova, 2000). Objects of this resolution fall beyond the scope of this research. Whether the National Mapping Agency should develop the use of the TOID and make such abstract phenomena objects is both a philosophical and a business question which should necessarily be tackled elsewhere. Suffice here to note it as a future issue for consideration.
3. Should NMA’s map movable/moving objects?
realism of the model. This constitutes an important issue to be resolved by NMA’s in the near future.
4. Can we classify objects in the urban environment?
For the purpose of creating a 3-D urban/peri-urban model it can be considered that there are four types of possible objects: topographic, organisational, environmental, and abstract. Some example membership of these groupings is offered below:
As can be seen from the table above, the most relevant objects of interest to both the Ordnance Survey and to the 3-D model are the topographic objects, with some relevance (probably future) in organisational objects, such as the movement of people in the urban environment. It would be most interesting to exploit recent advances and marry techniques for advanced positioning (using RTK-GPS), in a mobile environment (eg. Blue Tooth) with virtual reality and computer graphics advances in representing human bodies (avatars) which can move through a virtual world, speak and interact with other virtual persons. This latter technology is already becoming the norm in Web chatrooms, where there are often libraries containing virtual identities which participants may adopt and adapt to their requirements. If National Mapping Agencies are to meet user expectations in 3 and 4-D mapping, it follows that it may soon be applicable to offer users such virtual identities and to allow them to interact on another level with the map/model and to create user profiles for model content and visualisation. Just as user expectations in the 3-D model have been raised through generations of advanced computer graphics in the gaming industry, so too will future generations expect/anticipate the exploitation of avatars to aid them in their interaction with
None Secondary/tertiary, most boundaries do not have a height/3-D nature to them Although land ownership boundaries could do. Primary/secondary: Particularly Land ownership/use on different floors Primary
Relevance to 3-D modelling
None
These are not considered objects, but are attributes of other geometric objects Primary relevance
to OS mapping Tertiary, not currently relevant, but future inclusion of people object may be of some interest Primary current and
future relevance
Relevance to OS mapping criteria Thematic Geometric Thematic Geometric Thematic Geometric Thematic Domain Characteristics
•Title deeds
•Taxes
•Incomes of companies
•Pollution boundaries
•Weather fronts
•People •Companies •Tenants •Land-owners •Administrative boundaries •Buildings •Pedestrian/street
•Traffic networks
•Telecommunications
•Vegetation
•Public Amenities Eg. Post box
•Street clutter: traffic Lights, crossings Traffic calming objects Some Example Real Objects Intangible Environmental Organisational Topographic
Groups of Real Objects
Where: primary = of fundamental importance, secondary = strong potential for future inclusion,
and understanding of the map. This marrying of technologies is a logical extension of this research.
5. Discussion of Resolution and Generalisation Required
Resolution here means the smallest level of detail which can be represented geometrically. The issue of resolution is common in 2-D mapping, however an extension to the third dimension is accompanied by an increasing complexity in requirements for detail. For example, the resolution of a 2-D building is most commonly simply a case of determining how generalised the shape of the building outline/footprint should be. In 3-D there is the additional complication of ascertaining whether windows, building facades, balconies, satellite dishes and aerials, and chimneys for example should be included in the model. Similarly, a tree might be constructed using a number of single, solid primitives, or by a 3-D symbol.
5.1 The Issue of Horizontal and Vertical Object Resolution
On the 2-D map, resolution in the urban area will generally remain constant. This cannot be assumed in the 3-D model. For example, in the detailed urban model for planning, one may wish to emphasise the importance of certain buildings. In this instance commercial buildings may be represented by low scale block models, whilst the more significant residential areas may show highly detailed resolution renderings. But the changes in resolution for 3-D models may be even more complex than this. Instead of resolution changes from area to area, or from building to building, there may also be a change of resolution required in the same building object. Indeed, one may wish to model the ground floor of buildings in the central urban area (mostly businesses and complex shop windows) at a high resolution (particularly for visualisation and realism purposes), whilst the upper levels of the same building (mostly residential apartments and storage areas) may be modelled at a much lower resolution.
This leads neatly into another aspect of 3-D modelling which necessitates discussion here: are the geometric objects in the model simple objects, or are they composite super-objects? In other words, are the buildings simple volygons (3-D polygons with volume) or are the buildings made up of other volygons or boxes making up each floor or indeed each room in a building? It is considered here that for the National Mapping Agency, the internal structure of a building in the urban environment should not be mapped, although future requirements may require extension into this area. It is proposed here that the buildings should be considered simple objects, except in the central urban environment (and some other exceptions such as industrial estates and local shopping areas) where there is significantly differing land-use on different floors of the buildings. In this instance there would be the creation of composite objects to represent the changes in land-use.
This paper has thus offered a detailed discussion of the preliminary issues which NMA’s must consider during the planning stages for the movement in a multi-dimensional geographical environment. It is perhaps also useful to briefly look at the ways in which research into this area may be taken a stage further, and to suggest a preliminary methodology for the initial creation of a 3-D model. This discussion deals with both the extraction of 3-D information and with the topological restructuring of such.
6. The issue of 3-D feature extraction
The issue of how to extract 3 and 4-dimensional data is a fundamental one for NMA’s. Traditional methods used for 2-D mapping are unlikely to be deemed as suitable for the transition to 3 and 4-D, and it is suggested here that NMAs may need to look at new technologies and data sources to fulfil customer requirements.
Traditionally feature extraction has been dominated by the use of photogrammetric techniques. These are costly to collect and to interpret, and consequently there has been a recent trend towards using less expensive, less labour intensive sources. But to date, this option has not been fully explored by National Mapping Agencies. These have tended to be derived from airborne platforms, such as Synthetic Aperture Radar (SAR) or Light Detection and Ranging (LiDAR). Improved planimetric and vertical accuracies in these airborne sources has facilitated their popularity, as has the increasing number of companies supplying such data at competitive prices.
Pylons, generators (permanent) Electricity features
Telephone pylons, mobile phone masts, connections to buildings Telecommunicatio
ns
Including extent, significant vegetation etc Parks
Traffic lights, pedestrian crossings, street bollards, sleeping policemen Traffic calming
measures
Post boxes, street lights, telephone boxes, street signs (and content) Street amentities
Possibly including some representation of drive-restricted information Transport
networks
Trees (including heights of canopy, trunk height etc) Possibly tree type
Leaf Density (some kind of approximation for line-of-sight analysis) Vegetation in both
the urban and peri-urban/rural environment
Parking lots, street extent Pedestrian areas,
including streets
Road-bed, curb? Roads
Outlines and columns Bridges
Roof, footprint, walls
Possibly: windows, facade ornaments
Monuments of interest. Time in the history of urban development likely to be important.
Buildings
Resolution Real Objects
Pylons, generators (permanent) Electricity features
Telephone pylons, mobile phone masts, connections to buildings Telecommunicatio
ns
Including extent, significant vegetation etc Parks
Traffic lights, pedestrian crossings, street bollards, sleeping policemen Traffic calming
measures
Post boxes, street lights, telephone boxes, street signs (and content) Street amentities
Possibly including some representation of drive-restricted information Transport
networks
Trees (including heights of canopy, trunk height etc) Possibly tree type
Leaf Density (some kind of approximation for line-of-sight analysis) Vegetation in both
the urban and peri-urban/rural environment
Parking lots, street extent Pedestrian areas,
including streets
Road-bed, curb? Roads
Outlines and columns Bridges
Roof, footprint, walls
Possibly: windows, facade ornaments
Monuments of interest. Time in the history of urban development likely to be important.
Buildings
Recently, improvements in the resolution of some satellite sources have also led to these becoming a viable option for feature extraction.
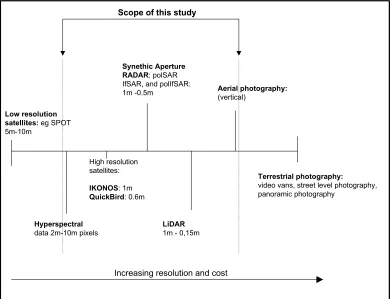
Features and objects, albeit at different scales can be identified from any of the following data sources shown in the diagram below. The diagram also shows the scope of the sources to be used in this research. This ‘window’ of sources is considered here to represent the most viable options for the derivation of feature height as required by the National Mapping Agency.
Low resolution satellites: eg SPOT 5m-10m
High resolution satellites:
IKONOS: 1m
QuickBird: 0.6m
Hyperspectral
data 2m-10m pixels
Synethic Aperture RADAR: polSAR IfSAR, and polIfSAR: 1m -0.5m
LiDAR
1m - 0,15m
Aerial photography:
(vertical)
Terrestrial photography:
video vans, street level photography, panoramic photography
Increasing resolution and cost Scope of this study
Figure 1: Scope of image sources for this research
The development of techniques for the extraction of features from aerial, and more recently space-borne, imagery is not a new problem. A large body of literature exists describing research over the past two decades which has been focused on achieving a fully automated identification and extraction procedure for two-dimensional objects. Recently, however, there has been a change in emphasis in the feature extraction academic community. The goal of research over recent years has been the quantitative three-dimensional measurement of objects found in two dimensional image space, in order to facilitate the construction of 3-D urban models. This is a difficult problem, and a solution has yet to be established. The main problems causing resistance may be defined here as occlusion, large parallax ranges, and feature textures which are not amenable to the matching process. These are continuing challenges, some of which will be addressed within the scope of research being undertaken at the Ordnance Survey.
(Agouris et al, 1998 in Bellman and Shortis, 2000). Indeed, many of the techniques and algorithms proposed to date require some form of operator guidance in order to determine areas of interest or they require that the operator provides seed points on features. It is proposed here that this issue and an identification of likely sources of error involved with such must be conducted with some urgency by NMA’s.
7. Some Issues Regarding Topological Reconstruction of the Extracted Features
Having identified which objects should be mapped multi-dimensionally, and subsequently identifying issues regarding the extraction of these objects there should be some discussion here regarding problems associated with topologically restructuring the data.
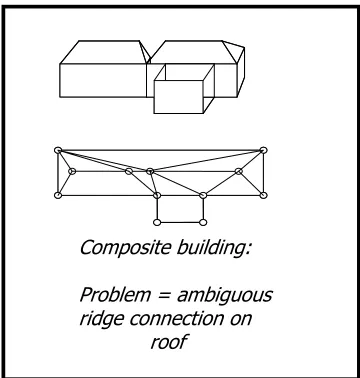
Simple buildings with basic, easily identifiable roof morphologies are not difficult to topologically reconstruct. However, difficulties arise when dealing with more complex buildings which may consist of several heights and may be adjoined to a number of other structures. Such as that shown below:
Figure 2. Topology of complex urban structures
In this example, the topological reconstruction shown removes the structure of the gap between the two buildings (example based on DERA et al). Methods of resolving issues such as this must be investigated. Such issues are currently being researched by the Ordnance Survey within the remit of the author’s PhD studies.
The following section takes the form of a series of questions/issues which require solving. The aim here is not to provide topological solutions at this stage, but to identify areas of required future research.
(i) The topological representation of vegetation and natural objects needs to be investigated in some detail – this raises questions such as whether the top and base of canopy should both be represented and if so should this be done using concentric polygons as shown below?
Composite building: Problem = ambiguous ridge connection on
Figure 3: Heights of individual vegetation
In the figure above, the inner polygon represents height 1, which is the highest point of the canopy.
(ii) Another issue is whether areas of vegetation containing sub-areas of substantially differing canopy heights be represented in separate adjoining polygons? Does this create any problems for database storage? This requires further research.
(iii) An additional consideration is the issue of the representation of sloped buildings. Should these be structured as smooth planar faces, such as that shown below (a), or should these be generalised into blocks (b). Do these different representations create substantially different storage requirements?
(a) (b)
Figure 4: Sloping features
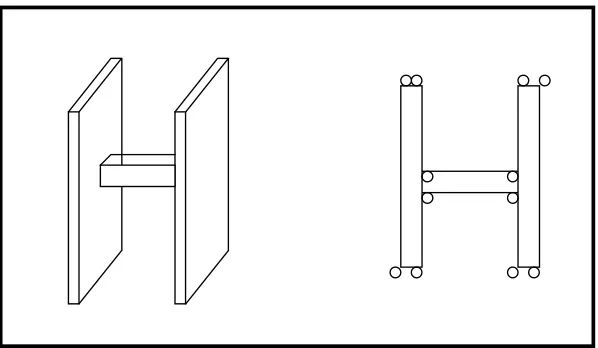
(iv) Similarly, there is the issue of the representation of elevated structures, such as that shown below.
Height 1
Figure 5: Elevated Structures
In the example above, the elevated structure is represented by the central polygon which is in fact two separate polygons with the same x, y co-ordinates, but differing z-values. NMA’s need to investigate whether indeed this is the optimal method for topological reconstruction for such features.
All of these topological issues and questions require future research, and it is suggested here that this is required relatively urgently.
Conclusions
This paper has highlighted a wide range of issues which National Mapping Agencies must consider when researching multi-dimensional extensions of pre-existing 2-D datasets. The aim has been to highlight issues and to promote discussion of such.
A number of suggestions have been made in this paper, and are summarised below:
• It is accepted here that there is great merit in the modelling of both spatial and non-spatial objects for a wide range of applications. Particularly given that many objects which are currently considered to be non-spatial may well ‘become’ spatial in future. However, for the purpose of creating a 3-D model, which is advancing the current 2-D OS MasterMap™ dataset, only spatial topographic objects will be created. The non-spatial objects currently fall outside of the remit of what should sensibly currently be mapped by the National Mapping Agency. The mapping/modelling of building interiors and the creation of higher resolution spatial and non-spatial objects, such as the internal location of facilities or even the contents of a filing cabinet, could act as a logical extension of this research. Such a project would benefit from the inclusion of the mapping of individuals within a building (whether this be based on actual location, or intended location via information held within an electronic calendar). Despite the fact that non-spatial objects will not be included within this model, it is recognised here that future incarnations of 3-D GIS should in fact be able to handle both spatial and non-spatial objects if they are to meet many of their user’s expectations.
basis of which many potential urban objects were precluded from incorporation within the model.
The following were also suggested:
• NMA’s should spatially vary resolution both horizontally and vertically within a multi-dimensional model
• Metadata regarding generalisation required for resolution changes should be supplied as an integral part of any future height model
• Serious research should be conducted into assessing which data sources are most appropriate for 3-D data extraction.
• More use should be made of new, cheaper, potentially more efficient data sources.
In addition to the above recommendations, a number of unresolved issues have been identified, again these are summarised below.
• What are the optimal methods for topologically reconstructing complex buildings and vegetation?
• How should sloped features best be represented?
• How can elevated structures be both reconstructed and modelled?
• What are the data storage implications of the different options available?
The resolution of these issues is a pre-requisite for the creation of multi-dimensional models for National Mapping Agencies. This research is currently being undertaken by the Ordnance Survey, and initial results appear promising.
Should the issues and questions raised in this paper be resolved then the transition into a multi-dimensional cartographic environment would become a reality, and we would witness a paradigm shift in National Mapping and in the communication of Geographical Information in general. It is suggested here that this shift is essential for the viable survival of National Mapping Agency cartography and GIS alike. Therefore, the importance of the issues presented in this paper cannot and should not be under-rated.
__________________________________
References
Agouris, P., Gyftakis, S., and Stefanidis, A (1998) Using a Fuzzy Supervisor for Object Extraction within an Integrated Geospatial Environment, In the International Archives of Photogrammetry and Remote Sensing, Vol. XXXII, Part III/I, Columbus, USA
Bellman, C., and Shortis, M. (2000) Early Stage Object Recognition Using Neural Networks, International Archives of Photogrammetry and Remote Sensing, Vol XXXIII, Supplement B3, Amsterdam 2000
DERA, University of Bristol, RAL (no date) Unpublished report: Technical Working Party on Mobile and Terrestrial Propagation Proposed Format for 3-D Geographical Datasets (Ver 2.1)
Kofler, M. And Gruber, M (1997) Toward a 3D GIS database, GIM, vol. 11, no.5. In Zlatanova, S (2000) 3D GIS for Urban Development, ITC, Netherlands
Mesev T V and Longley, P A (2001) Measuring the ‘urban’; measuring and modelling in a regional settlement hierarchy. In Tate, N.J. and Atkinson, P.M (eds) (2001) Modelling scale in geographical information science. Chichester, Wiley, 53-67.
Tempfli, K (1998b) Urban 3D topologic data and texture by digital photogrammetry, Proceedings of ISPRS, March-April, Tempa, Florida, USA, CD-ROM