Analysis of Turning Process By Using Artificial Neural
Network Technique
Mangesh Phate1, Sunil Hinge2,Ashish Renuse3,Navnath Tathe4 and Sachin Randive5 1
Faculty, Department of Mechanical Engineering , University of Pune, TSSM’S, PVPIT, Bavdhan, Pune, Maharashtra,411051, India
2
Department of Mechanical Engineering , University of Pune, TSSM’S, PVPIT, Bavdhan, Pune, Maharashtra,411051, India
3
Department of Mechanical Engineering , University of Pune, TSSM’S, PVPIT, Bavdhan, Pune, Maharashtra,411051, India
4
Faculty, Department of Mechanical Engineering , University of Pune, TSSM’S, PVPIT, Bavdhan, Pune, Maharashtra,411051, India
5
Faculty, Department of Mechanical Engineering , University of Pune, TSSM’S, PVPIT, Bavdhan, Pune, Maharashtra,411051, India
Abstract
Turning is one of the most widely used metal cutting processes. The increasing importance of turning operations is gaining new dimensions in the present industrial age. This project shows the clear idea about the detailed methodology of mathematical model formulation for the surface roughness, tool temperature, machine vibration and operator pulse rate during the turning process. It helps to develop an accurate and reliable model for predicting and optimizing the critical process parameters which affects the quality, productivity and the safety of the operator during a step turning process. This represents the detailed about the formulation of field data based model to analyze the impact of various machining field parameters on the machining of Aluminum 6063,S.S 304,BRASS, EN1A, EN8.In Indian scenario where majority of total machining operation are still executed manually which needs to be focused and develop a mathematical relation which simulate the real input and output data directly from the machining field where the work is actually being executed. The findings indicate that the topic understudy is of great importance as no such approach of field data based mathematical simulation is adopted for the formulation of mathematical model.
Keywords: Artificial Neural Network, Turning Process, Field Data Base Model, Model Formulation.
1. Introduction
learning algorithm, designed to train a feed-forward network, is an effective learning technique used to exploit the regularities and exceptions in the training sample. A major advantage of neural networks is their ability to provide flexible mapping between inputs and outputs. The arrangement of the simple units into a multilayer framework produces a map between inputs and outputs that is consistent with any underlying functional relationship regardless of its “true” functional form. Having a general map between the input and output vectors eliminates the need for unjustified priori restrictions that are needed in conventional statistical and econometric modeling. Therefore, a neural network is often viewed as a “universal approximator”, i.e. a flexi- (Hornik et al., 1989; White, 1990). Both theoretical proof and empirical applications have confirmed that a three-layer BP neural network (BPNN) model with an identity transfer function in the output unit and logistic functions in the middle-layer units is adequate for foreign exchange rates forecasting, which is our research focus in this book. Therefore, a three layer BP neural network model with identity activation function in the output unit and logistic function in the middle-layer units is used throughout this book except specially specified.
2. Reduction of Variables
The various independent and dependent variables of the system with their symbols and dimensional formulae are given in nomenclature. There are several quite simple ways in which a given test can be made compact in operating plan without loss in generality or control. The best known and the most powerful of these is dimensional analysis. In the past dimensional analysis was primarily used as an experimental tool whereby several experimental Variables could be combined to form one.
The field of fluid mechanics fluid mechanics and heat transfer were greatly benefited from the application of this tool. Almost every major experiment in this area was planned with its help. Using this principle modern experiments can substantially improve their working techniques and be made shorter requiring less time without loss of control.
Deducing the dimensional equation for a phenomenon reduces the number of independent variables in the experiments. The exact mathematical form of this dimensional equation is the targeted model. This is
achieved by applying Buckingham’s π theorem (Hibert, 1961).When we apply this theorem to a system involving n independent variables, (n minus number of primary dimensions viz. L, M, T) i.e. (n-3 numbers of π terms are formed.; From equation (2) total number of variables n = 23; All these variables can be expressed in terms of three primary dimensions i.e. mass (M), Length (L) and Time (T), m = 3 According to Bucking ham’s theorem Number of Pi terms = n – m = 23 – 03 = 20 dimensionless terms.
f(π1 , π2, π3, π4. . . π20) = 0
(1)
Number of repeating variables are, m=3; Choosing D, VC and FC are the repeating variables.
3. Experimentation
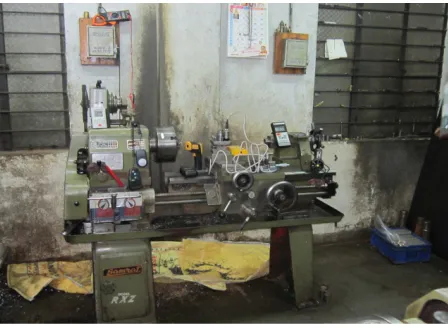
For multifactor experiments two types of plans viz. classical plan or full factorial and factorial plan are available, in this experimentation conventional plan of experimentation is recommended. In all data was collected from total 585 experiments of five material S.S.304, en1a, en8, al 6063 and Brass. The experimental set up is as shown in figure 1
4. Simulation by Using Artificial Neural
Network ( ANN)
Artificial neural networks (ANN) can replicate numerous functions of human behaviour, which are formed by a predetermined number of layers with altered computing elements called neurons. In order to build a network, the neurons are interrelated. The crowd of connections determines the form and objectives of the ANN. The processing capacity of the network is stored in the inter unit connection strengths, or weights, which are tuned in the learning process.
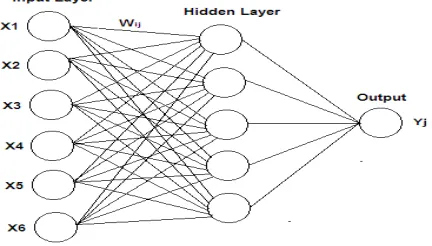
Fig.2 Basic structure of ANN 6/5/1 network
Table 1: List of Process Variables
S.N Variables Symbols
1 Operator Anthropometric ratio An
2 Cutting Tool angles ratio. AR
3 Tool nose radius R
4 Tool overhang length Lo
5 Weight Raw material W
6 Initial Diameter of the Work piece Di
7 Length to be turned L
8 Shank Height H
9 Tool Length Lt
10 Experience Exp
11 Density of the work piece material DEN
12 Pulse required Pa
13 Cutting Speed VC
14 Feed F
15 Depth of Cut D
16 Cutting force FC
17 Maximum W/P interface
Temperature
T
18 Machine Specification ratio SP
19 Power of Machine motor P
20 Atmospheric Humidity HUM
21 Surface Roughness Ra
22 Light Intensity LUX
23 Air flow Af
The training algorithm is defined as a procedure that consists of adjusting the weights and biases of a network that minimize selected function of the error between the actual and desired output. Following are the basic steps of Neural network
1. Input layer: [X1,X2,…..Xn] t , where t means vector transpose
2. Hidden layer: I j net j Y j 3. Output layer: Yj
Three ways of generating output: normalized, competitive output, competitive learning
4. Weights: Wij means the value connecting between layers
5. Processing Elements (PE) 6. Learning:
Based on the ANN model used, learning is using a set of training pattern to adjust weights in the network. 7. Scaling and De-Scaling:
Based on the ANN model used, rescaling is applying the real data pattern into the trained network to generate the output.
Fig. 3: ANN 6/5/1 Network for Ra value
Fig.4: Comparison between Actual Vs ANN for Ra value
Mode1: Surface Roughness
1.From fig 4 we have seen that experimet no. 2 ,3 ,9 ,16 ,17 ,18 ,22 ,24 ,27 ,30 ,41 ,45 ,48 ,49 ,54 ,55 got the minimum roughness value which is desirable.
2.We also seen that the experimet no. 1 ,8 ,11 ,12 ,13 ,31 ,32 ,33 ,34 ,35 ,36 ,39 ,40 ,57 ,60 have the maximum roughness value.
3.The experiment no.48 have the lowest roughness value which is ideal for experimentation.
4.The experiment no. 34 got themaximum roughness value which is not desirable for experimentation
Fig. 5: ANN 6/5/1 Network for machine vibration value
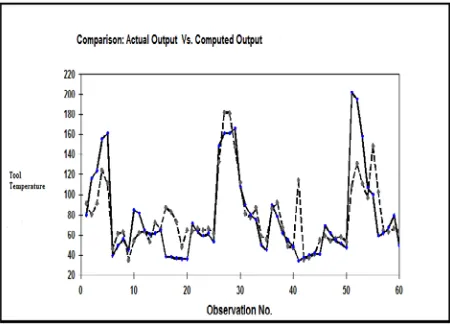
Fig.7: ANN 6/5/1 Network for Tool temperature value
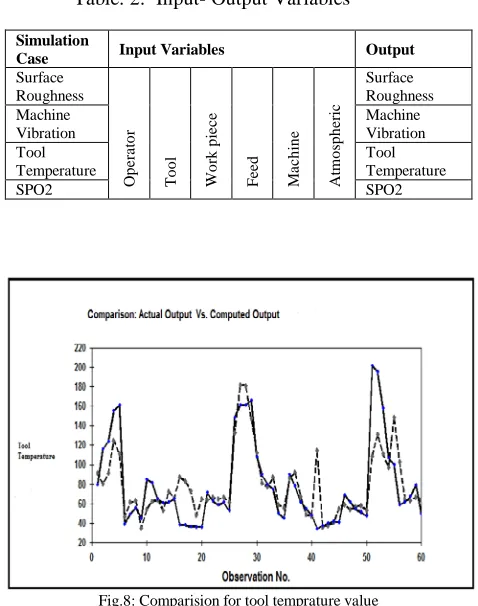
Table. 2: Input- Output Variables
Simulation
Case Input Variables Output
Surface Roughness
O
p
er
a
to
r
T
ool
W
or
k pi
e
c
e
F
e
e
d
M
a
ch
in
e
A
tm
os
phe
ri
c
Surface Roughness Machine
Vibration
Machine Vibration Tool
Temperature
Tool Temperature
SPO2 SPO2
Fig.8: Comparision for tool temprature value
Model 2 : Machine Vibration
1 . From fig we observed that machine vibration is increase for experiment no. 2, 7, 9, 11, 12, 18, 24, 25, 41, 42, 43, 44, 45, 48.
2. We also observed that machine vibration is decrease for experiment no. 38, 39, 40, 46, 49, 51, 52, 55, 56. 3 .The experiment no.49 given minimum viration value. 4. experiment no. 2 have given maximum viration value which will have large effect on Ra vale and SpO2 value.
Fig.9: ANN 6/5/1 Network for SPO2 value
Model 3 : Tool Temperature
1. 6, 9, 15, 19, 34, 35, 38, 39, 40, 42, 43, 44, 45, 46, 47, 48, 49, 58 are those experiments which gives minimum tool temp value .
2. 5, 27, 28, 29, 30, 41, 51, 52, 53, 55, 56 are the experiments which have the maximum tool temprature value.
3. experiment no. 9 givs lowest value of tool temprature which will eliminate the need of coolent.
4. experiment no. 27 givs maximum value of tool temprature which is not desirable.
Fig.10: Comparision for SPO2 value
1. Experiment no.1, 3, 5, 8, 11, 19, 34, 35, 37, 38, 53, 68 have maximum value of SPO2 which is good for human health.
2. Experiment no. 6, 7, 10, 13, 14, 15, 18, 26, 34, 44, 50 have minimum value of SPO2 which is not good for human health.
3. Experiment no.1 have the highest value of SPO2. 4. Experiment no.15, 18 have the lowest value of SPO2.
4. Conclusions
1. Model for ra value :
Table. 3: Observation for the various Input- Output Variables
Sr. Operator Tool Work Feed Machine Atmosphere Ra Machine Maximum
SPO2
1 0.688660 1016.094 8147567.2 0.098522 0.208944 101.40695 2 0.083474 1016.094 2250978.5 0.027007
2
0.265050 25.173139 1.1 25.9 116.1 96
3 0.024924 6
1016.094 1073961.6 0.012295 4
0.447691 9
7.3491854 1.5 2
26.6 123.9 98
4 0.010462 1873.858 600244.62 0.007115 0.551696 1.156193 2.3 24.8 155.3 97
5 0.015239 1
1873.858 1039858.7 0.012019 6
0.48804 4.2220951 2.2 1
27.2 160.5 97
6 0.006538 4761.774 2
587390.58 0.006989 0.653517 5.169383 4.7 30.2 39.2 97
7 0.015540 4761.774 1080320.5 0.012185 0.486299 9.3839601 4.3 25.8 49.3 96
8 0.050371 6
5957.803 2284609.2 0.026462 2
0.457306 3
15.909731 4.3 6
27.5 55.9 99
9 0.491155 8
5957.803 9072891.4 0.102291 0.293393 6
106.77037 3.8 9
28.8 44.8 97
10 0.004146 5957.803 396160.68 0.004568 0.680756 5.0654808 3.1 32.5 84.6 94
11 0.063057 5219.264 8
2214347.3 0.026355 1
0.442423 1
13.3453 5.4 29.2 81.3 97
12 0.517613 5219.264 8
9219451.1 0.099886 6
0.313653 53.268541 5.2 32.9 64.8 98
13 0.004156 5219.264 338673.66 0.004538 0.647561 3.7879868 5.7 28.1 60.3 96
14 0.055121 4
8363.148 3
321393.67 0.030627 0.154364 6.220445 2.9 6
32.2 61.6 95
15 0.023293 8363.148 3
184285.03 0.017673 6
0.154586 4
5.210236 2.5 25.8 65.2 96
16 0.00786 8363.148 119021.58 0.011564 0.176427 2.3207708 4.7 27.3 38.2 96
17 0.004685 8
8363.148 3
84231.849 0.008138 0.182406 1
4.3817716 4.1 1
28.7 38.1 97
18 0.003702 6
8363.148 3
61412.147 0.006044 8
0.161516 1
2.5454784 3.6 4
26.1 36.3 98
19 0.157719 8363.148 707981.77 0.065231 0.195041 41.316614 3.6 29.4 36.1 98
20 0.012485 8
182.2571 2
172622.68 0.016425 0.182689 0.8093101 4.8 8
26.9 35.7 98
21 0.021488 182.2571 2
290822.61 0.031307 1
0.122930 1.9553478 2.5 6
25.8 71.3 98
22 0.005646 182.2571 112619.65 0.009547 0.199057 2.6783372 2.4 22.2 62.8 97
23 0.029860 3
182.2571 2
301775.51 0.022345 0.183070 3
4.5681276 2.1 4
29.2 58.9 96
24 0.097162 182.2571 2
443645.43 0.027258 0.220461 4
16.209935 1.7 6
32.6 61.2 96
25 0.305999 182.2571 979652.63 0.058970 0.200621 25.700271 2.5 29.7 52.8 98
26 0.531242 6
895.9690 10076647 0.212432 3
0.201038 6
142.03181 3.8 2
24.3 149.3 96
27 0.175151 895.9690 5100657.7 0.077541 0.314320 3
117.85892 2.8 4
17.7 161.2 96
28 0.075445 895.9690 2252630.2 0.027007 0.462558 86.538991 2.7 19.2 160.5 97
29 0.053695 895.9690 1202774.4 0.011970 0.612999 9
48.419249 2.3 18.4 165.8 98
30 0.014787 9
895.9690 533672.92 0.005408 4
0.639131 9
30.161505 2.3 8
18.8 107.6 96
31 0.000618 3817.448 97720.312 0.003132 0.467625 1.8087665 5.4 21.5 89.3 99
32 0.000320 8
3817.448 2
61758.832 0.002015 2
0.435277 2
0.7166797 5.6 3
19.2 79.9 97
33 0.000105 8
3817.448 2
35388.024 0.001207 4
0.463650 8
0.2687345 5.1 4
15.9 74.7 96
34 0.000432 3817.448 76090.784 0.002478 0.355480 0.5979604 4.7 16.6 49.7 98
35 0.000600 3817.448 2
97671.215 0.003120 1
0.338191 1.2148679 5.6 16.8 44.8 98
36 0.721167 9
1016.407 1
8315333.1 0.098330 4
0.463354 4
141.69508 5.4 6
15.7 89.3 98
37 0.091624 1016.407 2163211.9 0.026462 0.545595 30.433654 5.3 18.3 78.5 99
38 0.027331 1016.407 1
10589339 0.012135 0.598598 10.658699 4.7 8
18.9 61.8 98
39 0.011696 1016.407 1
598567.42 0.006996 9
0.718167 7.1682234 4.7 1
12.4 54.9 98
40 0.011742 1016.407 557631.16 0.006971 0.721348 6.5434541 6.7 16.4 48.6 97
41 0.014697 4
1050.507 8
1067088 0.012135 0.562799 2
8.4821368 3.7 2
27.2 34.3 99
42 0.006288 9
2465.918 8
588953.05 0.006996 9
0.732974 5.2705982 2.9 1
25.4 37.6 97
43 0.003278 2465.918 391253.52 0.004555 0.819235 3.6472577 2.3 32.5 39.7 96
44 0.015119 1
2465.918 8
1124774.4 0.012127 1
0.652311 7.0740434 3.1 2
26.1 41.2 97
45 0.050615 6
5957.803 2194227.2 0.026195 8
0.889220 4
11.445063 2.6 29.1 40.9 97
46 0.524072 5957.803 8139602.8 0.098330 0.529005 102.19528 1.1 18.7 69.3 98
47 0.004251 5957.803 369081.05 0.004538 0.739746 3
2.3150163 1.4 9
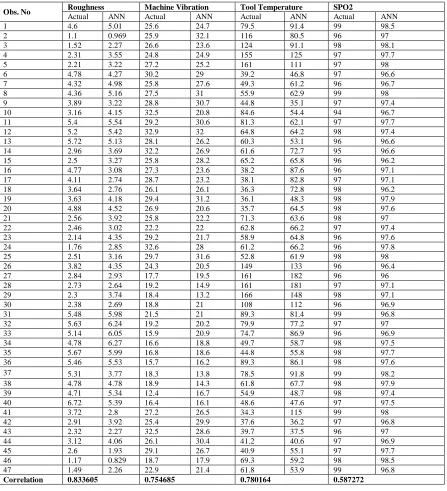
Table. 4: Comparison between actual Vs ANN responses
Obs. No Roughness Machine Vibration Tool Temperature SPO2
Actual ANN Actual ANN Actual ANN Actual ANN
1 4.6 5.01 25.6 24.7 79.5 91.4 99 98.5
2 1.1 0.969 25.9 32.1 116 80.5 96 97
3 1.52 2.27 26.6 23.6 124 91.1 98 98.1
4 2.31 3.55 24.8 24.9 155 125 97 97.7
5 2.21 3.22 27.2 25.2 161 111 97 98
6 4.78 4.27 30.2 29 39.2 46.8 97 96.6
7 4.32 4.98 25.8 27.6 49.3 61.2 96 96.7
8 4.36 5.16 27.5 31 55.9 62.9 99 98
9 3.89 3.22 28.8 30.7 44.8 35.1 97 97.4
10 3.16 4.15 32.5 20.8 84.6 54.4 94 96.7
11 5.4 5.54 29.2 30.6 81.3 62.1 97 97.7
12 5.2 5.42 32.9 32 64.8 64.2 98 97.4
13 5.72 5.13 28.1 26.2 60.3 53.1 96 96.6
14 2.96 3.69 32.2 26.9 61.6 72.7 95 96.6
15 2.5 3.27 25.8 28.2 65.2 65.8 96 96.2
16 4.77 3.08 27.3 23.6 38.2 87.6 96 97.1
17 4.11 2.74 28.7 23.2 38.1 82.8 97 97.1
18 3.64 2.76 26.1 26.1 36.3 72.8 98 96.2
19 3.63 4.18 29.4 31.2 36.1 48.3 98 97.9
20 4.88 4.52 26.9 20.6 35.7 64.5 98 97.6
21 2.56 3.92 25.8 22.2 71.3 63.6 98 97
22 2.46 3.02 22.2 22 62.8 66.2 97 97.4
23 2.14 4.35 29.2 21.7 58.9 64.8 96 97.6
24 1.76 2.85 32.6 28 61.2 66.2 96 97.8
25 2.51 3.16 29.7 31.6 52.8 61.9 98 98
26 3.82 4.35 24.3 20.5 149 133 96 96.4
27 2.84 2.93 17.7 19.5 161 182 96 96
28 2.73 2.64 19.2 14.9 161 181 97 97.1
29 2.3 3.74 18.4 13.2 166 148 98 97.1
30 2.38 2.69 18.8 21 108 112 96 96.9
31 5.48 5.98 21.5 21 89.3 81.4 99 96.8
32 5.63 6.24 19.2 20.2 79.9 77.2 97 97
33 5.14 6.05 15.9 20.9 74.7 86.9 96 96.9
34 4.78 6.27 16.6 18.8 49.7 58.7 98 97.5
35 5.67 5.99 16.8 18.6 44.8 55.8 98 97.7
36 5.46 5.53 15.7 16.2 89.3 86.1 98 97.6
37 5.31 3.77 18.3 13.8 78.5 91.8 99 98.2
38 4.78 4.78 18.9 14.3 61.8 67.7 98 97.9
39 4.71 5.34 12.4 16.7 54.9 48.7 98 97.4
40 6.72 5.39 16.4 16.1 48.6 47.6 97 97.5
41 3.72 2.8 27.2 26.5 34.3 115 99 98
42 2.91 3.92 25.4 29.9 37.6 36.2 97 96.8
43 2.32 2.27 32.5 28.6 39.7 37.5 96 97
44 3.12 4.06 26.1 30.4 41.2 40.6 97 96.9
45 2.6 1.93 29.1 26.7 40.9 55.1 97 97.7
46 1.17 0.829 18.7 17.9 69.3 59.2 98 98.5
47 1.49 2.26 22.9 21.4 61.8 53.9 99 96.8
2. Model for machine vibration value :
workpiece, feed, atmosphere hve the largest impact on machine vibration which can be seen from ANN model. From comparision chart it is also seen that machine vibration at some starting experiment is very high because friction losses are very high at the starting. To imrove the quality of workpiece and to reduce noise level we could follw experiment no. 49, this will give satisfactory result for turning process on lathe.
3. Model for tool temperature value :
material of tool and feed have greatest impact on tool temperature, it can be concluded from ANN network. As we feed increases the tool temprature will increase. Also if hardness of tool is very high then tool temperature will be also high. High temperature will affect the surface finish of workpeice. For reducing this nrisk we can follw the experiment no. 9 which will give perfect parameters for turning process.
4.Model for SPO2 value:
ANN network shows the SPO2 has great impact on the workers pulse rate.From network diagram of SPO2 value the column no.1,2 & 3 has more avg.value of input layer output than experiment no.3,4 & 5.Hence the experiment no.1,2 & 3 is more suitable for this experiment.Hence it is suggested to use the suggested levels of the input parameters for getting the various response according to the customers requirements.
References
[1] Agapiou J S (1992) The optimization of machining operations based on a combined criterion, Part 1 The use of combined objectives in single-pass operations, Part 2: Multi-pass operations. J. Eng Ind., Trans. ASME 114: 500– 513
[2] Brewer R C, Rueda R ; A simplified approach to the optimum selection of machining parameters. Eng Dig. 24(9): (1963) 133–150
[3] Hinduja S, Petty D J, Tester M, Barrow G, Calculation of optimum cutting conditions for turning operations. Proc. Inst. Mech. Eng. 199(B2): 81–92, (1985). [3] Klir G J, Yuan B , Fuzzy system and fuzzy logic –
theory and practice (Englewood Cliffs, NJ: Prentice Hall), (1998)
[4] Petropoulos P G , Optimal selection of machining rate Variable by geometric programming. J Prod. Res. 11: 305–314, (1973).
[5]Phate, M.R., Tatwawadi, V.H., Modak, J.P., Formulation Of A Generalized Field Data Based
Model For The Surface Roughness Of Aluminium 6063 In Dry Turning Operation. New York Science Journal 2012; 5(7)
[6] Sundaram R.M., An application of goal programming Technique in metal cutting. Int. J. Prod. Res16: 375 382, (1978)
[7] Walvekar A G, Lambert B K, An application of geometric programming to machining variable selection. Int. J. Prod. Res. 8: 3, (1970)
[8] Gilbert W. W, Economics of machining. In Machining – Theory and practice. Am. Soc. Met. (1950) 476–480 [9] H.Schenck Jr.: Theories of Engineering a
experimentation, McGraw Hill Book Co ,New York