The Evaluation of Performance of the
Industrial Cities Using Data Envelopment
Analysis Model (DEA)
Ali Khosravi Moghaddam,Seyyed Ahmad Shibet Alhamdi
Department of Industrial Management, Islamic Azad University, Firoozkooh Branch,
Firoozkooh, Iran
Abstract
Organizational performance has a
significant impact on the organization's
activities and methods and tools to
evaluate the performance is one of
important issues in institutional and
academic research .Furthermore, DEA
models power to meet application
requirements has led to doing extensive
research in various scientific fields.
Several studies have been performed using
this technique shows considerable
potential of this methodology in evaluating
performance and productivity
measurement. Given the high importance
of municipalities in the growth and
development of countries, it is very
important to evaluate the performance of
municipalities. Evaluation the
municipalities of province by studying the
quality, performance and comparing them
is a step towards continuous improvement
of performance of these municipalities. In
this regard,this paper has described a model to evaluate the performance of
municipalities using DEA .The current
research is considered of Applied
Research in terms of the aim. Also in terms
of data collection, this research is
descriptive and causal – comparative.
Inputs and outputs selected in this study
due to similar studies, interviews and
surveys were conducted by experts.
Criteria are selected as inputs include
total land area (meters) from the
beginning of the whole cost of construction
(RLS) and the output consists of
transferable meter (m) to get the whole
before beginning construction (RLS).
Finally, it is selected among the various
models of DEA, the input-oriented CCR
modelto evaluate the performance
according to the analysis performed.
Efficient and inefficient units were
identified that their first performance was
an efficiency unit again using the model of
Anderson - Patterson were rated which
identified as the most efficient and
Charmshahr industrial town as the most
inefficient .
Introduction
The highly valued industry of every state
is crystalized in industrial statesthat results
in the development of the community.
Evaluating the performance of industrial
towns and measuring their efficiency is
very important. Assessment of Industrial
Estates purpose is to become aware of the
quality and performance of them and can
compare them and this process could take
a step towards the continuous
improvement of the town. Using basic and
advanced techniques in order to achieve
better performance can be one of the main
goals of any organization that can more
exploit the situation. The organization will
be able to step to improve the weakness
points using these basic techniques and
bring the ship of goals in the raging sea of
changes to the best possible beach by the
most use of the capabilities and strengths.
(Ghafourian, 1383). There is an attempt in
the present study that also to identifying
and analyzing measures of performance)
efficacy (an industrial suburb of Tehran
,appropriate model for evaluating the
performance of these towns using one of
the techniques of operations research (DEA) is designed and compared their
performance with each other .
Explaining the Problem
One of the major issues today has been
considered in the economics literature
dramatically is performance measurement
units, institutions and various
organizations. Indeed, since the
performance measure is necessary which
we are facing a shortage of facilities in the
current situation and this resource should
be allocated in such a way that the
organization or institution in order to
maximize the production of goods or
services supplied through them .Industrial
towns as engine of economic and urban
development has been regarded by
national and regional planners in Iran for
long times. The first designs of industrial
areas was conducted half a century ago.
But the huge expansion of settlements
raised in recent years. Small and medium
industries can accumulate in various forms
from simple coexistence in an industrial
zone to a more developed form in the
organized gatherings such as science parks
or industrial clusters. Accumulation in all
different forms adds small and medium
businesses to the important aspects of the
business environment. The simplest and
most static buildup is found in the
procurement of infrastructure to increase
operational efficiency. Further.
Accumulation could be a catalyst for
innovation and efficiency through the
promotion of social learning. The
establishment of industrial cities in Iran
has not been following the purpose or
single subjectivism. In the case of large
towns,the environment and shortage of
land around the urban centers was the first
concern. Industrial towns that are located
near the small towns or rural areas with the
goal of equal distribution of resources for
local development and not with the aim of
addressing the shortage of land or
environmental targets established
unpublished statistics which show from the
companies that 90% of units located or in
towns or small firms are fewer than 50
workers. Existing industrial towns are
generally of a combination kind and have
embedded very diverse and unrelated
industries and there are only a few
specialized towns that have been assigned
to a particular industry or related
industries. Charmshahr a good example of
specialized industrial towns, especially
why the industry has been built near
Tehran. In the scope of this research is the
industrial cities of Tehran, Tehran
Province town industrial town comprises
12 active towns and 5 towns under
construction. For example, this study has raised questions about why Firoozkooh
Industrial town by having 203 acres of
land includes 120 contracts but Shams
Abad Industrial by approximately 2,000
hectares is including about 1,600 industrial
units , so this feeling of emptiness was to
identify useful factors . In fact, the
findings of the study and evaluating the
performance of our industrial towns will
help us in different parts of optimal
investment in Tehran. In this research we
want to measure industrial town of Tehran
province the help of DEA. The Indicators
include : Inputs such as land required in
trying to build settlements, land cost and
the cost of wages and outputs and income
from the sale of industrial land and the
employment rate and afterdetermining the
efficiency DEA model , we will grade the
functional units using the model of
Anderson – Patterson .
The background of Research The study of Parks:The method is designed to assess a bank's 35 branches in
Calgary, Canada from other studies in this
field. 13 inputs and 18 outputs of the
system are chosen as the
evaluation,however, so that not to be
skewed in determining the efficiency of
branches using data envelopment analysis
methodology (When results are
total number of units of the total number
of inputs and outputs significantly larger)
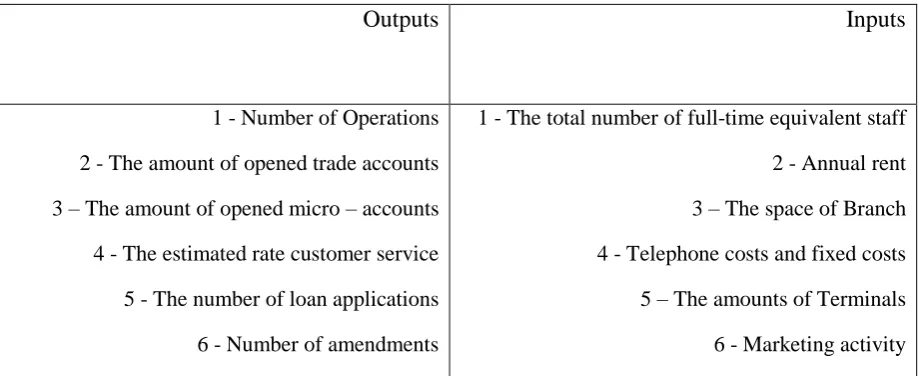
are reducedby using a rhythmic pattern for a gathering of some inputs and outputs,
inputs and outputs of each to the 6 cases.
(Table 2-2).
Table 2.2 - Inputs and outputs in Park's study (1987)
Inputs Outputs
1 - The total number of full-time equivalent staff
2 - Annual rent
3 – The space of Branch
4 - Telephone costs and fixed costs
5 – The amounts of Terminals
6 - Marketing activity 1 - Number of Operations
2 - The amount of opened trade accounts
3 – The amount of opened micro – accounts
4 - The estimated rate customer service
5 - The number of loan applications
6 - Number of amendments
The annual rent which underpins the
function of two factors of local position
and infrastructure Branch is used. The area
of the building where the branch is
customer service is classified among
numbers of 7 to 35. The amount of branch
chief's activity in marketing and attracting
the customer as a factor in the performance
of an index to measure branch is ranked
among the numbers 0 to 50. In this pattern,
each branch, the separation efficiency of
inputs and the pattern of improving
inefficient branch are identified.
Yaaghoubi and Amiri have investigated in
a research titled“Performance Based on
data envelopment analysis model to
estimate the weights of fuzzy random"
data envelopment analysis with fuzzy data.
Performance measurement using Data Envelopment Analysis
This method is known primarily as a
method of measuring the efficiency ,
during the measurement of returns to scale
production function also provides a
breakdown for firms with the progress and
development of the above methods, the
DEA is currently one of the active areas of
research in the measurement of
performance has been greatly welcomed
by the researchers . In this way, rather than
to universalize general term to produce a
single decision maker (DMU) is used.
Including methods of nonparametric
function estimation value is generated
In general, estimation the functions of
same production or estimation the frontier
production function is as a standard of
comparison, both methods are needed to
measure performance (SFA, DEA).
DEA commonly is defined as the ratio.
Innovators of this method generalized the
definition of Performance Engineering to
multi-factor and multi-product production
which was produced as a product of
factors (it is needed without predetermined
weights). (Emami MEYBODI 1379).
As previously mentioned, productivity
Index in the case of units which conclude
one input (X) and one output (Y) contains
the ratio of output to input (Y/X), if there
is the multi-input and multi-output unit or
organization, it shall recognize coefficients
for input and output. But there was a
problem that had previously seemed
unsolvable was how to consider the
coefficients for the inputs and outputs.For
example, if all factors are equally involved
in creating output and is their coefficients
the same? Certainly the inputs' role is
different in creating the outputs. It should
be selected proportional weights to them.
Some researchers took advantage prices,
costs, or ... as coefficients, and U and V,
that is:
Overall productivity = U₁Y₁+Y₂U₂+⋯
V₁X₁+V₂X₂+⋯
Therefore, the coefficients found in
applying theories and thus, the calculation
of total factor productivity will be limited.
CCR model in 1978 because it was known
that the problem will resolve coefficients,
interestingly, the coefficients obtained in
this way represents the shadow price is 1.
CCR model after determining the efficient
frontier curve specifies that decision –
making units are located in where the
boundaries are and to achieve the efficient
frontier, what combination of inputs and
outputs must be able to choose which this
not possible except by specific institutions
and input-output coefficients for each unit
.
It is indeed a masterpiece and a milestone
was the model using linear programming
to calculate the coefficients listed. Charnz,
Cooper and Rhodes (CCR) in 1987 offered
their model based on minimization of
production factors and assuming constant
returns to scale. In 1984, considering the
variable returns to scale assumption by
Bunker, Charnz and Cooper 2 (BCC) was
developed to measure the performance of
DEA. This field is required before
presenting the theoretical explanations
about the DEA, be details about the model
input shaft (input orientation) of the output
shaft (output orientation), and returns to
into "input-driven" and "output-oriented
“that more we are familiar with the
concept. Input models are models which
reduces inputs with constant outputs and
the output of the models that are driven
model that increases outputs with constant
inputs. (Mehrgan, 1383)
Scale efficiency denotes the relationship
between input changes and outputs of a
production system, service or an
enterprise. Returns answer to this question
that if “the amount of resources and raw
materials to a factory be twice, will
Production or output multiplier change it?”
Three modes that may occur:
A:Doubling the amount of output also
doubles the amount of resources
B: The amount of output be twice less
than doubling the amount of resources.
C: Doubling the amount of output more
than double the amount of resources.
The first state is called "Constant returns to
scale”, the second one is called "Returns to
scale downward” and the third one is
called "Returns to scale upward”. Any
changes in the constant returns to scale
inputs causes the same ratio of change in
output. In other words, the increase in
inputs will cause nor saving and nor the
rise in input costs and a function of output
is half of the line from the origin of coordinates and in addition to the above
definition requires that there are no fixed
costs in the production . That is, it
produces zero output with zero input
(Jahan – Shahloo ,HosseinZadehLotfi ,
1389) .
Returns to scale upward,Returns to scale
Descending, Constant returns to scale
Figure (2-1) Types of returns to scale
CCR Model
CCR model is the nature of the input is
known as CCR cover as follows:
Min n j s r y y m i x x t s j ro rj j io n j ij j ,...., 1 , 0 ,..., 1 ,..., 1 . . n 1 j 1
If the optimal solution θ ^ * = 1, then the
model is efficient DMUo. The above
model is always possible because θ^ =1 and λ_o=1 and λ_j=1 is a possible answer.
In addition, it is concluded of this possible
answer that the optimum amount of θ does
not exceed 1.
CCR model of multiple
m
i i ix
V t s
1
1 .
.
s
r
m
i ij i rj
ry v x j n
u
1 1
1 0 ,...,
m i
s r
v
ur 0 , i 0, 1,..., , 1,...,
UR and VI dual variables corresponding to
the constraints r TH output and ITH is the
input in CCR cover. Namely UR and VI
are RTH weight output and ITH weight
input for unit under study (0 unit)
respectively. YRJ and XIJ also denote the
amount of RTH output and the amount of
ITH input for JTHunit. S is the number of
outputs, m the number of inputs and n the
number of units too.
Presenting inputs and outputs
In this section, the inputs and outputs have
used to implement DEA techniques and
also how calculating them is presented to
enter the model.
1 – Ground:This index with total land area (m) is considered the construction of
industrial towns.
2 – Costs:This index includes:all costs for construction of infrastructure facilities in
industrial estates including the cost of
constructing the irrigation system, Power
grid, lighting, gas networks,
telecommunications, construction of
access roads, construction of clinics, fire
station and generally construction of all
infrastructure required for industrial
production.
Table entries
Row The name of
industrial town / Index Input
output
Value of land Cost (Rial)
Income
1 Charmshahr
2,000,000,000 185,783,482,977
29,605,463,517
2 Salarieh
5,040,000,000 102,409,354,896
112,065,400,667
3 Capital (Ali
Ababd) 6,690,000,000
4 Shams Abad
8,910,000,000 879,576,799,348
879,576,799,348
5 Abbas Abad
0,290,000,000 309,693,800,978
922,565,202,286
6 Kharazmi
3,240,000,000 138,259,546,663
219,362,075,611
7 Nasir Abad
2,600,000,000 255,417,355,345
390,405,183,192
8 FiroozKooh
2,030,000,000 125,723,844,851
81,325,816,191
9 Parand
3,520,000,000 291,016,693,977
111,504,335,170
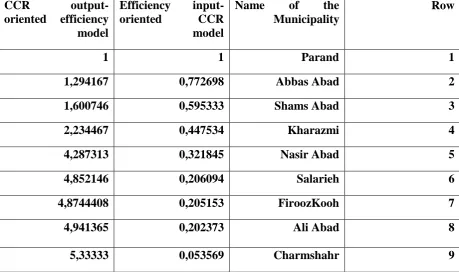
Input-oriented and output-oriented CCR model trend results
4-4-Table 5 – 4 denotes the performance of
industrial towns in Tehran. The
performance of the model using
input-oriented CCR trends were obtained. In the
model with constant returns to scale, equivalent to 11% of the first settlements
are settlements have (one) efficiency and
in other words, things are CCR. The town
has the lowest efficiency of inefficient
industrial town Charmshahr.
Table 4 – 4 Efficiency of Industrial towns in CCR input oriented and output-oriented model
Row Name of the
Municipality Efficiency
input-oriented CCR model CCR
output-oriented efficiency model
1 Parand
1 1
2 Abbas Abad
0,772698 1,294167
3 Shams Abad
0,595333 1,600746
4 Kharazmi
0,447534 2,234467
5 Nasir Abad
0,321845 4,287313
6 Salarieh
0,206094 4,852146
7 FiroozKooh
0,205153 4,8744408
8 Ali Abad
0,202373 4,941365
9 Charmshahr
International Journal of Research (IJR) Vol-1, Issue-11 December 2014 ISSN 2348-6848
Conclusions : In this study we have examined the efficiency of the industrial
towns of Tehran , the industrial towns
include 9 industrial towns which contain :
industrial towns of Parand , Shams Abad ,
The Capital , FiroozKooh , Kharazmi ,
Charmshahr , Salarieh , Nasir Abad . Data
used in the industrial cities of Tehran is
about 91s year. The input consists of the
total land area (meters) from the beginning
of the whole cost of construction (RLS)
and outputs include transferable meter (m)
to get the whole before beginning
construction (RLS). Techniques used to
calculate the efficiency of this industrial
town is data envelopment analysis which
done using model-driven input and output
and then the efficient and inefficient units
was determined and ranked using Peterson
Anderson ranking efficient units.Proposals
to increase the efficiency of inefficient
industrial town will be provided until the
functional units are able to model the
appropriate use of available resources and
to increase their efficiency.In this chapter,
we have evaluated the results, the
efficiency of the industrial towns in Tehran
discussed the proposals will be presented
to the industrial town inefficient and
finally suggestions will be presented in the
research and study limitations. Industrial town of Parand with an area of
350 hectares, is located 45 km south of
Tehran Province. In this town, metal
industries in the areas of chemical,
non-metallic mineral and is operating with
making jobs for about 2000 people. It can
be the benefits of town like nearness to
good accessing the roads, railing and
aerial. Flat land rests , reduce costs in the
areas of road construction have been of
industrial units .In this town , the
settlement of mother manufacturing units
in different areas of the garden have been
welcomed a lot by artisans . Charmshahr
industrial town as inefficient industrial
town 85 kilometers southeast of Tehran is
one of the oldest and most specialized
industrial zones in Tehran on leather areas
with making jobs for about 2000 people.
The reason being inefficient industrial
zone infrastructure costs required to
generate and despite welcoming the
industry of the town is not dissatisfying
because fracture belief of leather industry
in the country has stagnated the most units
of town.
Sources:
[1]- Charnes, A.W.W.
European Journal of Operation Research, 2, pp.429-444
[2] Charnes, A., Cooper, W.W. & Thrall, R.M., “Classifying and Characterizing Efficiencies An Inefficiencies in Data Envelopment Analysis”
, Operation Research Lett, 1981, Vol.5, PP.105-110
[3] Charnes, A., Cooper, W.W., Rhodes, “Measuring the Efficiency of Decision Making Units “, Journal of Operation Research
, 1984, No.2, PP.429-444.
[4]Cooper, W.W., Deng, H., Huang, Z.M., “A Non-Model Approach to
Congestion in Data Envelopment
Analysis”, Socio-Economic Planning Sciences, 2002, No .36, PP.231-238.
[5]Mehrabian S., M.Alirezaee and
G.Jahanshahloo (1999),“A Complete
Efficeincy Ranking of Decision Units in
Data Envelopment Analysis”,
Computational Optimization and
Applications, Vol. 14, PP. 261-266 .
[6]Mehrabian S., M. Alirezaee and G. Jahanshahloo and G.R. Amin, (2000), “
An Assurance Interval for
non-Archimedean Epsilon in DEA Model”, Operation Research, Vol. 48, PP. 344-347 .
[7] Parkan C., (1998), “Measuring the Efficiency of Service Operation; an
Application to Bank Branches”,
Engineering Cost and Production
Economics, NO. 12, PP.237-247
[8] Sengupata.J.K. (1987), “Data
envelopment Analysis for Efficiniecy
Measurement in the
StockasticCase,Comput”, Operation
Research. Vol.14.pp.117-129. [9] - William W. Cooper,Lawrence M. seiford,
Joe Zhu (2011) , handbook on data