ISSN (Print) : 2320 – 3765 ISSN (Online): 2278 – 8875
I
nternational
J
ournal of
A
dvanced
R
esearch in
E
lectrical,
E
lectronics and
I
nstrumentation
E
ngineering
(A High Impact Factor, Monthly, Peer Reviewed Journal)
Website: www.ijareeie.com
Vol. 8, Issue 1, January 2019
Analysis of Performance of Stand-Alone
Wind Energy Conversion by Using Fuzzy
Logic Controller
M. Mujtahid Ansari 1 , Nilesh Bhaidas Pawar2
Assistant Professor: Dept. of Electrical Engineering, SSBTE College of Engineering, Jalgaon,India1
M. E Student, Dept. of Electrical Engineering, SSBTE College of Engineering, Jalgaon, India2
ABSTRACT: Renewable energy sources are clean, nonpolluting, and available in abundance, and involve very little
operational and maintenance cost. Wind and solar energy sources are the most promising unconventional and renewable energy sources that have established themselves as viable alternatives for conversion into electrical energy. Nowadays, most countries of the world are facing difficulties in using conventional sources for power generation due to exhaustion of fossil fuels and environmental issues. Wind energy, is one of the available non-conventional energy sources, which is clean and an infinite natural resource. Variable speed wind energy systems have several advantages compared with fixed speed wind energy systems such as yielding maximum power output, developing low amount of mechanical stress, improving efficiency and power quality. Power electronics devices with a variable speed system are very important, where AC–DC converter is used to convert AC voltage with variable amplitude and frequency at the generator side to DC voltage at the DC-link voltage. The DC voltage is converted again to AC voltage with constant amplitude and frequency at the load side for electrical utilization. Renewable energy sources are clean, nonpolluting, and available in abundance, and involve very littleoperational and maintenance cost. Wind and solar energy sources are the most promising un-conventional and renewable energy sources that have established themselves as viable alternatives for conversion into electrical energy. An array of wind electric conversion systems, installed in a wind farm, can generate megawatts range of electric power. Wind based power conversion systems have been in use since mid-1970s in stand-alone as well as grid-connected configurations. They suffer, however, from a number of drawbacks, the major hurdles being circuit complexity, low power factor of operation, harmonics pollution, and low efficiency of power conversion. Initial investments in non-conventional power conversion systems being relatively high, and the technology gap between the advanced countries and a developing nation like India remaining wide, it was decided to undertake detailed investigations with a view to develop more efficient, highly reliable, and cost-optimized power conversion schemes
KEYWORDS: Maximum power point tracking (MPPT), pitch control, state of charge (SoC), wind energy conversion
system (WECS)
I. INTRODUCTION
ISSN (Print) : 2320 – 3765 ISSN (Online): 2278 – 8875
I
nternational
J
ournal of
A
dvanced
R
esearch in
E
lectrical,
E
lectronics and
I
nstrumentation
E
ngineering
(A High Impact Factor, Monthly, Peer Reviewed Journal)
Website: www.ijareeie.com
Vol. 8, Issue 1, January 2019
turbines and interest in this field is increasing .Wind energy system can play an important role in reducing the energy crises of the world and can be used to produce efficient energy in remote areas. The wind speeds in India usually remain in between 5 to 20 km/hr. There are usually three factors which determine the output of theelectrical energy generated from the wind energy, wind speed, cross section of wind swept by rotor, the conversion efficiency of the rotor, transmission system and the generator. There is no device designed to extract all the wind energy because the wind will be brought to rest and this would prevent the passage of wind into the rotor. An efficient aero generator can only extract 60% of the total energy present in the wind into the mechanical energy. The available wind power is directly proportional to the square of the diameter of the horizontal axis of the wind turbine and the velocity of the wind speed as it passes though the rotor. The wind energy conversion system components are aero turbine, gearing, coupling and electrical generator
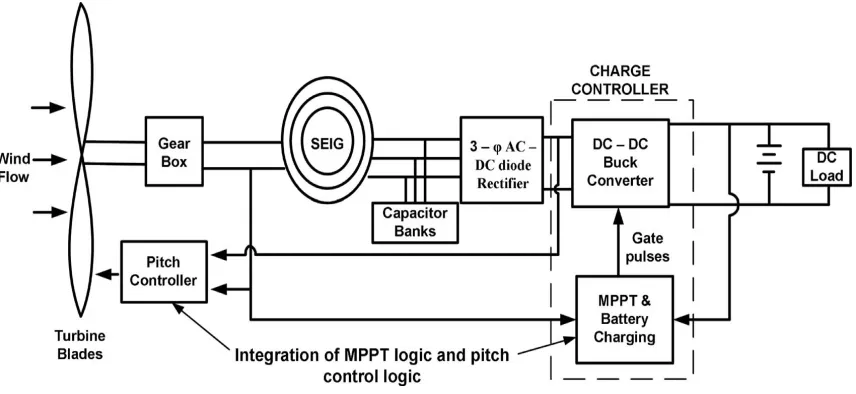
Figure 1: Layout of hybrid wind–battery system for a stand-alone dc load.
II. CONTROL STRATEGY FOR STAND-ALONE HYBRID WIND-BATTERY SYSTEM
ISSN (Print) : 2320 – 3765 ISSN (Online): 2278 – 8875
I
nternational
J
ournal of
A
dvanced
R
esearch in
E
lectrical,
E
lectronics and
I
nstrumentation
E
ngineering
(A High Impact Factor, Monthly, Peer Reviewed Journal)
Website: www.ijareeie.com
Vol. 8, Issue 1, January 2019
Figure 2.1: PMSG wind energy conversion systems.
III.MODES OF BATTERY CHARGING
CC Mode of Battery Charging: In CC mode, the battery charging current demand is determined from the MPPT logic. MPPT is implemented by comparing the actual and optimum TSR (opt). The error is tuned by a PI controller to generate the battery charging current as per the wind speed. In this mode, the converter output voltage rises with time while the MPPT logic tries to transfer as much power.As possible to charge the batteries. The actual battery charging current that can be achieved does not remain constant but varies with available wind speed subject to a maximum of C/10 rating of the battery. The battery charging current command has a minimum limit of zero. In case the wind speed is insufficient to supply the load even with zero battery charging current the inductor current reference is frozen at that particular value and the balance load current is supplied by the battery.
CV Mode of Battery Charging:In the CC mode, the battery voltage and SOC rise fast with time. However, the charge controller should not overcharge the batteries to avoid gasification of electrolyte [14]. As a result, once the battery SOC becomes equal to the reference SOC the controller must switch over from CC mode to CV mode. In CV mode, the battery chargingvoltage is determined from the buck converter output voltage (VO). The value of the converter voltage when the battery SOC reaches 98% is set as the reference value and is compared with the actual converter output voltage. The error in the voltage is then controlled by acascaded arrangement of PI controller and lead compensator to generate the inductor current reference. It is then compared with the actual inductor current by a logical comparator to generate gate pulses in a similar way as described in Section A. In this mode, the converter output voltage is maintained at a constant value by the controller action. So, in CV mode the battery voltage and SOC rise very slowly with time as compared to CC mode. The battery charging current slowly decreases with time, since the potential difference between the buck converter output and battery terminals gradually reduces.
ISSN (Print) : 2320 – 3765 ISSN (Online): 2278 – 8875
I
nternational
J
ournal of
A
dvanced
R
esearch in
E
lectrical,
E
lectronics and
I
nstrumentation
E
ngineering
(A High Impact Factor, Monthly, Peer Reviewed Journal)
Website: www.ijareeie.com
Vol. 8, Issue 1, January 2019
As shown in Fig 3.3, the battery is charged both in CC mode and CV mode. The transition from CC to CV mode takes place when the battery SOC reaches 98%. This is because in the present design, the threshold SOC for switch over in the control logic is set at 98%. As discussed in the earlier section, in the CC mode the battery charges at a CC of 40 A which is the C/10 value for a 400-Ah battery bank. During this mode, both converter output voltage and battery voltage rise. The battery SOC rises from an initial SOC level of 97.95% to 98% within 17 s. As the battery reaches the threshold SOC level, the buck converter voltage is regulated by the controller action at a constant value of 53 V while the converter current gradually reduces from 40 A at 17 s to 10 A at 40 s. The battery SOC slowly rises from 98% to98.03%. The results indicate that the battery charges at a faster rate in CC mode as compared to CV mode. Thus, in CC mode much of the available power from primary source is injected into the battery whereas in CV mode the battery is charged slowly to avoid gasification and heating
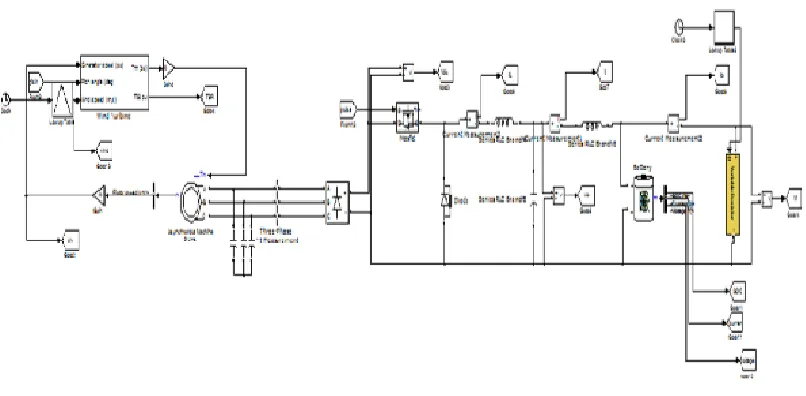
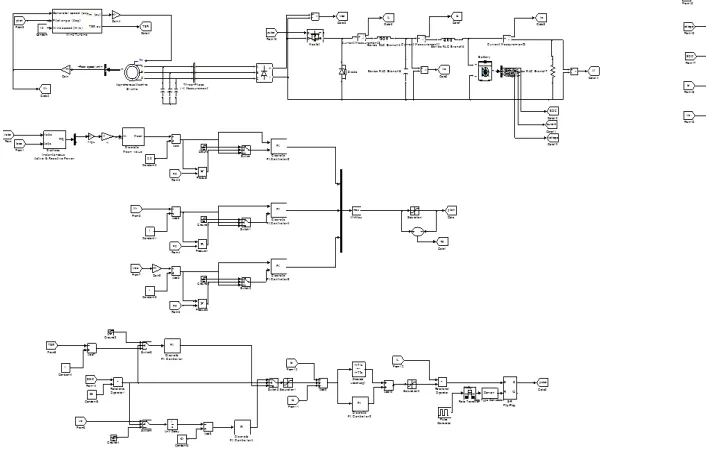
Figure 3.1: Simulink model of WEC Wind Control by PI Controller
ISSN (Print) : 2320 – 3765 ISSN (Online): 2278 – 8875
I
nternational
J
ournal of
A
dvanced
R
esearch in
E
lectrical,
E
lectronics and
I
nstrumentation
E
ngineering
(A High Impact Factor, Monthly, Peer Reviewed Journal)
Website: www.ijareeie.com
Vol. 8, Issue 1, January 2019
Figure 3.2: Hybrid wind energy conversion system for dc base telecom station
The wind flow is not available constantly. So we are using the control strategies in wind energy conversion system for getting the desired output in stand-alone control system. In this system AC-DC, DC-DC because of eliminated the voltage flickers and harmonics. The control scheme for a stand-alone hybrid wind battery system includes the charge controller circuit for battery banks and pitch control logic to ensure WT operation within the rated value. The proposed hybrid system comprises of a 4-kWWECS and400 Ah, C/10 lead acid battery bank. The system is designed for a 3-kW stand-alone dc load. The layout of the entire system along with the control strategy is shown in figure.
The ac output is rectified by three-phase uncontrolled diode rectifier. However; there is a need for a battery backup to meet the load demand during the period of unavailability of sufficient wind power. This hybrid wind-battery system requires suitable control logic for interfacing with the load. The uncontrolled dc output of the rectifier is applied to the charge controller circuit of the battery. The charge controller is a dc–dc buck converter which determines the charging and discharging rate of the battery.
In order to check the over loading of turbine (and its consequent stalling) the lead compensator output is first passed through an adjustable current limiter. The lower limit is fixed to zero and the upper limit is changed according to the maximum power available at a given wind speed it is shown in figure 4.2 . The output of this limiter is used as the reference for the current controller in the dc– dc converter. Finally, in the inner most loop the actual inductor current is made to track the reference using peak current mode control. The compensated output of the intermediate loop is compared with the instantaneous inductor current of the buck converter. The output of the comparator is applied to an SR flip flop to generate the gate pulses for the dc–dc buck converter. The frequency of the clock pulses is 2 kHz. The frequency of the gate pulse is equal to the clock pulse frequency. The generating the clock pulses in this method is known as the current programmed control technique. Inductors current exceed the rated current at that time it can be passed through the buck converter for reducing the current. This happens because with increase in blade pitch the lift coefficient reduces which results in decreasing the value of CP. So, the pitch control mechanism controls the power output by reducing the power coefficient at higher wind speeds. Below the rated wind speed the blade pitch is maintained at zero degree to obtain maximum power. The pitch controller increases the blade pitch as the WT parameters exceed the rated value.
ISSN (Print) : 2320 – 3765 ISSN (Online): 2278 – 8875
I
nternational
J
ournal of
A
dvanced
R
esearch in
E
lectrical,
E
lectronics and
I
nstrumentation
E
ngineering
(A High Impact Factor, Monthly, Peer Reviewed Journal)
Website: www.ijareeie.com
Vol. 8, Issue 1, January 2019
carried out to avoid integrator saturation. The pitch controller changes the pitch command owing to variation in turbine rotation speed, power, and output voltage of rectifier, which ensures safe operation of the WECS
IV. SIMULATION RESULTS
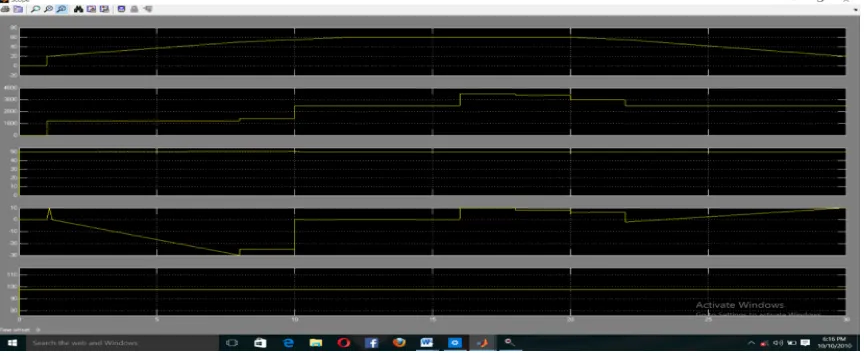
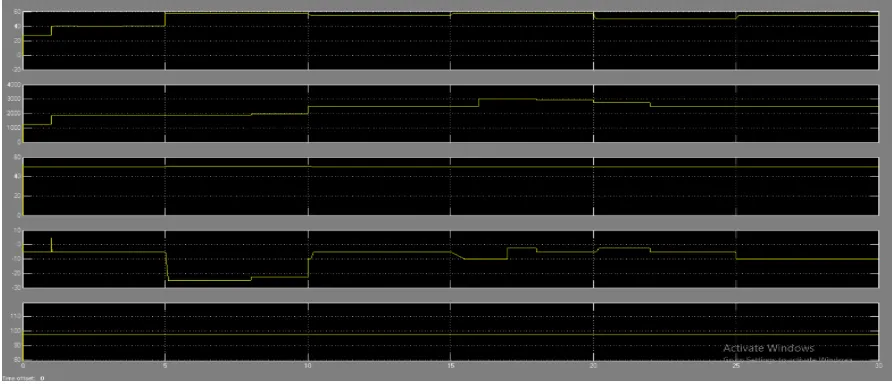
The system is connected to a load profile varying in steps from 0 to 4 kW. The WT factors like shaft speed, TSR, blade pitch and output power are analysed with variation in wind speed conditions. The current profile of the converter, load, and the battery are also supervised with the wind profile. To ensure continuous power flow, load demand is given more priority over battery charging. The WT and battery parameters are observed for the following wind profiles. 1. Gradual rise and fall in wind speed.-fig-4.1
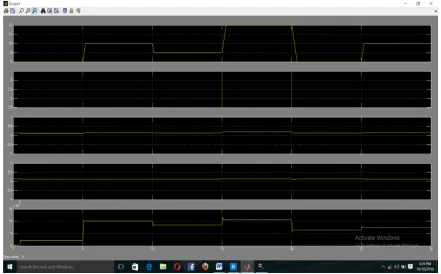
2. Step variation in wind speed.-fig-4.2 3. Arbitrary variation in wind speed.-fig-4.3
A gradual rise and fall in wind speed as shown in Figures 4.1, 4.2 and 4.3 .The results also demonstrate the change in battery SOC for all possible wind profiles. From Figs 4.1- 4.3, it is observed, that when the wind speed is below the rated value (10 m/s) the MPPT scheme regulates the TSR of WT at its optimum value Irrespective of the variation in wind profile. Thus maximum power is extracted from WECS at all wind speeds to meet the load requirement and charge the battery bank
ISSN (Print) : 2320 – 3765 ISSN (Online): 2278 – 8875
I
nternational
J
ournal of
A
dvanced
R
esearch in
E
lectrical,
E
lectronics and
I
nstrumentation
E
ngineering
(A High Impact Factor, Monthly, Peer Reviewed Journal)
Website: www.ijareeie.com
Vol. 8, Issue 1, January 2019
Figure 4.2 : WT and battery parameters under the influence ofgradual variation of wind speed
ISSN (Print) : 2320 – 3765 ISSN (Online): 2278 – 8875
I
nternational
J
ournal of
A
dvanced
R
esearch in
E
lectrical,
E
lectronics and
I
nstrumentation
E
ngineering
(A High Impact Factor, Monthly, Peer Reviewed Journal)
Website: www.ijareeie.com
Vol. 8, Issue 1, January 2019
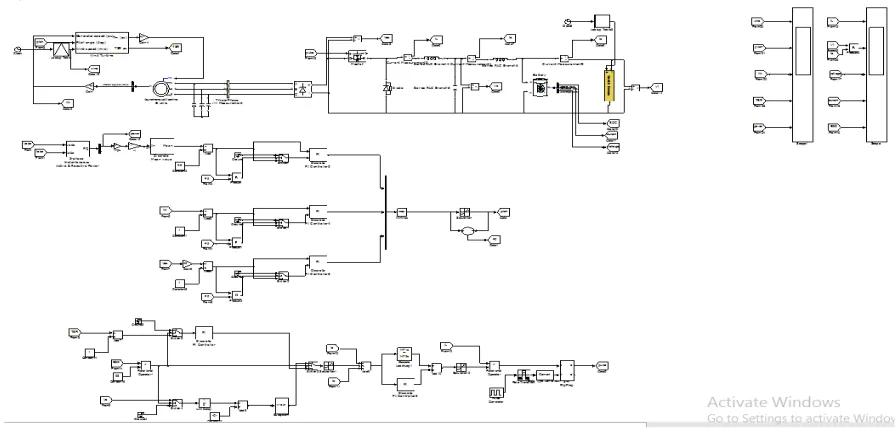
Simulation Results are also taken on the Normal wind energy conversion system.thae system is shown as follows
Figure 4.4: Normal wind energy conversion system
ISSN (Print) : 2320 – 3765 ISSN (Online): 2278 – 8875
I
nternational
J
ournal of
A
dvanced
R
esearch in
E
lectrical,
E
lectronics and
I
nstrumentation
E
ngineering
(A High Impact Factor, Monthly, Peer Reviewed Journal)
Website: www.ijareeie.com
Vol. 8, Issue 1, January 2019
Figure 4.6: simulation results of Normal wind energy conversion system
Simulation Results are also taken on the Fuzzy logic controller wind energy conversion system.thae system is shown as follows
ISSN (Print) : 2320 – 3765 ISSN (Online): 2278 – 8875
I
nternational
J
ournal of
A
dvanced
R
esearch in
E
lectrical,
E
lectronics and
I
nstrumentation
E
ngineering
(A High Impact Factor, Monthly, Peer Reviewed Journal)
Website: www.ijareeie.com
Vol. 8, Issue 1, January 2019
Figure 4.8: simulation results Fuzzy logic controller wind energy conversion system
ISSN (Print) : 2320 – 3765 ISSN (Online): 2278 – 8875
I
nternational
J
ournal of
A
dvanced
R
esearch in
E
lectrical,
E
lectronics and
I
nstrumentation
E
ngineering
(A High Impact Factor, Monthly, Peer Reviewed Journal)
Website: www.ijareeie.com
Vol. 8, Issue 1, January 2019
Simulation Results are also taken on the Fuzzy logic controller wind energy conversion system.thae system is shown as follows
Figure 4.10: simulation results Fuzzy logic controller wind energy conversion system
ISSN (Print) : 2320 – 3765 ISSN (Online): 2278 – 8875
I
nternational
J
ournal of
A
dvanced
R
esearch in
E
lectrical,
E
lectronics and
I
nstrumentation
E
ngineering
(A High Impact Factor, Monthly, Peer Reviewed Journal)
Website: www.ijareeie.com
Vol. 8, Issue 1, January 2019
Figure 4.12: simulation results Fuzzy logic controller wind energy conversion system
Points to be observed:
The MPPT scheme regulates the TSR of WT at its optimum value when the wind speed is below the rated value (10 m/s) irrespective of the variation in wind profile.
Maximum power is extracted from WECS at all wind speeds to meet the load requirement and charge the battery bank. In the situations when the wind power is not always sufficient to meet the load demand and charge the battery in CC mode, the system first meets the load requirement and charges the battery bank at a reduced rate.
When the wind power is insufficient as per the load demand, the battery discharges to bridge the demand. During charging the battery SoC increases but while discharging it decreases. The charge controller always ensures that the battery current during charging or discharging never exceeds 40 A. The pitch angle of WT is maintained at zero deg at wind speed below 10 m/s. But when the wind speeds exceeds its rated limit, the pitch controller is activated. The increase in the pitch angle holds the power and speed output within the safe limits of WT operation.
V. CONCLUSION
ISSN (Print) : 2320 – 3765 ISSN (Online): 2278 – 8875
I
nternational
J
ournal of
A
dvanced
R
esearch in
E
lectrical,
E
lectronics and
I
nstrumentation
E
ngineering
(A High Impact Factor, Monthly, Peer Reviewed Journal)
Website: www.ijareeie.com
Vol. 8, Issue 1, January 2019
REFERENCES
[1] A. D. Sahin, “Progress and recent trends in wind energy,” Progress in Energy Combustion Sci., vol. 30, no. 5, pp. 501–543, 2004. [2] R. D. Richardson and G. M. Mcnerney, “Wind energy systems,” Proc. IEEE, vol. 81, no. 3, pp. 378–389, Mar. 1993.
[3] R. Saidur, M. R. Islam, N. A. Rahim, and K. H. Solangi, “A review on global wind energy policy,” Renewable Sustainable Energy Rev., vol. 14,no. 7, pp. 1744–1762, Sep. 2010.
[4] M. T. Ameli, S. Moslehpur, and A. Mirzale, “Feasibility study for replacing asynchronous generators with synchronous generators in wind farm power stations,” in Proc. IAJC – IJME, Int. Conf. Eng. Technol., Music City Sheraton, Nashville, TN, US, ENT paper 129Nov. 17–19, 2008.
[5] G. K. Singh, “Self-excited generator research—A survey,” Electric Power Syst. Res., vol. 69, no. 2/3, pp. 107–114, 2004.
[6] R. C. Bansal, “Three-phase self-excited induction generators: An overview,” IEEE Trans. Energy Convers., vol. 20, no. 2, pp. 292–299,Jun. 2005.
[7] S. C. Tripathy, M. Kalantar, and N. D. Rao, “Wind turbine driven self-excited induction generator,” Energy Convers. Manag. vol. 34, no. 8,pp. 641–648, 1993.
[8] A. Chakraborty, “Advancements in power electronics and drives in interface with growing renewable energy resources,” Renewable Sustainable Energy Rev., vol. 15, no. 4, pp. 1816–1827, May 2011.
[9] F. D. Gonz´alez, A. Sumper, O. G. Bellmunt, and R. V. Robles, “A review of energy storage technologies for wind power applications,” Renewable Sustainable Energy Rev., vol. 16, no. 4, pp. 2154–2171, May 2012.
[10] N. S. Hasan, M. Y. Hassan, M. S. Majid, and H. A. Rahman, “Review of storage schemes for wind energy systems,” Renewable Sustainable Energy Rev., vol. 21, pp. 237–247, May 2013.