Using ADI Method
INDIRA. S. P. Dr. SHREEDHARA. K. S.
PhD Research Scholar, VTU, Professor
DoS in C S and Engineering DoS in C S and Engineering
UBDTCE, Davangere-577004 UBDTCE, Davangere-577004
ABSTRACT
A Partial Differential Equation (PDE) contains unknown multivariable functions and their partial derivatives. PDEs are used to formulate problems involving functions of several variables. Based on this superiority of PDE and its physical mechanism analysis from image processing, combining variational methods, functional analysis, differential geometry, image segmentation, image enhancement, image reconstruction, medical image processing and other fields are widely used. A linear partial differential equation has an important role in image reconstruction and computer vision. This paper focuses on the theme of 3D image reconstruction from PDE based registration of 2D planar cross sections. This paper discuss how linear PDE of ADI method can be used to display a reconstruction of 3D image from 2D planar cross sections of higher quality, enhancing its sharpness and extraction of shapes. Since the images are given on discrete grids, PDEs are discretized by variational technique namely Alternating Direction Implicit method in order to get fast and stable solutions. An experimental result shows the reconstruction of 3D image.
Keywords—Partial Differential Equation, Alternating Direction Implicit, 2D Cross Sections, 3D
Reconstruction.
I. INTRODUCTION
Nowadays the medical imaging facilitates to visualize the human internal organs in a noninvasive way, with regard to anatomical and functional aspects. MRI and CT images provide data usually in the form of 2D cross-sectional images of the human body. The sampling is done in a set of coplanar slices with adjustable distance and thickness. If sequences of 2D cross-sectional images [3] are put together and arranged in the form of stack, the result will be a 3D image representation of the human organ. This 3D image is a powerful tool to aid medical diagnosis and surgery, because it can be visualized and manipulated as needed without making any surgery to the body [4][5][7].
The aim of this paper is to present mathematical model, numerical methods and computational results of 3D image reconstruction from registration of 2D planar cross sections. The models are based on a partial differential equations approach. Namely, linear PDEs of ADI scheme in two spatial dimensions. The details of the proposed method is given in Section II, some experimental results of the proposed method is given in Section III. The conclusion is given in Section IV.
[image:1.595.235.376.560.676.2]II. Methodology
Fig .1: Segmented 2D cross sectional data
[image:2.595.76.474.128.261.2]
Γ
Fig .2: Implicit function of the plane
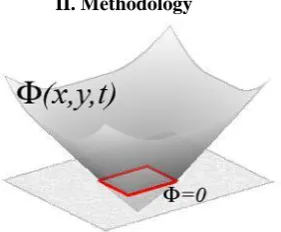
Level set method is a discretized version of implicit geometry. For implicit geometry both the location of the surfaces and its connectivity are defined by points in space. This is specified by a mathematical function ( ). The geometry is then defined as the points for which the function evaluates to zero. Thus the function „f‟ through the equation ( ) = 0 implies the existence of the geometry. It also gives a way of moving the closed distance between objects in space. The level set function is denoted by ø( , , ). The red color plane and its intersection of surface in plane is shown in fig.1. The red color plane is called the zero level set, because it is the collection of all points that are at the height zero.
‘ Γ ‘ in Fig.2. Shows interface of the implicit function of the plane, by choosing the points. Where 𝑓(𝑥,𝑦) = 0, a subset of the plane is selected and is called a level-curve, or level-set of the implicit function. It is a two-dimensional plane and is a scalar function is evaluated in the plane. A general scalar function 𝑖𝑠 𝑠ℎ𝑜𝑤𝑛 𝑖𝑛 𝑒𝑞 (1) 𝑓:Ω⊂R 𝑛→𝑅 (1) .
Later a rectangular grid is used for extraction of 2D cross sectional data by the finite difference solution of PDEs in two independent variables [1][3].
ADI method:
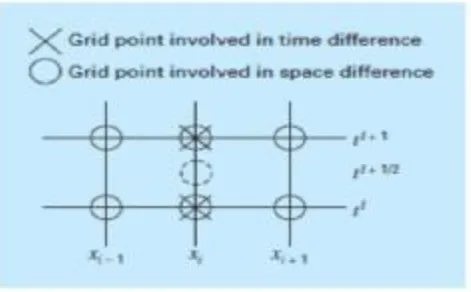
An Alternative-Direction Implicit scheme is a second-order method and is accurate in both space and time approximations [1][6][9]. To provide this accuracy, difference approximations are developed at the midpoint of the time increment Fig.3.
Fig.3: The ADI difference approximations are developed at the midpoint of the time increment
[image:2.595.178.414.519.665.2]
Fig.4: The two half-steps used in implementing the alternating direction implicit scheme for solving finite difference PDE equations in two spatial dimensions
The rectangular grid of interface „Γ‟ is represented implicitly as the base level of a continuous function which is denoted as „ ‟; therefore it is written as eq. (2)
Γ = { 𝑥 |𝑢 (𝑥, 𝑡 ) = 0 } (2)
If the normal speed of the interface „ Γ ‟ is denoted as „ ′ then the time evolution of ′ ′ is given by
For the first step, the basic PDE equation in terms of interface„Γ‟ is given in eq.(4)
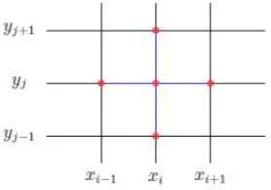
The ADI method only results in tridiagonal equations if it is applied along the dimension that is implicit. Thus, on the first step (a), it is applied along the y dimension and, on the second step (b), along the x dimension.
Computation of Grid points by ADI method shown in fig.5. These “alternating directions” are the root of the method‟s name.
Fig.5: Computation of Grid points by ADI method
III. EXPERIMENTAL RESULTS
Fig 6: Resultant Images Shows the Reconstruction of 3D Image by ADI method:
Fig 6: Shows images consists of number of 2D cross sections and are stacked one above the other to form a 3D image.
IV. SUMMARY AND CONCLUSION
Here the proposed method uses an approach of ADI method. Using openGL, initially the 2D cross sectional image is segmented by Level set method. Later the mathematical implementation of the proposed model is accomplished through calculation of grid points for registration of 2D planar cross section at base level. ADI method is used to extracts the surface to form a 3D image. This permits in improving the surface and shape of the planar contours structures.
REFERENCES
[1] Steven C. Chapra and Raymond P. Canale, “Numerical Methods for Engineers”, Text Book, Seventh Edition, McGraw-Hill Education.
[2] Gustaf S¨oderlind and Carmen Ar ´evalo, “Numerical Methods for Differential equations”, Text Book, Numerical Analysis, Mathematical Sciences, Lund University, 2008-09.
[3] Indira.S.P and Shreedhara. K. S, “Construction of 3D Objects Using 2D Cross Sectional Data and Curves ”, IEEE-Xplore(Aug 2007)
[4] Agma J. M. Traina, Afonso H. M. A. Prado, Josiane M. Bueno, “3D Reconstruction of Tomographic Images. Applied to Largely Spaced Slices”, J Med Syst. 1997 Dec; 21(6):353-67.
[image:5.595.146.477.411.595.2]
[6] Ola Nilsson, “ PhD thesis on Level-Set Methods & Geodesic Distance Functions”, 2009.
[7] Yuanfeng Jin, Tinghuai Ma, Donghai Guan, Weiwei Yuan and Chengmin Hou,“Review of applications of partial differential equations for image enhancement” , Scientific Research and Essays Vol. 7(44), pp. 3766 -3783, 12 November, 2012.
[8] Casero R, Urszula Siedlecka., Lena Gruscheski, Matthew Gibb, Jürgen E. Schneider, Peter Kohl and Vicente Grau, “Transformation diffusion reconstruction of three-dimensional histology volumes from two-dimensional image stacks”, Med Image Anal. 2017 May;38:184-204