Article
Mask Data Priming Network for Automatic
Check-Out
Zhen Xiao 1, Jia Zhao 1,2,* and Gang Sun 1
1 School of Computer and Information Engineering, Fuyang Normal University, Fuyang 236037, China;
2 Computer Science and Information Engineering, Hefei University of Technology, Hefei 230009, China
* Correspondence: [email protected]
Featured Application: This work can be used in auto checkout system which automatically identify the products.
Abstract: Auto checkout has received more and more attention in recent years and this system automatically generates a shopping bill by identifying the picture of the products purchased by the customers. However, the system is challenged by the domain adaptation problem, where each image of the training set contains only one commodity, whereas the test set is a collection of multiple commodities. The existing solution to this problem is to resynthesize the training images to enhance the training set. Then the composite images are rendered using CycleGAN to make the image distribution of the training set and the test set more similar. However, we find that the detection boxes given by the ground truth of the common dataset contain a large part of the background area, the area will affect the training process as noise. To solve this problem, we propose a mask data priming method. Specifically, we redo the large scale Retail Product Checkout (RPC) dataset and add segmentation annotation information to each item in the training set image based on the original dataset using pixel-level annotation. Secondly, a new network structure is proposed in which we train the network using joint learning of detectors and counters, and fine-tune the detection network by filtering out suitable images from the test set. Experiments on the RPC dataset have shown that our method yields better results. we used an approach that reached 81.87% compared to 56.68% for the baseline approach which demonstrates that pixel-level information helps to improve the detection results of the network.
Keywords: object detection; semantic segmentation; computer vision; automatic check-out
1. Introduction
With the success of the Amazon Go store, the store's exclusive Automatic Check-Out (ACO) system has caught the attention of supermarkets and retail stores. Amazon Go disrupts traditional convenience store and supermarket operations, using technologies such as computer vision, deep learning, and sensor fusion to completely skip the traditional checkout process. This system can automatically identify the category and quantity of the purchased goods, and finally complete the automatic checkout, so that customers do not need to wait in line for the checkout. The success of self-checkout systems will revolutionize the way we shop and will have a significant impact on our daily lives for years to come.
The system's hardware equipment consists mainly of infrared sensors at the checkout counter, pressure sensing devices, and load sensors that capture the customer's merchandise when it is placed on the checkout counter. At the same time, this data is transmitted in real-time to the Amazon Go store's information hub, and the self-checkout system completes the identification and counting of items. It uses an image of the item purchased by the customer as input, detects the category of each item, and completes the count without any delay for each customer. With the success of deep
learning, deep neural networks have become the preferred tool to accomplish this task. The training of deep neural networks depends on large data sets with annotations. The RPC dataset, proposed by the MEGVII Institute, is different from those used for other tasks in object detection. Specifically, the training data are images of a single item taken from different angles, while the test set is a collection of multiple items from a real shopping scene. As a result, there is a large difference in the image distribution between the training set and the test set. To solve this problem, one needs to learn the difference between the source domain (an image of a single item) and the target domain (a real shopping image), and thus reduce or even eliminate this difference.
Existing methods [1,2] have done a great deal of work to address this issue. For example, Wei[1] obtained the image containing the commodity set as the training set by pasting and copying the original training set and then rendered the synthesized image using the CycleGAN [3] method to make it more closely resemble the real image. But this method results in the presence of some merchandise poses in the composite image that is not easily recognizable due to the angle of the shot, and the rendered image still has some differences from the real image. So Li [2] improve on the approach presented in RPC. First, cuts were made for some items that were not easily identifiable due to the angle of the shot and then a collection of items was generated by randomly selecting single items; Secondly, to improve the authenticity of the synthesized images, the images were rendered using the CycleGAN for shading and boundaries; finally, the pre-trained network was fine-tuned using the counter and detector joint training strategy to filter out suitable images from the test set, which can achieve good results. However, we found that the ground truth of the detection box given in the dataset used by the existing method contains a large part of the background area, which introduces some noise and thus affects the training process. To solve this problem, we propose a new network model based on DPN.
In this paper, we improve on the network structure based on DPN by adding mask branches, because we argue that the ground truth given by the dataset contains background noise, to affect the training of the network, but this effect can be removed if pixel-level information is used. Therefore, we reconstructed the training set and extracted the contour information of the commodity as the segmentation annotation during the synthesis of the training set. Next, we propose a mask data priming network with two branches, one for our mask detection branch and the other for the counting branch. Finally, we train on the synthesized images and then use a joint counter and detector training strategy to extract the eligible test set images for fine-tuning the network. Experiments on the RPC dataset show that the performance of our proposed method is higher than existing methods, proving that pixel-level information helps to improve the detection results of the network.
There are three main contributions to our work:
1. The dataset is reconstructed, pixel-level information about the commodity is extracted, and image segmentation is used to improve the detection capabilities of the network.
2. A new network structure is proposed that fine-tunes the network using a joint training strategy to extract appropriate test set images.
3. Experiments performed on the RPC dataset show that our proposed method has a better performance compared to the baseline and DPN approaches.
2.Related Work
In this section, we will review the work related to our proposed methodology.
2.1. Object Detection
confidence and classification, predicting b-box coordinates and feature extractor changes on three scales. Nevertheless, Faster R-CNN [8] is a two-stage detector, the method proposes to replace the selective search with an area candidate network, and the network automatically learns to extract the candidate areas to reduce the number of candidate areas, and finally obtains the horizontal detection frame and the classification results for each object to be detected, which improves the speed and ensures the accuracy at the same time.
The methods above all share the common feature that the detection frames are all horizontal rectangles. Xu [9] represents an object by learning the offset of four points on a non-rotating rectangle to locate a quadrilateral, i.e. using an angled detection frame to mark the object. As before, EAST [10] provides directional information and can detect text in each direction. Whereas, Mask R-CNN [11] adds a mask branch to the Faster R-CNN network, using segmentation annotation information from the dataset to enable prediction of pixel points of objects.
2.2. Domain Adaptation
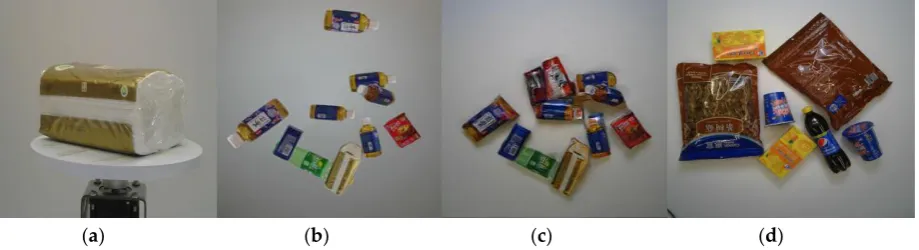
In the process of training a deep learning model, there are some differences between the training set and the test set because of the limitations in making the data set. For example, with the RPC dataset, the training set contains only one item per image, while each image in the test set is a collection of multiple items. In order to solve this problem, a lot of research has been done before, such as the use of Variational Auto-encoder(VAE) [12,13] or Generative Adversarial Networks(GAN)[3,14] to enhance the data. Based on the pixel CNN structure, Van [12] proposes a new method of conditional image generation, which is the conditional features obtained descriptive labels or other potential embeddings created by the network. Similarly, Yan [13] generates the conditional feature from visual attributes. Li [2] firstly screens the original training set to remove unrealistic training images, then uses the training set for synthesis, and finally, renders the synthesized images using CycleGAN [3]. The differences in data generation by stage are shown in figure 1.
(a) (b) (c) (d)
Figure 1. From left to right are (a) the training set image, (b) the composite image, (c) the rendered image and (d) the test set image.
2.3. Grocery Product Dataset
commodity dataset to date, comprising 83,739 images across 200 product categories. There are 17 broad categories such as puffed foods, instant drinks, desserts, cereal milk, personal hygiene, and stationery. Specifically, it includes 53,739 images of only one item in the set as a training set and 30,000 images of actual shopping.
3. Methodology
In this section, we describe in detail the process of training set image synthesis in an automated checkout task, how to extract pixel-level information segmentation, and how to train using our proposed network. As mentioned before, our approach has two steps. First, in the data domain adaptation step, we filtered the original training set images using the method described in DPN to remove those gestures that were not realistic to improve the quality of the composite images. Then, the coordinates of the commodity profile are extracted during the synthesis process as pixel-level labeling information for the commodity. Second, we use a joint training strategy to train our proposed network as a way of fine-tuning the network by filtering images from the test set.
3.1. Data Domain Adaptation
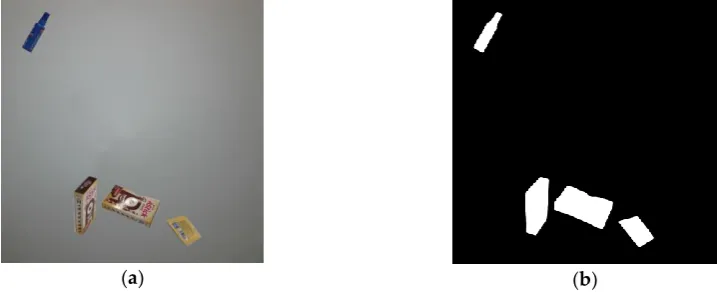
In our synthesis of the training set, which needs to be pre-processed first, we use the method proposed in DPN to extract the commodities in each image and remove those commodities that cannot be identified due to the shooting angle. After the pre-processing, we obtained the separated commodity and the corresponding mask image, then synthesized the training set using our improved synthesis method. Because we added segmentation annotation to the training data in addition to the DPN synthetic image method, we need to extract the profile information of each commodity during the synthesis. Specifically, it is to first randomly select the extracted items and then randomly paste them on the prepared background image so that each item is less than 50% obscured, we call this step is Operation A. We continue to use the product's corresponding mask image and paste the product's mask randomly on a background with all pixels zero(Operation B), where the mask paste is in the same position as in the foreground image above. For each commodity of the synthesized images, we perform operations A and B, respectively, as shown in Figure 2. However, the synthesized images are still lacked realism, so we used the CycleGAN to render the synthesized images with more realistic brightness and shadows.
(a) (b)
Figure 2. (a) A synthesized image; (b) Saliency map corresponding to (a). For each commodity in (a), (b) can be obtained using operations A and B in turn.
3.2. Mask Data Priming Network
accurate, and then fine-tuning the detection network using a joint learning strategy to select appropriate test images.
3.1.1. Network Architecture
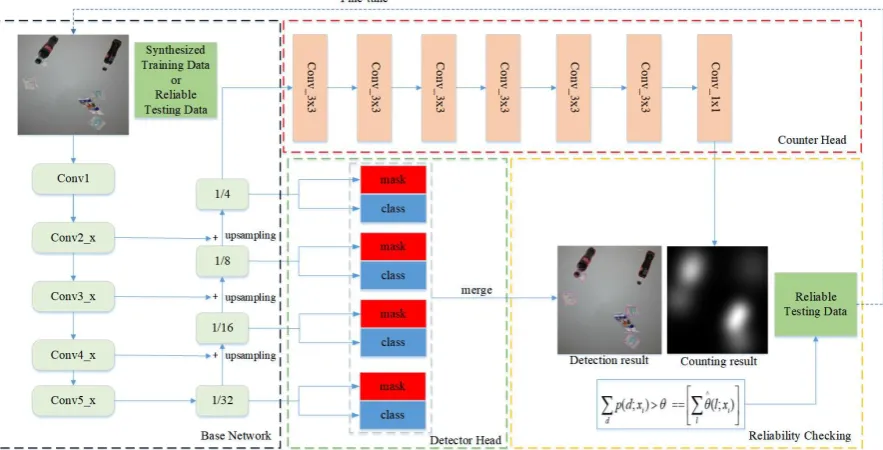
The purpose of the Automatic Check-Out system is to predict the number and type of goods in the image. Next, we will describe our network structure, where we add mask branches to the DPN network detector. Specifically, the network consists of three parts: backbone B, counting branch C, and detection branch D. The backbone network uses the Resnet-101 [22] network with image pyramid structure [23], detectors and counters branches share the features of the backbone output, detectors identify the mask and category of goods, and counters predict the number of goods using the density map, as shown in Figure 3.
Figure 3. Our proposed network framework. The black dashed box indicates our backbone network and the red and green dashed boxes indicate our counters and detectors, respectively. The yellow dashed box is used to verify the availability of test set data.
3.1.2. Loss Function
The loss function used by our network is defined as:
e
loss=ldet ctor+(lcls+lmask), (1)
Where lcounter is the loss of the counter, lclsis the cross-entropy loss for classification, and we add
mask
l as the loss of the split branch, which uses the average binary cross entropy loss function.
counter
l and lclshave the same definition with [2] and lmask has the same definition with [11].
3.1.3. Joint Learning of Detection and Counting
We combine detector and counter training networks, and the whole process is shown in Algorithm 1. First, we train the entire network B+C+D using the training set, using the loss function as formula 1. Then, we use the pre-training model to select the reliable testing data such that the number of goods detected by the counter is equal to the number of goods with the high confidence(we set =0.95 in the experiments and is shown in figure 3) obtained by the detector after NMS(Non-Maximum Suppression) operation, as shown in Figure 3. Finally, we removed counter C and used the filtered image to fine-tune the B+D section.
1. Train the Mask Data Priming Network (B+C+D) using the training set.
2.Use the Reliability Checking operation to select the reliable testing data.
3.Remove the network counter head C.
4.Use the filtered test image to fine-tune the current network B+D.
4. Experiment
4.1. Implementation Details
Our proposed method is implemented by PyTorch and the CycleGAN model is set up similarly to [3]. We train with two GPUs, set the BATCHSIZE to 4, containing two images on each GPU. We set the number of detections for each image to 256, train the network using the SGD optimization algorithm, and set the weight decay to 0.0001, MOMENTUM to 0.9, the initial learning rate to 0.005, the number of training rounds to 30,000 and the learning rate to decay at 15,000 and 20,000 rounds. The factor in Eq. (1) is set to 1.
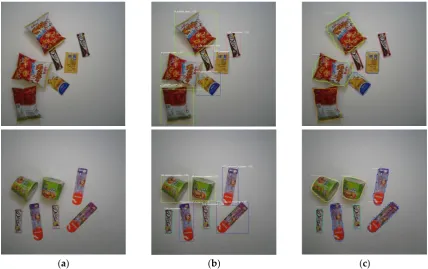
(a) (b) (c)
Figure 4. From left to right are (a) two images in the test set, the corresponding predicted results of (b) DPN and (c) our method.
4.2. Datasets
The dataset provides three different types of annotations for the test images.
1. A shopping list of categories and counts of items in each checkout image.
2. The central position of the product and the annotations of each product category. 3. Detection boxes for the location and category of each item.
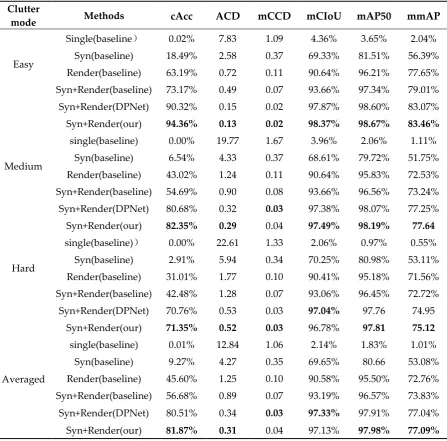
Table 1. Experimental results on the RPC dataset
Clutter
mode Methods cAcc ACD mCCD mCIoU mAP50 mmAP
Easy
Single(baseline) 0.02% 7.83 1.09 4.36% 3.65% 2.04%
Syn(baseline) 18.49% 2.58 0.37 69.33% 81.51% 56.39%
Render(baseline) 63.19% 0.72 0.11 90.64% 96.21% 77.65%
Syn+Render(baseline) 73.17% 0.49 0.07 93.66% 97.34% 79.01%
Syn+Render(DPNet) 90.32% 0.15 0.02 97.87% 98.60% 83.07%
Syn+Render(our) 94.36% 0.13 0.02 98.37% 98.67% 83.46%
Medium
single(baseline) 0.00% 19.77 1.67 3.96% 2.06% 1.11%
Syn(baseline) 6.54% 4.33 0.37 68.61% 79.72% 51.75%
Render(baseline) 43.02% 1.24 0.11 90.64% 95.83% 72.53%
Syn+Render(baseline) 54.69% 0.90 0.08 93.66% 96.56% 73.24%
Syn+Render(DPNet) 80.68% 0.32 0.03 97.38% 98.07% 77.25% Syn+Render(our) 82.35% 0.29 0.04 97.49% 98.19% 77.64
Hard
single(baseline)) 0.00% 22.61 1.33 2.06% 0.97% 0.55%
Syn(baseline) 2.91% 5.94 0.34 70.25% 80.98% 53.11%
Render(baseline) 31.01% 1.77 0.10 90.41% 95.18% 71.56%
Syn+Render(baseline) 42.48% 1.28 0.07 93.06% 96.45% 72.72%
Syn+Render(DPNet) 70.76% 0.53 0.03 97.04% 97.76 74.95 Syn+Render(our) 71.35% 0.52 0.03 96.78% 97.81 75.12
Averaged
single(baseline) 0.01% 12.84 1.06 2.14% 1.83% 1.01%
Syn(baseline) 9.27% 4.27 0.35 69.65% 80.66 53.08%
Render(baseline) 45.60% 1.25 0.10 90.58% 95.50% 72.76%
Syn+Render(baseline) 56.68% 0.89 0.07 93.19% 96.57% 73.83%
Syn+Render(DPNet) 80.51% 0.34 0.03 97.33% 97.91% 77.04% Syn+Render(our) 81.87% 0.31 0.04 97.13% 97.98% 77.09%
4.3. Baseline Methods
Wei[1] provide four benchmarks for comparison. Specifically, the following four training data are used to train the networks to identify commodities.
• Single: We use the original training set image to train the network.
• Syn: We operate by synthesis to create 100,000 synthesized images for the training of the network.
• Render: To reduce the differences between domains, we used CycleGAN to train the synthesized images into the style of real shopping images, which improved the detection results.
• Syn+Render: We combine the synthesized and render-ed images into one to train the network.
A comparison of the results with the four baseline and DPN methods is shown in Table 1. Figure 4 shows the visualization results of our model. the SINGLE method was a failure in this task because of the large differences between the training set and test set images. Besides, by training with rendered images, the experimental results were significantly enhanced. This is because the CycleGAN effectively converts composite images into checkout images with realistic lighting and shadows, and the results obtained by DPN are a huge improvement over the baseline method. Compared to these methods, the cAcc scores obtained by our proposed method are 94.36%, 82.35%, and 71.35% for easy, medium, and hard level images on the syn+Render dataset, respectively, which is a slight improvement over the DPN method. From this, it can be seen that the segmentation branching we added improves the performance of the network and proves that our approach is effective.
5. Discussion
Although our advantage over the DPN results is not significant enough, we found through experimentation that the ground truth given by the dataset contains redundant background information. As can be seen from Figure 5, the pixel-level labeling we used to obtain the product profile relative to the detection frame can greatly reduce the background information detected, thus making the detection results more accurate. But the test set also uses test box annotation, which makes the advantages of our method not show up. We think that the use of commodity profiles instead of detection frames on the test set will make our results significantly better than those of DPN.
(a) (b) (c)
Figure 5. We used the experiments on the three images that were taken from the test set. comparison between using the detection box and using the contour information shows that our method achieves better detection results than the DPN method.
6. Conclusions
In this paper, we propose a new network to solve the problem of auto checkout. Unlike the previous approach to domain adaptation, we have improved the DPN network by adding a mask branch in the detector, using the backbone, detector head, and count head as the network structure. The network is then fine-tuned using a joint learning strategy to select the appropriate images in the test set to obtain better detection results. Experiments conducted on the RPC dataset showed that our method was successful at three levels: easy, medium, and difficult, significantly outperforming previous baseline methods at the average level, and slightly better than the results from DPN. For future works, we try to modify the network structure and continue to use the data set we generate to detect targets at the pixel level, thus making the results more accurate.
Author Contributions: Conceptualization, Jia Zhao; investigation, Zhen Xiao; writing—original draft preparation, Zhen Xiao; writing—review and editing, Jia Zhao and Gang Sun; funding acquisition, Jia Zhao and Gang Sun. All authors have read and agreed to the published version of the manuscript.
Funding: This research is supported in part by the National Natural Science Foundation of China grant number 61906044 and 61672006, and in part by the key projects of natural science research in Anhui colleges and universities grant number KJ2019A0529, KJ2019A0532, KJ2019A0542, and KJ2018A0328. The APC was funded by 61906044.
Conflicts of Interest: The authors declare no conflict of interest.
References
1. Wei, X. S.; Cui, Q.; Yang, L.; et al. RPC: A large-scale retail product checkout dataset. arXiv preprint. 2019, arXiv:1901.07249.
2. Li, C.; Du, D.;Zhang, L.; et al. Data Priming Network for Automatic Check-Out. ACM MM. 2019, 2152-2160.
3. Zhu, J. Y.; Park, T.; Isola , P.; et al. Unpaired image-to-image translation using cycle-consistent adversarial networks. ICCV. 2017, 2223-2232.
4. Liu, W.; Anguelov, D.; Erhan, D.; et al. SSD: Single shot multibox detector. ECCV. 2016, 21-37.
5. Redmon, J.; Divvala, S.; Girshick, R.; et al. You only look once: Unified, real-time object detection. CVPR. 2016, 779-788.
6. Redmon, J.; Farhadi,A. YOLO9000: better, faster, stronger. CVPR. 2017, 7263-7271.
7. Redmon, J.; Farhadi, A. Yolov3: An incremental improvement. arXiv preprint. 2018. arXiv:1804.02767. 8. Ren, S.; He, K.; Girshick, R.; et al. Faster R-CNN: Towards real-time object detection with region proposal
networks. NIPS. 2015, 91-99.
9. Xu, Y.; Fu, M.; Wang, Q.; et al. Gliding vertex on the horizontal bounding box for multi-oriented object detection. arXiv preprint. 2019, arXiv:1911.09358.
10. Zhou, X.; Yao, C.; Wen, H.; et al. EAST: an efficient and accurate scene text detector. CVPR. 2017, 5551-5560.
11. He, K.; Gkioxari, G.; Dollár, P.; et al. Mask R-CNN. ICCV. 2017, 2980-2988.
12. Van den Oord A; Kalchbrenner, N.; Espeholt, L; et al. Conditional image generation with pixelcnn decoders. NIPS. 2016, 4790-4798.
13. Yan, X.; Yang, J.; Sohn, K.; et al. Attribute2image: Conditional image generation from visual attributes.
ECCV. 2016, 776-791.
14. Goodfellow, I.; Pouget-Abadie, J.; Mirza, M.; et al. Generative adversarial nets. NIPS. 2014, 2672-2680. 15. Hossam, M.; Mona, A.; Maryam, H.; et al. Automatic Fruit Image Recognition System Based on Shape and
Color Features. AMLTA. 2014, 278-290.
16. Koubaroulis, D.; Matas, J.; Kittler, J. Evaluating colour-based object recognition algorithms using the SOIL-47 database. ACCV. 2002, 840-845.
17. Merler, M.; Galleguillos, C.; Belongie, S. Recognizing groceries in situ using in vitro training data. CVPR. 2007, 1-8.
18. George, M.; Floerkemeier, C. Recognizing products: A per-exemplar multi-label image classification approach. ECCV. 2014, 440-455.
19. Jund, P.; Abdo, N.; Eitel, A.; et al. The Freiburg Groceries Dataset. arXiv preprint. 2016, arXiv:1611.05799. 20. Follmann, P.; Bottger, T.; Hartinger, P.; et al. MVTec D2S: densely segmented supermarket dataset. ECCV.
2018, 569-585.
21. Chen, X.; Fang, H.; Lin, T. Y.; et al. Microsoft COCO Captions: Data Collection and Evaluation Server.
arXiv preprint. 2015, arXiv:1504.00325.
22. He, K.; Zhang, X.; Ren, S.; et al. Deep residual learning for image recognition. CVPR. 2016, 770-778.