A Novel Decision Tree Algorithm for Land Cover Classification Using Hybrid
Polarimetric Sar Data
K. V. Ramana Rao
Department of ECE, VIEW, Visakhapatnam, Andhra Pradesh, India – 530046 [email protected]
Prof.P.Rajesh Kumar
Department of ECE,A.U.C.E, Visakhapatnam, Andhra Pradesh, India– 530003 [email protected]
Abstract
The polarimetric information contained in polarimetric synthetic aperture radar (SAR) images represents great potential for characterization of natural and urban surfaces. However, it is still challenging to identify different land cover classes with polarimetric data. Hybrid polarimetric SAR data (RH, RV) from RISAT - 1 is found to be suitable for land cover classification of significant features that are well distinguished. The availability of high resolution hybrid polarimetric data from RISAT - 1 SAR systems supporting FRS -1 mode, made it possible to analyze the scattering mechanism for different land use and land cover features using the Raney decomposition (m-alpha, m-chi, and m-delta) techniques. Further to perform both supervised classification(parallelepiped, minimum distance, maximum likelihood and isodata classifiers) and machine learning (artificial neural net) classification also performed Decision tree classification.The proposed statistical Gumbel distribution model has been implemented and retrieves the threshold intensity values. In this proposedwork classification approach has been evaluated for
RISAT-1 SAR hybrid polarimetric data of 21st October 2014 over an urban city, Visakhapatnam, in the state of
Andhra Pradesh, India. Since the hybrid polarimetric radar data contains all the scattering information for any arbitrary polarization state, data of any combination of transmitting and receive polarizations can be synthesized, mathematically from hybrid polarimetric data. The RISAT-1 SAR hybrid polarimetric data were decomposed to retrieve the surface and volume scattering information. Both supervised classification and machine learning classification methods were appliedto land cover and few other land use classes based on ground truth measurements using maximum-likelihood (ML) distance measures that are derived from the complex distribution of SAR data at various polarization combinations. The results show that Decision tree classification accuracies for m-alpha, m-chi and m-delta methods were 99.743, 96.873 and 99.857 respectively. RISAT-1 hybrid polarimetric SAR data helps to classify land cover features efficiently.
Keywords and phrases: SAR, Hybrid Polarimetry, Image Processing, Classification, Decision Tree algorithm 1. Introduction
Nowadays land use and land cover classification of a particular part of many countries, especially city areas have got much importance for proper planning against the continuous alteration oftheearth surface. This is mainly due to that the land cover change is a result of many factors such as theglobal change that
may occur with changingclimatic conditions,
changes intheecosystem, geochemical cycles,
biodiversity and various human activities. Different target decomposition techniques and as well as various classification algorithms have been proposed by Pottier, Lee et al., Cameron and Leung,
Ferro-Park et al., Ferro-Parks et al.Classification techniques are broadly divided into two types known as supervised
classification and unsupervised classification
techniques. Although a lotof research has been done in the field of SAR image classification, still there are certain limitations in each classificationtechnique due to the problem of discriminating of accurate features.
Also, supervised classifier is unable to recognize and represent unique categories which are not represented in training data. Similarly, unsupervised classification methods also suffer from certain limitations and disadvantages. In order to achieve more accurate
results for land cover classification, it is
advantageous to opt for more advanced classifier. Inrecentyearstheuseofdecision
treeclassifierforlandcover classification of remotely sensed data has been increased considerably. Previous researchers show that decision tree
algorithms consistently outperform supervised
classification techniques. Decision tree classification is acomputationallyefficient algorithm. The other advantage of decision tree classifier includes its flexibility, simplicity, ability tohandle noisy and missing data, lack of dependence on probability distribution function of data (Lee, J. S. (2004). The decision tree rules for the classification were selected quantitatively on the basis of thestatistical Gumbel distribution empirical model and experimental investigation. The another objective of this proposed work is to improve our understanding about supervised classification to see, how they interact with training data, and how they affect cluster labeling for land cover classification if input parameters are SAR observables obtained by decomposition methods. In the proposed paper
supervised classification methods, namely minimum distance, maximum likelihood, and parallelepiped, etc., are used for classification based on Raney decomposition. The parameters obtained by m-chi, m-alpha, and m-delta decomposition, are also taken as input parameters for the unsupervisedisodata classifier which is a state of art method used more often for classification.In the proposed work, it is observed
thathybridpolarimetricSARsystemsaremorecapableof discriminating different land covers than Linear polarimetric SAR data. Thus in this paperRISAT-1hybridpolarimetric data has been usedfor the study.
2. Research Study Area
The researcharea is located in and aroundthegreater Visakhapatnam Municipal Corporation, Andhra Pradesh. The area covered in this investigation is about 621.52 sq.km of Visakhapatnam district,one of the North Coastal districts of Andhra Pradesh and it lies between 170 10' and 170 56' N latitude and 830 08' and 830 40' E longitude (Fig: 1). It is bounded on Northside partly by Orissa state and partly by Vizianagaram district, towards South by East Godavari district, towards West by Orissa state and towards EastbytheBay of Bengal.
RISAT-1 data has been acquired in circular fine resolution strip map (cFRS) mode on October 21, 2014,over the city of Visakhapatnam an urban city of Andhra Pradesh state, India with the central latitude of 17.41N, central longitude of 83.23E and at an incidence angle of 38.780. The dataset has an azimuth resolution of 2.38m and ground range resolution of 2.87m. The scene was imaged during the ascending pass of the satellite with right looking (in international terminology, it is left looking) sensor orientation. Ground-truth parameters regarding soil moisture, urban, vegetation height and vegetation
type, etc., were collected synchronously with the satellite passes. Ground truths are collected from various places covering the entire region under test. Around193 ground control points (GCP) were collected for training and 840 for testing the accuracy of classification map. Table-1 presents the training and control samples based on ground truth data. Based on ground truth information, six classes were identified: water (including sea water also), urban, vegetation (cropland, grassland, shrubs, trees,etc.), beach sand, road and bare soil surface.
Table 1. Ground Truth Survey Points
Class Training samples Test samples
Water 5 302
Urban 75 265
Vegetation 89 7
Beach Sand 4 137
Bare Soil 19 66
Road 1 45
4. Data Processing
RISAT-1 cFRS SLC data (level 1 product) was usedin the present study. Radiometric calibration was performed, and the data was multi-looked three times in range, and azimuth direction and a C2 matrix were generated from RH and RV data. A refined Lee filter was applied with a 5x5 window to suppress speckle noise. The filtered dataset was decomposed using m-χ decomposition and analysis was performed to discriminate various features through scattering mechanism. Until the generation of C2 matrix, own code is used,and then PolSARpro 5.0 is used for m-χ decomposition. Around 500 pixels were selected for each class for quantifying into even-bounce,
odd-bounce and volume scattering components of PolSARpro 5.0 output. The values of the three componentswere normalized for each pixel using min, max value of the 500 pixels and the highest value of the three was considered to be the dominant scattering mechanism for that pixel. For the entire test area, the percentage of pixels showing dominant surface, double bounce and volume scatter was computed and plotted.
Figure 2. Methodology for land use land cover classification of RISAT-1 SAR data 5. Decision Tree Algorithm
Decision tree approach requires athorough
knowledge of information-bearing features and their physical understanding. It has been already known that phase intensity is a function of the electromagnetic wave parameters such as wave frequency, its polarization, and its incidence angle, and it depends on the target characteristics such as surface geometry (size, shape, orientation distribution and spatial arrangement of objects), physical property (symmetry, non symmetry or irregularity of the
target) and dielectric characteristics of the
medium.The objective of the proposed work is to extract physical information from backscattering phase intensity behavior of various objects.The task of this work is to determine the class of each image pixel based on their features. The selection of proper features is important for classification. Decision trees are commonly used for variable selection to reduce data dimensionality in image analysis. Decision trees are used to predict membership of cases or pixels in the classes of a categorical dependent variable from their measurements on one or more predictor variables. In these tree structures, leaves represent classifications and branches represent conjunctions of features that lead to those classifications.
Decision tree algorithms have many advantages. They are white box model and simple to understand and interpret. If a given result is provided by the model, the explanation for the result is easily replicated by simple math, Decision trees are able to handle both numerical and categorical data, and requires little data preparation, they are robust and perform well with large data in a short time and Decision trees, performing univariate splits and examining the effects of predictors one at a time, have implications for the variety of types of predictors that can be analyzed.
Figure 3. Algorithm for Decision Tree Classification, 𝛟1, 𝛟2 &𝛟3 are Even, Diffuse & Odd bounce respectively
6. Results and Discussions
In this section,theclassification results that are obtained from various classifiers like Decision Tree classification, Artificial Neural Net (ANN) classification, supervised classifications such as minimum distance(MD), maximum likelihood(ML), parallelepiped based onRaney decomposition and also unsupervised isodata classification based on Raneydecomposition. Using the confusion matrixwhich is also called error matrix, overall accuracy, kappa coefficient of all the classification results are calculated with the help of ground truth information. All the results are obtained by polSARpro and ENVI processing tools.
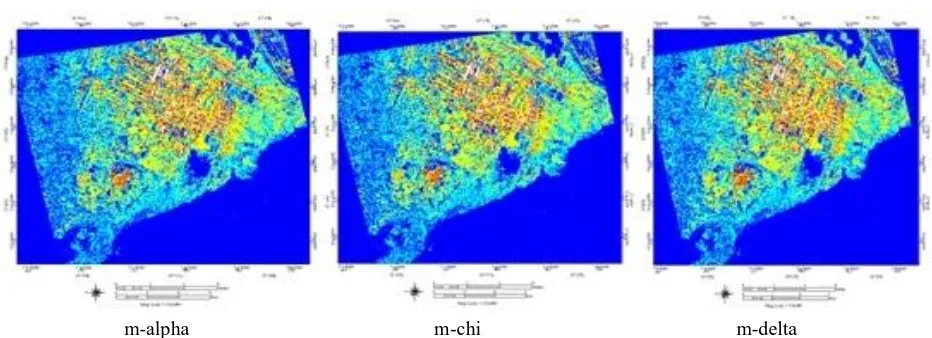
m-alpha m-chi m-delta
Figure 4. Raney Decomposed Images with Ground truth points of RISAT-1 21st October 2014
𝛟1 > 0.3 𝛟1<3.5
𝛟1 > 0 𝛟1< 0.06
Urban
𝛟1 > 0.06, 𝛟1 < 0.25, 𝛟2 > 0.6,𝛟2 < 0.7, 𝛟3 > 0.6 and𝛟3 < 0.7
Water
𝛟2 > 0.3
𝛟2 < 0.5 Vegetation
𝛟3 > 0.2 𝛟3 < 3
Bare Soil
𝛟3 > 0.1 𝛟3 < 0.2
Road
Unsupervised Classification
m-alpha m-chi m-delta
Figure 5. Isodata classified Images (Urban-Cyan, Vegetation-Green, Water-Blue, Beach sand–Light green, bare
soil-Yellow, and Road-Magenta) of RISAT-1 21st October 2014
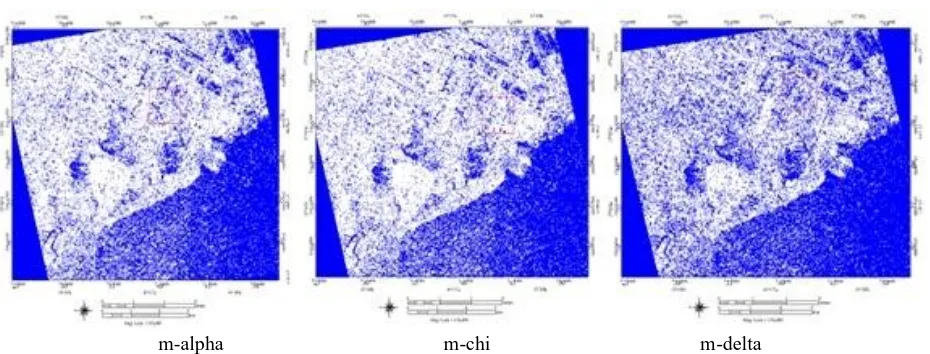
m-alpha m-chi m-delta
Figure 6. K-Mean classified Images (Urban-Brown, Vegetation-Magenta, Water-Blue, Beach sand–Yellow, Bare
soil-Cyan and Road-Light Brown) of RISAT-1 21st October 2014
Supervised Classification
m-alpha m-chi m-delta
Figure 7. Parallelepiped classified Images (Urban-White, Vegetation-Red, Water-Blue, Beach sand–Cyan, Bare
m-alpha m-chi m-delta
Figure8. Minimum Distance classified Images (Urban-White, Vegetation-Red, Water-Blue, Beach sand–Cyan, Bare
soil-Yellow, and Road-Magenta) of RISAT-1 21st October 2014
m-alpha m-chi m-delta
Figure 9. Mahalanobis Distance classified Images (Urban-White, Vegetation-Red, Water-Blue, Beach sand–Cyan,
Bare soil-Yellow, and Road-Magenta)of RISAT-1 21st October 2014
m-alpha m-chi m-delta
Figure10.Maximum likelihood classified Images (Urban-White, Vegetation-Red, Water-Blue, Beach sand–Cyan,
m-alpha m-chi m-delta
Figure 11.Artificial Neural Net classified Images (Urban-White, Vegetation-Red, Water-Blue,Beach sand–Cyan,
Bare soil-Yellow, and Road-Magenta)of RISAT-1 21st October 2014
m-alpha m-chi m-delta
Figure12. Support Vector Machine classified Images (Urban-White, Vegetation-Red, Water-Blue, Beach sand–
Cyan, Bare soil-Yellow, and Road-Magenta)of RISAT-1 21st October 2014.
m-alpha m-chi m-delta
Figure 13. Binary Coding classified Images (Urban-White, Vegetation-Red, Water-Blue, Beach sand–Cyan, Bare
m-alpha m-chi m-delta
Figure 14. Decision Tree classified Images (Urban-White, Vegetation-Red, Water-Blue, Beach sand–Cyan, Bare
soil-Yellow, and Road-Magenta) of RISAT-1 21st October 2014.
m-alpha m-chi m-delta
Figure 15. Decision Tree feature branches
The classification results showing overall classification accuracyand kappa coefficient for different methods are summarizedin table2. The
results show that decision tree classifier
performsbetter than all the parametric supervised
classification techniques(maximum
likelihood(ML),theminimum distance(MD) and
parallelepiped) and unsupervised isodata
classification. This is because this classifier is
implementedwiththoroughexpert knowledge-based
data obtained by Gumbel distribution statistical model andexperimental validation which does not
require anyassumptionsabout the frequency
distribution properties of the data. In the case of non-parametric classifiers, the maximum likelihood (ML) classifier performs better than the minimum distance
(MD)and parallelepiped classifiers. This is because the maximum likelihood (ML) classifier is based on the Bayesian probability theory developed on second order statistics.On the contrary Minimum distance (MD) and parallelepiped classification methodsare
basedonfirst order statistics. This maximum
likelihood classifier assumes that input data (training data) is normally distributed and independent. These classification tests based on Raney decomposition and it gives not such good results for all three classification algorithms.
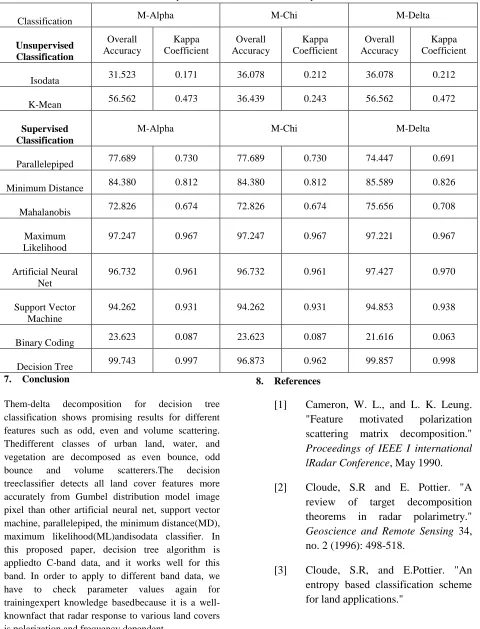
Table 2.Overall Accuracy (O.A) and kappa coefficient estimates for all the features obtained by different decomposition and classification techniques
Classification M-Alpha M-Chi M-Delta
Unsupervised Classification Overall Accuracy Kappa Coefficient Overall Accuracy Kappa Coefficient Overall Accuracy Kappa Coefficient
Isodata 31.523 0.171 36.078 0.212 36.078 0.212
K-Mean 56.562 0.473 36.439 0.243 56.562 0.472
Supervised Classification
M-Alpha M-Chi M-Delta
Parallelepiped 77.689 0.730 77.689 0.730 74.447 0.691
Minimum Distance 84.380 0.812 84.380 0.812 85.589 0.826
Mahalanobis 72.826 0.674 72.826 0.674 75.656 0.708
Maximum Likelihood
97.247 0.967 97.247 0.967 97.221 0.967
Artificial Neural Net
96.732 0.961 96.732 0.961 97.427 0.970
Support Vector Machine
94.262 0.931 94.262 0.931 94.853 0.938
Binary Coding 23.623 0.087 23.623 0.087 21.616 0.063
Decision Tree 99.743 0.997 96.873 0.962 99.857 0.998
7. Conclusion
Them-delta decomposition for decision tree
classification shows promising results for different features such as odd, even and volume scattering. Thedifferent classes of urban land, water, and vegetation are decomposed as even bounce, odd
bounce and volume scatterers.The decision
treeclassifier detects all land cover features more accurately from Gumbel distribution model image pixel than other artificial neural net, support vector machine, parallelepiped, the minimum distance(MD), maximum likelihood(ML)andisodata classifier. In this proposed paper, decision tree algorithm is appliedto C-band data, and it works well for this band. In order to apply to different band data, we have to check parameter values again for trainingexpert knowledge basedbecause it is a well-knownfact that radar response to various land covers
8. References