Volume 8, No. 5, May – June 2017
International Journal of Advanced Research in Computer Science RESEARCH PAPER
Available Online at www.ijarcs.info
Vehicle Abnormality Detection and Classification using Model based Tracking
Arun Kumar H.D.
Department of Computer Science, Kuvempu University, Shankaraghatta
Shimoga, India
Prabhakar C.J.
Department of Computer Science, Kuvempu University, Shankaraghatta
Shimoga, India
Abstract: In this paper, we present a novel approach for detection and classification of abnormal vehicles in urban highways. We considered four types of abnormal vehicles such as near pass, illegal lane crossing, slow moving and long time stopped vehicles and which are detected and classified based on vehicle tracking and speed information. The model based tracking is used to detect, near pass and illegal lane crossing vehicles. The slow moving and long time stopped vehicles are detected based on speed information computed from model based tracking information. Since, the detection accuracy is mainly depend upon reliable and most efficient tracking, we adopted model based tracking which able to track the vehicles efficiently under various situations such as shape and appearance variations in road crossing, illumination variation and complex background. The two video sequences selected from i-Lids and GRAM-RTM are used for experimentation and results are evaluated based on precision, recall and f-measure. The experimental results demonstrate that our approach achieves highest accuracy for detection and classification of abnormal vehicles in urban highways.
Keywords: Traffic event classification; vehicle abnormality detection; vehicle tracking; abnormal event classification;
I. INTRODUCTION
Video based sensor systems can play a key role in delivering data for better road planning and traffic management. Traffic surveillance is an insistent need for the robust and reliable traffic surveillance to improve traffic control and management with the problem of urban and roadways. Urban highway capacity strongly depends on abnormal events, which can lead to harsh traffic congestions and infrastructure damage. Abnormal events detection and classification in traffic video scenes plays an important role in traffic event analysis and video monitored traffic control centers. Vehicle abnormality can be defined at various levels such as traffic vehicle accidents, wrong way or illegal lane crossing, near pass, slow moving and long time stopped. The vehicles are small in size and typical traffic video resolution is low, making it extremely difficult to extract complex descriptors such as pose with real accuracy. Instead, only simple features, such as position and velocity, can be used to characterize vehicle abnormality.
Traffic event classification approach [1] using event severities at intersections, this approach learn normal and common traffic flow by clustering vehicle trajectories. Common vehicle routes are generate by implementing trajectory clustering with Continuous Hidden Markov Model. Vehicle abnormality is detected by observing maximum likelihoods of vehicle locations and velocities on common route models. The rule-based framework [2] for activity detection and behavior in traffic videos obtained from stationary traffic video cameras. Moving vehicles are segmented from the video sequence and tracked in real time videos. These are classified into different classes using Bayesian network approach, which makes use of vehicle features and image-sequence-based tracking results for robust classification. To analyze activities at an intersection in the number of traffic zones for detecting and classifying vehicles [3] and then tracking to extract traffic flows which assist in abnormality detection. Traffic zones definition in urban intersection video, based on trajectories clustering; greatly reduce the time and volume of computations. The
vehicles trajectory analysis using support vector machine (SVM). Using trajectory analysis helps to extract abnormal behaviors. A point tracking system [4] for vehicle behavior analysis without an image segmentation procedure. Here, feature points are extracted using an improved Moravec algorithm. A specially designed template is used to track the feature points through the image sequences. Then, trajectories of feature points can be obtained, using decision rules to remove unqualified track trajectories. Finally, the vehicle behavior analysis algorithms are applied on the track trajectories for traffic event detection.
abnormal stop and vehicle crashing. Finding vehicle detection, the Spatio-temporal trajectory of multiple objects can be obtained to construct the regional short time constitute velocity model. Then the gray model theory is adopted to estimate the motion model parameters. To detect on-road abnormal moving vehicles in nighttime [11]. Oncoming, change lane, change speed, roadside parking, and overtaking vehicles are detected. This method is useful for vehicle behavior analysis system of IDAS (Intelligent Driver Assistance System). Firstly, moving objects are estimated from all video frames. Using threshold range and ROI setting moving vehicles are eliminated. Motion vectors are grouped by using K-means clustering algorithm to obtain segment abnormal vehicle candidates. The segmented candidates are classified using learning algorithm Support Vector Machines (SVMs) and various features to eliminate non-vehicle candidates.
In this paper, we proposed to detect and classify abnormal vehicles such as illegal lane crossing, near pass, slow moving and long time stopped vehicles based on vehicle tracking and speed information. The tracking information is used to detect illegal lane crossing and near pass vehicle. Similarly, slow moving and long time stopped vehicles are detected based on speed information. The rest of the article is organized as follows. In Section 2, we provide the detailed discussion on our approach for abnormal vehicle detection and classification in urban traffic video. In Section 3, experimental results are reported and discussed. Finally, the conclusion is drawn.
II. PROPOSED WORK
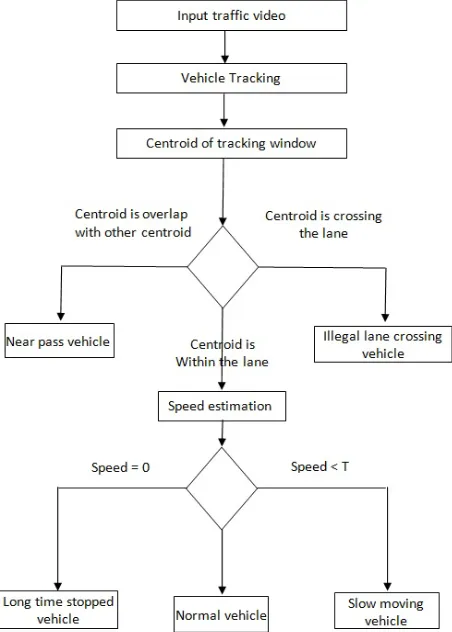
[image:2.595.333.559.356.672.2]The flow diagram of proposed approach is shown in Figure 1. The proposed method uses vehicle tracking and speed information. The centroid of tracking window of the vehicle is overlap with other vehicle’s tracking window, then the vehicle is classified as near pass vehicle. The centroid of tracking window of the vehicle is crossing outer boundary of the lane, the vehicle is classified as illegal lane crossing vehicle. The centroid of tracking window is within the lane region, then, there may be possibility of occurrence of long time stopped and slow moving event. In order to detect long time stopped and slow moving vehicle, we estimate speed of the vehicle. The speed of a vehicle is zero for last few frames, then the vehicle is classified as long time stopped vehicle. The speed of vehicle is less than user defined threshold, then the vehicle is classified as slow moving vehicle, otherwise the vehicle is classified as normal flow vehicle.
region of the road. It can be therefore identified in an initial offline learning phase and will be used in the online phase to classify illegal lane crossing vehicle. In order to find road region, we extract the background of given traffic video using Gaussian Mixture Model [13] technique based on background modeling. Figure 2(a) shows result of the background model. After obtaining background of the traffic video, Canny Edge Detector is applied to obtain edge map of the background image. Figure 2(b) shows result of the Canny edge detector. Once the edge map is identified, straight line parameters are calculated using Standard Hough Transform (SHT) [14]. Figure 2(c) shows the straight lines obtained using Standard Hough Transform. Once the Hough space is computed, local maxima are extracted, and lines that are away from a vanishing point and too short are discarded. This information is used to define the lane on which the vehicles are moving.
Figure 2. Intermediate results of detection of road region: (a) Background obtained through GMM (b)Result of Canny edge detector
(c) Straight lines obtained using Standard Hough Transform
Figure 3. Intermediate tracking results for AVSS PV easy and Urban1 video sequence
We adopted our previous work [15] for tracking vehicles. The adopted tracking algorithm constructs vehicle model based on extraction of shape and texture features using Co-occurrence Histogram of Oriented Gradient (Co-HOG) [16] and Center Symmetric Local Binary Patron (CS-LBP) operator [17]. The vehicle model captures the variations in vehicle scale, vehicle pose, and complex vehicle occlusion. After construction of vehicle model for the current frame t, the vehicle features are extracted from each extracted vehicle image and the variations are updated to vehicle model. Finally, the vehicles are tracked based on the similarity measure between current frame vehicles and vehicle model. Figure 3 Shows the intermediate results for vehicle tracking.
The illegal lane crossing vehicles are detected while tracking vehicles based on vehicles tracking window location [18]. First, compute the position of the vehicle center (x, y):
,
2
up
down
x
=
+
(1),
2
left
right
y
=
+
(2)where
up
anddown
are parameters represent the location of tracking window’s top and bottom boundaries. Similarly,left
andright
parameters are the location of tracking window’s right and left boundaries.After finding the location of vehicle center, next step is to compute the minimum distance (md) between the center of the target vehicle (x, y) and lane line. In order to detect illegal lane crossing vehicle, we compute the distance between the ½ width of the vehicle and minimum distance
[
]
Distance( )
D
=
md
−
width
2 ,
(3)where
width
2
of the vehicle is defined as:2
.
2
right
left
width
=
−
(4)If the Distance (D) is less than user-defined threshold, the vehicle is detected as illegal lane crossing vehicle. The user defined threshold is set empirically. After vehicles lane crossing judgment, illegal lane crossing vehicles are tracked to estimate the same target timely, which help to predict the location of the illegal vehicle in a period of time.
In order to detect near pass vehicle, we compute the Euclidean distance between centroid of the two vehicles (x1,
y1) and (x2, y2
(
) (
2)
21 2 1 2
,
d
=
x
−
x
+
y
−
y
).
(5)
If the d is less than the predefined threshold, the vehicle is detected and classified as near pass vehicle.
B. Long time stopped and slow moving vehicles classification
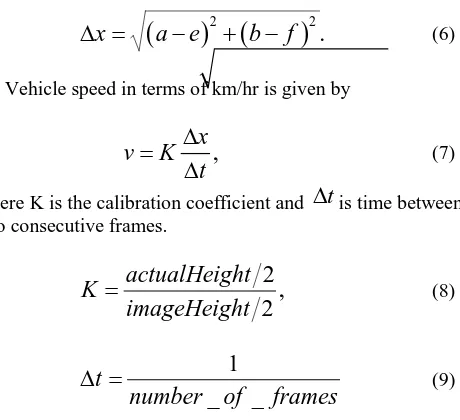
[image:3.595.68.537.186.381.2]in terms of km/hr to represent vehicle speed [19].
Suppose the tracking window centroid pixel has coordinates (a, b) in t frame and (e, f) in t-1 frame, then the distance traveled by the pixel in two consecutive frames is
(
) (
2)
2.
x
a e
b
f
∆ =
−
+ −
(6)Vehicle speed in terms of km/hr is given by
,
x
v
K
t
∆
=
∆
(7)where K is the calibration coefficient and
∆
t
is time between two consecutive frames.2
,
2
actualHeight
K
imageHeight
=
(8)1
_
_
t
number of
frames
∆ =
(9)III. EXPERIMENTAL RESULTS AND DISCUSSION
We have conducted the experiments to evaluate the proposed method for abnormal vehicle detection and classification. Since, there is no standard benchmark dataset is available, we have selected video sequences from publically available datasets such as i-Lids and GRAM-Road Traffic Monitoring (GRAM-RTM) [20]. These chosen datasets contain abnormal events such as lane crossing, near pass vehicle, slow moving, and long time stopped vehicles. In order to evaluate performance of our approach, we conducted experiments using these datasets and results were evaluated based on precision, recall, and f-measure. Precision (also called positive predictive value) is the fraction of retrieved instances that are relevant, while recall (also known as sensitivity) is the fraction of relevant instances that are retrieved. The precision and recall are estimated using the predicted results such as true positive (TP), false positive (FP), and false negative (FN). The precision and recall are defied as follows:
,
TP
precision
TP
FP
=
+
(10),
TP
recall
TP
FN
=
+
(11)The f-measure is estimated as the harmonic mean of precision and recall. The f-measure is defined as follows:
A. Experiments on i-Lids Dataset
[image:4.595.48.278.210.420.2]Among video clips of i-Lids [21], we selected AVSS PV Easy video sequence which contains abnormal vehicle such as near pass, illegal line crossing, long time stopped and slow moving. The ground truth is generated manually. The AVSS PV Easy video sequence contains 80 moving vehicles. Among 80 vehicles, four vehicles are near pass, fifteen vehicles are illegal lane crossing, three vehicles are long time stopped and fifteen vehicles are slow moving vehicles. The optimal parameters are obtained through experiments based on highest accuracy of our approach for the AVSS PV Easy video sequence. The performance of our approach is shown using confusion matrix (Table 1) obtained for AVSS PV Easy video sequence of i-Lids.
Table I. Confusion matrix obtained for our approach using AVSS PV Easy video clip
Events Normal Near pass Illegal lane crossing Longtime stopped Slow moving
Normal(43) 41 00 00 01 01
Near pass(4) 00 04 00 00 00
Illegal lane
crossing (15) 00 01 14 00 00
Longtime
stopped (3) 00 00 00 02 01
Slow moving
(15) 00 00 00 01 14
[image:4.595.326.549.596.730.2]The values in the confusion matrix describes the performance of our approach for five types of vehicles such as normal, near pass, illegal lane crossing, longtime stopped and slow moving vehicles. It is observed that our approach correctly detected all the four near pass vehicles where as in case of illegal lane crossing and slow moving vehicles, its performance is decreased with minimal error rate.
Table II. Evaluation results of our approach using precision, recall, and f-measure for AVSS PV Easy video sequence of i-Lids
Events Precision (%) Recall (%) f-measure (%) Normal
97.56 95.23 96.38
Near pass
75.00 100 85.71
Illegal lane
crossing 92.28 92.85 92.56
Longtime
stopped 100 66.66 79.99
Slow moving
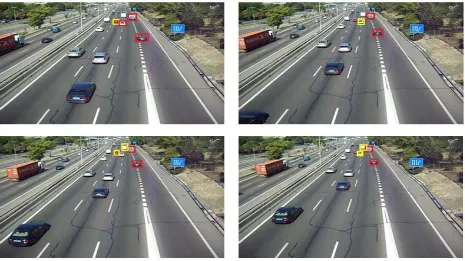
Figure 4. Visual results of our approach for vehicle abnormality detection and tracking, yellow color tracking window for near pass, red color tracking window for illegal lane crossing, green color tracking window for longtime stopped, and blue color tracking window for slow
moving vehicle for AVSS PV Easy video sequence of i-Lids subset
The Table 2 shows the evaluation of our approach using precision, recall and f-measure using AVSS PV Easy video sequence of i-Lids. It is observed that accuracy of our approach is 96.38 for normal vehicles where as for long time stopped vehicles, we achieved lowest accuracy of 79.99%. For other classes of vehicles, we achieved promising results with very less error rate.
Figure 4 shows the visual results of our approach on
five vehicles are near pass and forty-seven vehicles are illegal lane crossing vehicles. The ground truth for M30 video frames is generated manually. The GRAM-RTM of M30 video sequence contains 7529 video frames with the resolution 800 x 480. Table 3 shows the confusion matrix obtained for detection of normal, near pass and illegal lane crossing vehicles on M30 video sequence.
Table III. Confusion matrix obtained for our approach using M30 video sequence of GRAM-RTM
Events Normal Near
pass
Illegal lane crossing Normal (280)
278 00 02
Near pass (5) 00 04 01
Illegal lane crossing
(47) 01 01 45
The values in the confusion matrix describe the performance of our approach for detection of three types of vehicles such as normal, near pass, illegal lane crossing vehicles. From the experimental results, It is observed that among five near pass vehicles, our approach correctly detected four near pass vehicles and one vehicle is incorrectly detected as illegal lane crossing vehicle. Similarly, among forty seven illegal lane crossing vehicles, forty five are correctly detected and two vehicles are incorrectly detected as near pass and normal vehicle. Hence, our approach performance is very high with minimal error rate.
The Table 4 shows the evaluation of our approach using precision, recall and f-measure on M30 video sequence of GRAM-RTM dataset. It is observed that accuracy of our approach is 99.09% for normal vehicles where as for near
Near pass 75.00 75.00 75.00
Illegal lane
crossing 97.77 95.65 96.70
Figure 5 shows the visual results of our approach on M30 video sequence of GRAM-RTM. The yellow colored window is used to show detected near pass vehicle, red colored window for illegal lane crossing. From the visual results, it is observed that our approach accurately detect and classify abnormal vehicles in M30 video sequence.
The increase in accuracy of our approach is due to usage of vehicle model during tracking of the vehicle. The vehicle model captures the variations occurred in vehicle shape and appearance. The shape and vehicle appearance are captured using shape and texture features. The texture features extracted using CS-LBP operator, which helps to extract the slow moving vehicle texture features. The shape features which are extracted using Co-HOG helps to extract the actual shape of the moving vehicle. The combination of shape and texture features improves the accuracy of our approach. [image:6.595.73.538.524.785.2]
Figure 5. Visual results of our approach for vehicle abnormality detection and tracking, yellow color tracking window for near pass, red color tracking window for illegal lane crossing vehicle for M30 video sequence of GRAM-RTM
Figure 6. some false detection results.
IV. CONCLUSION
In this paper, we present a novel approach for detection and classification of abnormal vehicles in urban highways. Our approach uses vehicle tracking and speed information in order to detect and classify abnormal vehicles such as illegal lane crossing, near pass, slow moving and long time stopped vehicles. The tracking information is used to detect illegal lane crossing and near pass vehicle. Similarly, slow moving and long time stopped vehicles are detected based on speed information. The evaluation results are obtained using our approach on the subsets of i-Lids and GRAM-RTM dataset. The experimental results demonstrate that our approach achieves the highest accuracy. The limitations of our approach is that when the vehicle is moving too close to the other vehicle, the two vehicles looks like a single vehicle that causes wrong judgment. Another limitation is that when the vehicle is moving too close to the lane line, the vehicle looks like partially occluded with lane line that leads to the wrong decision.
V. REFERENCES
[1] Akoz, o., & Karsligil, M. E. (2011, September). Severity classification of abnormal traffic events at intersections. In Image Processing (ICIP), 2011 18th IEEE International Conference on (pp. 2409-2412). IEEE.
[2] P. Kumar, S. Ranganath, H. Weimin, and K. Sengupta, “Framework for real-time behavior interpretation from traffic video”, IEEE Transactions on Intelligent Transportation Systems, vol.
[3] P. Babaei, “Vehicles behavior analysis for abnormality detection by multi-view monitoring”,
6(1), 2005, pp. 43-53.
Int. Res. J. Appl. Basic Sci, vol.
[4] H. S. Song, S. N. Lu, X. Ma, Y. Yang, X. Q. Liu, and P. Zhang, “Vehicle behavior analysis using target motion trajectories”,
9(11), 2015, pp. 1929-1936.
IEEE Transactions on Vehicular Technology, vol.
[5] E. Jiang, and X. Wang, “Analysis of abnormal vehicle behavior based on trajectory fitting”,
63(8), 2014, pp. 3580-3591.
Journal of Computer and Communications, vol.
[6] H. Huang, Z. Cai, S. Shi, X. Ma, and Y. Zhu, “Automatic detection of vehicle activities based on particle filter tracking”,
3(11), 2015, pp. 13.
Proc. ISCSCT, vol .
[7] M. Pucher, D. Schabus, P. Schallauer, Y. Lypetskyy, F. Graf, H. Rainer, and B. Schalko, “Multimodal highway monitoring for robust incident detection” , In
2(2), 2009, pp.2.
[8] O. Akooz, and M. E. Karsligil, “Severity detection of traffic accidents at intersections based on vehicle motion analysis and multiphase linear regression”, In
Intelligent Transportation Systems (ITSC), 13th International IEEE Conference, 2010, pp.837-842.
[9] J. Chen, and Q. Zhao, “Video Based Vehicle Tailgate Behavior Detection in Urban Road Junction”. In
Intelligent Transportation Systems (ITSC),13th International IEEE Conference, 2010, pp. 474-479.
Future Computer Sciences and Application (ICFCSA), International Conference on IEEE,
[10] H. Li, Q. Wu, and A. Dou, “Abnormal traffic events detection based on short-time constant velocity model and spatio-temporal trajectory analysis”, Journal of Information & Computational Science,
2011, pp. 19-24.
vol.
Proceedings of the 17
[14] Nguyen, Thuy Tuong, Xuan Dai Pham. and Jae Wook Jeon, "An improvement of the Standard Hough Transform to detect line segments" In Industrial Technology, IEEE International Conference, 2008, pp. 1-6.
International Conference, IEEE, vol. 2, 2004, pp. 28-31.
[15] Arun Kumar, H. D., Prabhakar, C. J. (2016), “Moving Vehicles Detection in Traffic Video Using Modified SXCS-LBP Texture Descriptor”,International Journal of Computer Vision and Image Processing (IJCVIP), Vol
[16] T. Watanabe, S. Ito, and K. Yokoi, “Co-occurrence histograms of oriented gradients for pedestrian detection”, In
5, No. 2, pp14-34.
adaptive decision for illegal situation", Applied soft computing vol. 11(7), 2011, pp. 4399-4412.
[19] A. G. Rad, A. Dehghani, and M. R. Karim, “Vehicle speed detection in video image sequences using CVS method”, International Journal of Physical Sciences, vol.
[20] Guerrero-Gomez-Olmedo, Ricardo, J. Roberto, López-Sastre, Saturnino Maldonado-Bascón, and Antonio Fernández-Caballero, "Vehicle tracking by simultaneous detection and viewpoint estimation", In International Work-Conference on the Interplay Between Natural and Artificial Computation, Springer Berlin Heidelberg, 2013, pp. 306-316.
5(17), 2010, pp. 2555-2563.

![Figure 6. some false detection results.[3] P. Babaei, “Vehicles behavior analysis for abnormality](https://thumb-us.123doks.com/thumbv2/123dok_us/686171.1076000/7.595.58.553.105.408/figure-detection-results-babaei-vehicles-behavior-analysis-abnormality.webp)
