R E S E A R C H
Open Access
VSTP: vessel spatio-temporal contact
pattern detection based on MapReduce
Chao Liu
†, Zhongwei Sun
*†, Jing Liu, Haiguang Huang, Zhongwen Guo and Yuan Feng
Abstract
Due to lack of the coverage of 3G/4G network, satellite communication which costs excessively is the main approach used in ocean to provide network service. Ocean mobile delay tolerant network (OMDTN) can provide low-cost data transmission service in the network by utilizing the contact chances of moving vessels. Spatio-temporal contact pattern is one of the key metrics to improve the efficiency of the routing algorithm in OMDTN. Some researches have been carried out on human handheld device and vehicular ad hoc networks (VANETs). However, the vessel’s trajectory data is distributed and stored disorderly, which makes traditional contact pattern detection algorithm cannot be directly applied. In this paper, we design a parallel algorithm named VSTP based on MapReduce to detect spatio-temporal contact pattern from trajectories of over 2000 vessels. Studying the vessels’ trajectories and the contact records, we observe that the vessels’ contact pattern including inter-contact time distribution and contact times distribution is in sharp contrast to the study on human handheld device and VANETs. Our results can provide the guidelines for the design of data routing protocols on OMDTN and give a new solution to overcome the difficulty of ocean network coverage.
Keywords: Contact pattern, Empirical data analysis, Delay tolerant network, MapReduce, Sensor network
1 Introduction
Ocean network communication is one of the most impor-tant research topics in the field of ocean information tech-nology in the future. It plays an important role in vessel communication, ocean observation and military security. Currently, the main communication means of ocean ves-sels include HF and VHF radio communication [1–3], onboard laser communication [4], cellular mobile net-work [5], and maritime satellite communication [6]. HF and VHF radio communication are vulnerable to atmo-spheric interference, thus having blind coverage areas and poor confidentiality. Its communication requires a prede-termined frequency which makes it impossible to provide network service in large-scale ocean area. At present, it is only suitable for the internal communication among fleet of vessels and the directional communication to the seashore base station. Laser communication has many advantages, such as high bandwidth and confidentiality, but it is not suitable for providing general oceanic network
*Correspondence: [email protected] †Equal contributors
Department of Information Science and Engineering, Ocean University of China, Songling Road No. 238, Qingdao 266100, China
communication services due to the targeting problem. Because of high cost of setting up the ocean base station, the cellular network cannot provide the network cover-age for medium or long distance of sea area and frequent network data transmission will lead to high communica-tion cost. Currently, maritime satellite communicacommunica-tion is a good way of ocean network communication. However, the high price of terminals and communication expenses prohibit it from large-scale application.
In short, existing ocean communication schemes are restricted by the limitation of the communication mode and high infrastructure deployment cost and commu-nication expenses; thus, they cannot provide low-cost large-scale oceanic network services. Hence, ocean net-work communication is a problem that should be solved quickly. The ocean mobile delay tolerant network can provide mutual communication opportunity through the movement of the vessels in the network and provide low-cost data transmission service in the whole network with-out any infrastructure. In the process of data rwith-outing in the mobile delay tolerant network, the optimal routing path can be computed efficiently if the obtained information base (such as the contact pattern, hot spots area among
nodes, and the movement pattern model) is very compre-hensive. Therefore, it is the key problem in the research of ocean network communication to explore the rules of vessel movement and contact pattern from the large-scale moving trajectory data of vessels.
However, there are many unique characteristics of vessel trajectory data. Firstly, the vessel moving trajectory data is sparse. Due to the pressure of the base stations, capacity constraints of satellite communication, equipment’s sta-bility and the vessel density in the sea and so on, under normal circumstances, the timestamp interval of vessel trajectory data is different and it is from 3 to 20 min in general. This results in the characteristic of sparseness in the vessel trajectory data. The missing data is short-time missing data. In addition, because some fishermen lack the safety operation awareness and do not open the VMS (Vessel Monitoring System), there is long-term missing data in part of the vessels’ trajectory.
Secondly, the vessel trajectory data is stored distributed and not time-sequential. And it can be divided into real-time positioning data by Beidou satellite and Automatic Identification System (AIS) data. Because of the large amount of trajectory data and various acquisition meth-ods, the trajectory data is distributed stored. Due to the quality influence of the satellite communication and the communication range limitation of the AIS’s base sta-tion on shore, the vessel moving trajectory data cannot be stored into the information system in real time. Thus, the vessel moving trajectory data is not time-sequential. The non-sequential and distributed stored trajectory data brings great difficulties to its sorting, processing, and mining.
Finally, the vessel density distribution is uneven. Due to the fishing moratorium restrictions and uneven distribu-tion of ports and fishery resources, the ocean vessel has obvious hot spot areas and spatio-temporal correlation characteristic [7] which is different from the traditional VANETs and human handheld device [8, 9].
In this paper, we propose vessel spatio-temporal contact pattern detection algorithm based on MapReduce called VSTP and analyze the vessel contact pattern including inter-contact time distribution [10–12], contact times dis-tribution and so on. To the best of our knowledge, this is the first systematic vessel spatio-temporal contact pattern detection strategy in the ocean communication field. And it is the first paper about vessel spatio-temporal contact pattern detection with real data in this field.
Our main contributions are as follows:
(1) We carry out the quantitative and qualitative analysis of vessel spatio-temporal contact pattern detection for the first time on the basis of vessel trajectory data. (2) We propose vessel spatio-temporal contact pattern
detection in parallel based on MapReduce model.
(3) We establish inter-contact time distribution and sailing alone time distribution modelings.
The rest of this paper is organized as follows. Firstly, some related works are introduced in Section 2. Secondly, a parallel algorithm named VSTP based on MapReduce is designed in Section 3. After that, the experiment and modeling are presented in Section 4. Finally, the paper is summarized in Section 5.
2 Related work
The research goal of ocean mobile delay tolerant net-work is to achieve data transmission service with high efficiency and low cost. At present, there is little research result about the key technologies of the ocean mobile delay tolerant network for the vessels. Existing research results mainly focus on the traditional mobile delay tol-erant network for vehicle and handheld devices. Existing node contact pattern and data routing algorithm of mobile delay tolerant network are introduced as follows. Also, the parallel data processing technology is introduced in this section.
2.1 Node movement and contact pattern
problem is an important factor affecting the inter-contact time between taxies. However, the vessel trajectory data is stored distributed and non-sequential which makes it difficult to achieve the sorting of the full data set. There-fore, it is necessary to propose a new method to solve the problem.
2.2 MDTN routing algorithm
According to the use of historical information, we divide the algorithms into two categories.
The algorithms that do not use historical information are always designed to transfer the data to the node, which improves network performance (such as reducing transmission delay, improving delivery ratio). RAPID take the MDTN routing as resource allocation problem [17]. The authors predict the inter-contact time and transmis-sion delay based on exponential distribution and calcu-late the optimal data transmission path which improves network performance with the limitation of bandwidth and buffer. On the basis of RAPID, Lee et. al. designed an algorithm called Max-Contribution which takes joint resource allocation problem of link scheduling, data transmission, and data copies into consideration [18]. Based on local knowledge base, authors designed a greedy algorithm to solve the transmission path calculation problem.
Taking advantages of comprehensive historical infor-mation will further improve the efficiency of routing algorithm. The historical information-based algorithms usually use the community structure and centrality as the basic information [19]. The community structure is used to describe the intimate relationship among nodes, and centrality is used to describe the active degree of nodes in the network. Based on the above properties, Bubble rap algorithm utilizes global centrality and local central-ity to design the routing algorithm [19]. When the nodes of different communities encounter, the packets will be forwarded along the increment direction of the global centrality. When the data is forwarded to the destina-tion community, it will be forwarded along the increment direction of the local centrality, and the data will be sent to the destination node. According to the contact pattern of vehicle, the author designs ZOOM algorithm [20]. The algorithm uses the information entropy and the modu-larity parameter to analyze the vehicle’s contact pattern, and trains the higher order Markov chain by the histori-cal contact information. Based on Markov chain and other related parameters, the algorithm can predict the future contact information effectively and improve the delivery ratio of the package.
2.3 MapReduce
MapReduce is a widely used programming model and an associated implementation for processing and generating
big data sets with a parallel, distributed algorithm on a cluster [21, 22]. A MapReduce computation is combined by a number of map tasks and reduce tasks, which are respectively executed by two kinds of basic com-puting units called mappers and reducers [23]. Lots of works are carried out from many aspects to improve the performance of MapReduce cluster, such as placement [24], blocking operator [25], I/O optimization [26], task scheduling [27], and hybrid system [28].
In this paper, we utilize MapReduce programming model to deal with large amounts of non-serialization dis-tributed vessel data, which overcomes multiple defects of existing methods.
3 VSTP design
In order to investigate the contact pattern between vessels, it is important to analyze large number of vessels’ tra-jectories. In this section, we first introduce the trajectory data collected by Beidou satellite system and Automatic Identification System (AIS). Then, we will give a brief introduction of sliding time window algorithm and its dis-advantages. Finally, we will provide the VSTP algorithm that can be used to detect the contact pattern of vessels. The algorithm is designed based on MapReduce, which can solve the problems of big data, disorder storage, and distributed storage.
3.1 Trajectory data collection
The trajectory data used in this paper is collected by ves-sel monitoring system of Zhejiang Province Ocean and Fisheries Bureau, which contains the data from AIS and Beidou Satellite.
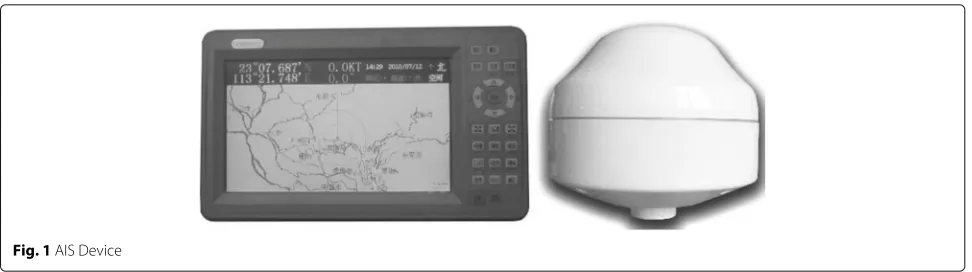
The AIS device shown in Fig. 1 is equipped in most vessels sailing on the ocean. It stores the vessel’s basic information, such as Maritime Mobile Service Identify (MMSI), vessel type, location, destination, direction, and velocity. The device broadcasts the information to vessels and shore base station in its communication range. When the vessel is out of the range of base station, it will store the informa-tion in the device and wait for the next contact. Because the information is not received in real time and there are lots of base stations distributed ashore, the tra-jectory data is distributed and stored disorderly. Due to the operating principle, the trajectory data of AIS is not real-time data.
Fig. 1AIS Device
3.2 Data preprocess
In order to improve the availability of the data, the data needs to be cleaned and preprocessed. Because the device is unstable, nearly 5% of vessels’ data is rare and incom-plete which needs to be deleted from the dataset.
Then, we use velocity filter to filter the noise points caused by signal problem. We use velocitymax to
repre-sent the maximum velocity of a vessel in the dataset. The velocity is acquired by GPS device which eliminates the error of the current. We calculate the Euclidean distance between neighbor points from the first point and calculate the average velocity of it. If the average velocity is greater than(velocitymax∗λ), we will delete the latter point of this
neighbor from the dataset.λis the measurement parame-ter. The smaller it is, the sensitive the filter will be. In this paper, we setλto 1.5. The filter will firstly check whether the first point is noise. If the average velocity between the first and second points is far greater than velocitymax. We
will then check the second and the third points’ average velocity. If it is far greater than the velocitymax, we will
treat the second point as noise. Otherwise, we will treat the first point as noise.
Data sparsity will also influence the data availability. The time interval of the record is from 30 to 300 s. Before utilizing the data, we use the high order spline interpola-tion algorithm called OceanRoute to preprocess it which makes it more dense and available [29]. The OceanRoute utilizes vessel turning feature and solve eight equations to accurately interpolate the data. The experiment results in [29] show that the algorithm is usable and efficient.
3.3 Sliding time window algorithm
Ideally, in order to detect all the contact of the vessels, the time interval of the data should be 1 s. Due to the data storage pressure and the devices’ communication capability, the data collection of trajectories is always in sparse granularity. Researchers use sliding time window algorithm to deal with the data sparseness problem. The algorithm assumes that there is a time window sliding on the timeline. The objects in the time window are checked with each other to detect whether other objects are in
their communication range. Then, they make the time window slide forward to the end of the timeline. If a large time window is selected, the algorithm may detect some false contacts which do not exist. If a small time window is selected, the algorithm may ignore some real contacts which exist [16].
The sliding time window algorithm has three disadvan-tages. Firstly, due to the data sparseness problem, this algorithm is likely to divide the long contact duration into several small contact durations, which results in the inaccurate detection of contact pattern. Secondly, this algorithm can only be used in the situation that all the data is sequentially stored by timestamp in one place. If we want to use sliding time window algorithm, the pre-processing work needs to be done. As shown in Fig. 2, each server stores part of trajectory data. Different col-ors stand for different vessels’ data. The time sequence of the data is shown in corner mark. All the data needs to be transmitted to the calculating server. Then, it will run sorting algorithm to transform the data into time-series data. When facing big data problem, the calculating server may need much memory and storage space, the sorting algorithm and sliding time window algorithm will also cost so much time. Thirdly, this algorithm cannot be par-alleled. The sliding time window algorithm needs to let the time window slide on the timeline to check the con-tacts. If the timeline is divided into pieces, the data near dividing lines will be ignored, which will result in inaccurate pattern.
3.4 Algorithm design
Fig. 2Preprocessing of sliding time window algorithm
3.4.1 Mapping
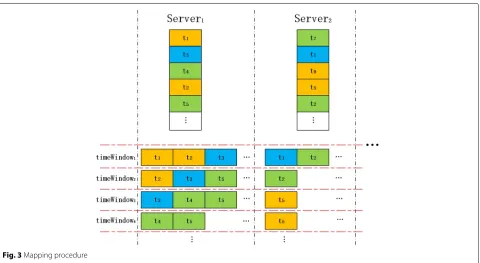
The mapping procedure is designed to generate interme-diary key-value pairs including timeWindow ID and vessel data. The length of time window is denoted byτ. The time interval of timestamp is denoted byw. The time window ID should be the starting timestamp of the time window. The quantity of time window should be the same as times-tamp (not the quantity of records). The data record is denoted by< t,data >, wheret stands for timestamp, data includes the vessel’s ID, location, direction, velocity and so on. Based on the idea of sliding time window algo-rithm, record < t, data > should fall into all the time
windows in time slot [t−τ,t]. An illustrating example is shown in Fig. 3. We assume the time intervals are all the same, and the length of time window isτ = 2w. Obvi-ously, timeWindow1 should contain all the data whose
timestamp ranges fromt1tot3. The timeWindow2should
contain all the data whose timestamp ranges fromt2tot4.
So as other timeWindows.
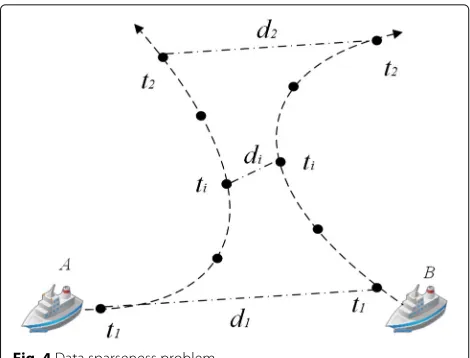
Coarse granularity of data records has negative influ-ence on contact detection. As shown in Fig. 4, vesselsA andBonly have the location data ont1andt2. Distance
d1andd2are greater than the communication radius, so
the system makes the judgment of non-contact. However,
Fig. 4Data sparseness problem
in timetibetweent1andt2, the distancedi may be less
than the communication radius. To acquire more accurate result, we add interpolation procedure in Mapping.
Algorithm 1:Mapping
Input :Trajectory Data<t,data>;
Output:Intermediary Key-Value Pairs
<timeWindow,interData>; i=t−τ;
whilei<=tdo
timeWindow=JudgeTimeWindow(i); tempData=Interpolation(i,data);
EmitIntermediate(timeWindow,tempData); i=i+w;
end
ifi != t + wthen
EmitIntermediate(t,data);
end
The pseudocode of mapping is shown as Algorithm 1. Function JudgeTimeWindow is designed to calculate timeWindow which the record belongs to. Function Inter-polation realizes the OceanRoute algorithm [29] to inter-polate the data in order to acquire more accurate result. Then, the mapping procedure will generate intermediate key-value pairs.
3.4.2 Reducing
The reducing procedure is designed to process all the intermediary key-value pairs. The intermediary key-value pairs which have the same interKey would be processed by the same reducer. The communication radius is denoted byr. The reducer needs to calculate each pair of records’ distance. If the distance is less thanr, a contact and other related information should be marked.
The pseudocode of reducing is shown as Algorithm 2. Each reducer traverses all the record pairs which have the same timeWindow id to check whether their distance is within the communication range. If so, the reducer will generate a record which contains id pair, contact times-tamp, contact location, and contact duration. Especially, the parameter idPair is a string combined by vessels’ id and character ’ , ’ . Because “id1, id2” and “id2, id1” are the
same pair of vessels, in order to ease the calculating pro-cess, the idPair should be combined in ascending order as shown in Algorithm 2. The contact duration is esti-mated by vessels’ current location, velocity, and direction, which will be used by merging procedure. The estimation method is shown as below.
Algorithm 2:Reducing
Input :Intermediary Key-Value Pairs
<timeWindow,interDatas>;
Output:Contact Record<idPair,recordData>;
fori=0; i< (interDatas.length−1); i+ +do forj=i+1; j<interDatas.length; j+ +do
ifinterDatas[i] .id==interDatas[j] .idthen
continue;
end
d=CalDistance(interDatas[i] ,interDatas[j]);
ifd<=rthen
ifinterDatas[i] .id>interDatas[j] .idthen
idPair=interDatas[j] .id+ ’ , ’ + interDatas[i] .id;
else
idPair=interDatas[i] .id+ ’ , ’ + interDatas[j] .id;
end
recordData.Add(timeWindow); recordData.Add(contactLocation); duration =
CalDuration(interDatas[i] ,interDatas[j]); recordData.Add(duration);
Emit(idPair,recordData);
end end end
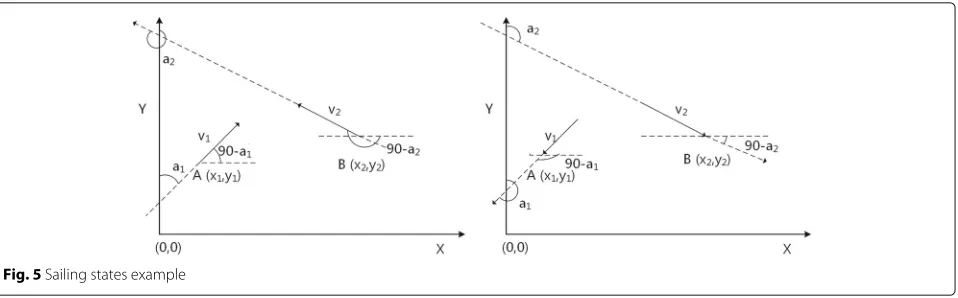
In order to predict the duration of communication between the two vessels, we assume that the current posi-tion, velocity, and angle of the vessel A are(x1,y1),v1,α1
and the current position, velocity, and angle of the ves-sel B are (x2,y2),v2, α2 respectively, as shown in Fig. 5.
And we also assume that the farthest communication dis-tance between the two vessels isr. Therefore, we can get the positions of vessel A and B after timet, that is,(x1,y1)
Fig. 5Sailing states example
x1=v1cos(90−α1)t+x1 (1)
y1=v1sin(90−α1)t+y1 (2)
x2=v2cos(90−α2)t+x2 (3)
y2=v2sin(90−α2)t+y2 (4)
Consequently, we can obtain the time range of the two vessel communications via solving the following formula.
(x1−x2)2+(y1−y2)2≤r2 (5) Based on these above formulas (1), (2), (3) and (4), we can get the following inequality.
(v1cos(90−α1)−v2cos(90−α2))2+
(v1sin(90−α1)−v2sin(90−α2))2t2+
2{(v1cos(90−α1)−v2cos(90−α2))(x1−x2)+
(v1sin(90−α1)−v2sin(90−α2))(y1−y2)}t+
(x1−x2)2+(y1−y2)2−r2≤0
(6)
For notational simplicity, we make the following settings.
a=(v1cos(90−α1)−v2cos(90−α2))2+
(v1sin(90−α1)−v2sin(90−α2))2
(7)
b=2{(v1cos(90−α1)−v2cos(90−α2))(x1−x2)+
(v1sin(90−α1)−v2sin(90−α2))(y1−y2)}
(8)
c=(x1−x2)2+(y1−y2)2−r2 (9)
Therefore, inequality (6) can be converted to the follow-ing inequality.
at2+bt+c≤0 (10)
As can be seen from inequality (10), it is a typical one-variable quadratic inequality. By solving inequality (10), we can obtain the communication time ranges of the two vessels. Therefore, we can predict the duration of communication between the two vessels.
3.4.3 Merging
Sliding Time Window Algorithm may divide one real con-tact into several small concon-tacts [16], so merging procedure based on MapReduce is designed to avoid this problem. Firstly, we need a simple mapping procedure to reshuffle the key-value pairs based on idPair. Then, another round of reducing is needed to merge the contacts. If the sec-ond contact time of the same pair of vessels is within the estimated contact duration range, the reducer will merge the contact and update the contact parameters. The pseudocode is shown as Algorithm 3.
Algorithm 3:Merging
Input :Contact Record<idPair,recordDatas>;
Output:Merging Record<idPair,recordData>;
AsceSorting(recordDatas.timeWindow); i=0;
whilei< (recordDatas.length−2)do
j=i+1;whilerecordDatas[i] .timeWindow+ recordDatas[i] .timeWindow.duration>=
recordDatas[j] .timeWindowdo
j+ +;
end
ifi==j−1then
Emit(idPair,recordDatas[i]);i+ +;
else
recordDatas[j−1] .timeWindow= recordDatas[i] .timeWindow;
recordDatas[j−1] .contactLocation= recordDatas[i] .contactLocation; recordDatas[j−1] .duration= recordDatas[j−1] .timeWindow− recordDatas[i] .timeWindow+ recordDatas[j−1] .duration;i=j−1;
Emit(idPair,recordDatas[i]);
4 Experiments and modeling
In this section, we will conduct experiments to analyze and model the contact pattern.
4.1 Experiments design
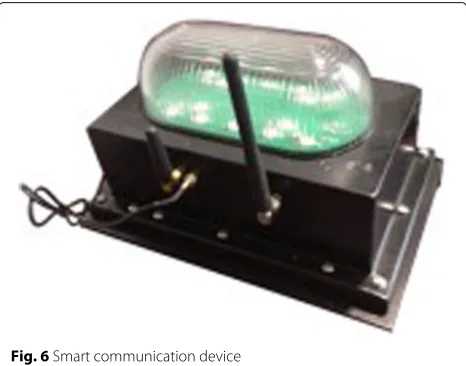
The contact records are computed among 2093 vessels in 2 weeks. The VSTP is running on SUGON High Per-formance Cluster TC4600T, which contains eight nodes. Each node has 32 GB memory, two Intel (R) Xeon(R) CPU E5-2670(2.60 GHz). The operating system is Linux cen-tOS 6.5. The Hadoop version is 2.3.0. All the PCs can be treated as Mapper and reducer in this experiment. By con-trasting the data results between sliding time window and the ONE (Opportunistic Network Environment) simula-tor, we set the time windows to 60 s. The communication ranges are set to 1 km according to the Zigbee vessel smart communication device’s performance in Fig. 6.
4.2 Result analysis
We process the contact records and generate some repre-sentative contact pattern results.
Figure 7a illustrates the inter-contact time distribution result. All the plots are plotted in linear-log scale coordi-nate. The result is in sharp contrast to the study on human handheld device and VANETs. It exhibits a multiple expo-nential distribution within 10 days, i.e., P{X > t} ∼ ae−αt+beβt. Over a large range of timescale, the distribu-tion starts to deviate from regular decay. Considering the requirements of OMDTN, large inter-contact time gives less contribution to establish the OMDTN, so the mul-tiple exponential distribution within 10 days is enough to generate the contact pattern. The modeling would be discussed in Subsection 4.3.
Figure 7b, c illustrates vessel contact times’ distribution and sailing alone time distribution results. They indicate the vessels’ activeness. Nearly 40% vessels have more than
Fig. 6Smart communication device
2000 contacts during 14 days as shown in Fig. 7b. Consid-ering the voyage cycle, most vessels have more than 200 contacts on average each day. Figure 7c shows that only 2% of vessels would sail alone more than 2000 s (about 30 min), which means most vessels always have contacts with other vessels during their voyage.
Figure 7d illustrates contact times distribution of same pair of vessels. It indicates the intimacy of vessel pairs. The quantity of pairs declines with the increase of con-tact times. From records, we could see that 54051 pairs of vessels contact more than 10 times. Storing this informa-tion in the knowledge base of each vessel may have great contribution to the design of OMDTN.
Figure 7e, f illustrates the periodic regularity of con-tact times. From Fig. 7e, we could see that the concon-tact times of the whole data set changes on a 24-h cycle. Based on this discovery, we calculate average contact times in 24 h. Obviously, vessels have more contacts during day-time as shown in Fig. 7f, which indicates that the vessels could have more opportunities to deliver the package in the daytime.
4.3 Modeling
Fig. 7Contact pattern results (a) Inter-contact time distribution (b) Vessel contact times distribution (c) Vessel sailing alone time distribution (d) Contact times distribution of same (e) Contact times of each hour(part) (f) Average contact times
4.4 Discussion
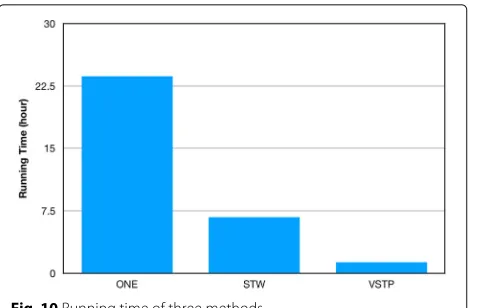
In this paper, we utilize MapReduce model to process non-time serialization distributed vessel data. In order to prove the superiority of our algorithm, we also carry out other two methods (Sliding Time Window and ONE Sim-ulator) to detect the contacts in one node of TC4600T. Sliding Time Window and ONE Simulator also need the data sequentially stored in one place, because these two methods cannot be paralleled. The results of three
Fig. 8Inter-contact time distribution modeling
methods are nearly the same. The running time of three methods is shown in Fig. 10. The running time of ONE and STW in 60 s time window, which do not include the data sorting time, is 23.67 and 6.73 h respectively. The VSTP uses 1.31 h to process all the data without sort-ing, and the processing time could further be improved by adding more nodes. From discussion, we could see that our work is better than existing methods for efficiency and flexibility.
Fig. 10Running time of three methods
5 Conclusions
In this paper, we design a parallel algorithm based on MapReduce called VSTP to process the 2-week-long dis-crete trajectory data of 2093 vessels and detect the contact between each pair of vessels. We surprisingly found that the contact pattern is in sharp contrast to the study on human handheld device and VANETs. Based on the pat-tern, we modeling parts of contact pattern to get more general result. Our results can provide the guidelines for the design of data routing protocols on OMDTN and give a new solution to overcome the difficulty of ocean network coverage.
Nevertheless, many issues still remain to be explored. Our ongoing works are as follows: (1) further mining the contact records and utilizing the contact location to establish contact location changing pattern; (2) evaluating VSTP on larger data sets and deeply mining the record for longer period; (3) designing OMDTN routing algo-rithm based on these patterns to overcome the difficulty of ocean network coverage.
Acknowledgements
This work was supported by the National Natural Science Foundation of China grant 61379127, 61379128, 61572448, the National Key R&D Program 2016YFC1401900, the Fundamental Research Funds for the Central Universities 201713016, and Qingdao National Labor for Marine Science and Technology Open Research Project QNLM2016ORP0405.
Authors’ contributions
CL and ZS design a parallel algorithm named VSTP based on MapReduce and establish two distribution modelings. All authors contributed to the interpretation of the results and writing of the manuscript. All authors read and approved the final manuscript.
Competing interests
The authors declare that they have no competing interests.
Publisher’s Note
Springer Nature remains neutral with regard to jurisdictional claims in published maps and institutional affiliations.
Received: 31 May 2017 Accepted: 13 October 2017
References
1. D Senic, A Sarolic, inInternational Conference on Software,
Telecommunications and Computer Networks. Simulation of a shipboard VHF antenna radiation pattern using a complete sailboat model (IEEE, Hvar, 2009), pp. 65–69
2. Seni´c, Šaroli´c, inInternational Symposium Elmar 2010. Simulation of slanted shipboard VHF antenna radiation pattern (ELMAR, Zadar, 2010), pp. 293–296
3. S Sathyamurthy, S Sundaresh, Performance simulation of hf-vhf mobile radio systems in a tactical vehicle. Def. Sci. J.58(6), 762–767 (2008) 4. WS Rabinovich, CI Moore, R Mahon, PG Goetz, HR Burris, MS Ferraro,
JL Murphy, LM Thomas, GC Gilbreath, M Vilcheck, Free-space optical communications research and demonstrations at the U.S. Naval Research Laboratory. Appl. Opt.54(31), 189 (2015)
5. MJ Farooq, H Ghazzai, A Kadri, H Elsawy, MS Alouini, A hybrid energy sharing framework for green cellular networks. IEEE Trans. Commun.
PP(99), 1–1 (2016)
6. B Evans, M Werner, E Lutz, M Bousquet, GE Corazza, G Maral, R Rumeau, Integration of satellite and terrestrial systems in future multimedia communications. IEEE Wirel. Commun.12(5), 72–80 (2005)
7. Y Zong, H Huang, F Hong, Y Zhen, Z Guo, inIEEE/MTS Techo-Ocean 2016 Conference. Recognizing fishing activities via vms trace analysis based on mathematical morphology (IEEE, Kobe, 2016)
8. G Yan, DB Rawat, Vehicle-to-vehicle connectivity analysis for vehicular ad-hoc networks. Ad Hoc Networks.58, 25–35 (2017)
9. M Zarei, AM Rahmani, H Samimi, Connectivity analysis for dynamic movement of vehicular ad hoc networks. Wirel. Netw.23, 1–16 (2017) 10. A Chaintreau, P Hui, J Crowcroft, C Diot, R Gass, J Scott, inINFOCOM 2006.
IEEE International Conference on Computer Communications, Joint Conference of the IEEE Computer and Communications Societies, 23-29 April 2006. Impact of human mobility on the design of opportunistic forwarding algorithms (IEEE, Barcelona, 2006), pp. 1–13 11. T Henderson, D Kotz, I Abyzov, The changing usage of a mature
campus-wide wireless network. Comput. Netw.52(14), 2690–2712 (2008) 12. P Hui, A Chaintreau, J Scott, R Gass, J Crowcroft, C Diot, inProceeding of
the 2005 ACM SIGCOMM Workshop on Delay-tolerant Networking. Pocket switched networks and the consequences of human mobility in conference environments (ACM, Philadelphia, 2005), pp. 244–251 13. N Eagle, A Pentland, Reality mining: sensing complex social systems. Pers.
Ubiquit. Comput.10(4), 255–268 (2006)
14. T Henderson, D Kotz, I Abyzov, The changing usage of a mature campus-wide wireless network. Comput. Netw.52(14), 2690–2712 (2008) 15. T Karagiannis, JYL Boudec, Vojnovi´c, inACM International Conference on
Mobile Computing and NETWORKING. Power law and exponential decay of intercontact times between mobile devices (ACM, Montréal, 2007), pp. 183–194
16. H Zhu, M Li, L Fu, G Xue, Y Zhu, LM Ni, Impact of traffic influxes: Revealing exponential intercontact time in urban vanets. IEEE Trans. Parallel Distrib. Syst.22(8), 1258–1266 (2011)
17. A Balasubramanian, B Levine, A Venkataramani, inConference on Applications, Technologies, Architectures, and Protocols for Computer Communications. Dtn routing as a resource allocation problem (ACM, Kyoto, 2007), pp. 373–384
18. K Lee, Y Yi, J Jeong, H Won, inINFOCOM, 2010 Proceedings IEEE. Max-contribution: on optimal resource allocation in delay tolerant networks (IEEE, San Diego, 2010), pp. 1–9
19. P Hui, J Crowcroft, E Yoneki, Bubble rap: Social-based forwarding in delay-tolerant networks. IEEE Trans. Mob. Comput.10(11), 1576–1589 (2010) 20. H Zhu, M Dong, S Chang, Y Zhu, M Li, X Shen, Zoom: Scaling the mobility
for fast opportunistic forwarding in vehicular networks. Proc. IEEE INFOCOM.12(11), 2832–2840 (2013)
21. B Liu, K Huang, J Li, MC Zhou, An incremental and distributed inference method for large-scale ontologies based on mapreduce paradigm. IEEE Trans. Cybern.45(1), 53–64 (2015)
22. B Wang, S Huang, J Qiu, Y Liu, G Wang, Parallel online sequential extreme learning machine based on mapreduce. Neurocomputing.149(PA), 224–232 (2015)
24. X Xu, M Tang, A new approach to the cloud-based heterogeneous mapre duce placement problem. IEEE Trans. Serv. Comput.9(6), 862–871 (2016) 25. C Jin, J Chen, H Liu, Mapreduce-based entity matching with multiple
blocking functions. Front. Comput. Sci.11(5), 895–911 (2017) 26. B Feng, X Yang, K Feng, Y Yin, XH Sun, inIEEE International Conference on
CLUSTER Computing. Iosig+: On the role of i/o tracing and analysis for hadoop systems (IEEE, Chicago, 2015), pp. 62–65
27. J Wolf, D Rajan, K Hildrum, R Khandekar, V Kumar, S Parekh, KL Wu, A Balmin,FLEX: A Slot Allocation Scheduling Optimizer for MapReduce Workloads. (Springer, Bangalore, 2010), pp. 1–20
28. A Abouzeid, K Bajda-Pawlikowski, D Abadi, A Silberschatz, A Rasin, Hadoopdb: an architectural hybrid of mapreduce and dbms technologies for analytical workloads. Proc. Vldb Endowment.2(1), 922–933 (2009) 29. C Liu, YJ Liu, ZW Guo, W Jing, Oceanroute: Vessel mobility data