Article
Operational Hydrological Modelling of Small
Watershed using QPE from Dual-Pol Radar in Brazil
Cesar Beneti1,‡, Roberto V. Calheiros1,‡, Mino Sorribas1,‡, Leonardo Calvetti2,‡, Camila Oliveira
1,‡, Nicole Rozin1,‡, and Jorge Ruviaro1,‡*
1 SIMEPAR - Parana Meteorological Service, Curitiba, Brazil; [email protected]
2 UFPEL - Federal University of Pelotas, Pelotas, Brazil, 2; [email protected]
* Correspondence: [email protected]; Tel.: (+55-41-3320-2002; (F.L.) ‡ These authors contributed equally to this work.
1 2 3 4 5 6 7 8 9 10 11 12 13 14 15 16
Abstract: Among other applications, radar-rainfall (RR) and QPE (Quantitative Precipitation Estimation)basedonradarreflectivity,dualpolarizationvariables,andmulti-sensorinformation, provideimportantinformation forlandsurface hydrology,such asfloodf orecasting.Therefore, we developed a flooda lerts ystemu singr ainfall-runoffm odelf orcedw ithR Ra ndQ PE,and tipping-bucketobservationstoforecastriverwaterlevels(usingrating-curves). Inthisstudy,we usedan hourlydatasetfroman S-Banddual-polarimetricradarwithtwotropical R(Z)relations baseddistrometerdata,apolarimetricR(Z,ZDR)algorithmfromtheliteratureandamulti-sensor approachusingradar,satelliteandraingauge.Twohydrologicalmodelswereusedandcalibrated usingobserveddischargetime-series.AlthoughourpreviousstudiesindicatedaccurateRR-based simulations,insomecasesfloodswerenotdetectedwhenusingcatchment-lumpedrainfallderived frommulti-sensorQPE.Inthisstudy,weadvancefurtherinthissubjectusingimprovedR(Z,ZDR) relationsandQPEfortheperiodof2016-2017andfloodevent-basedrainfall-runoffcalibration.Thus, wefocusedonthedevelopment(andtiming)offloodsintheMarrecasRivercanbecomplexand stronglyrelatedtostormsspatiotemporaldistribution.Toexplorethisaspect,wealsoperformafirst analysisinusingRRinrainfall-runoffmodelwithanestedcatchmentdiscretization.
Keywords: WeatherRadar;QuantitativePrecipitationEstimation;RemoteSensing;Hydrological Applications
17
1. Introduction 18
Improved rainfall estimates enhance the potential of radar for many applications such as flood
19
forecasting and management of hydro power generation. In less than 5 years, in Brazil we increased
20
our radar coverage, from 23 single polarization radars to 15 additional dual polarization radars, mainly
21
S-Band, with a concentration in the southern region, an area prone to severe weather, usually related
22
to mesoscale convective systems. This region is responsible for more than 35% of the national hydro
23
power energy generation, directly dependent on precipitation distribution and water availability, and
24
storm events result in disasters related to flood inundation. Polarimetric techniques, which undergo an
25
ever-growing implementation, carry the promise of providing rainfall estimates which are significantly
26
more accurate than those derived from single polarization measurements.
27
A better representation of rainfall spatial distribution and its uncertainties is crucial for accurate
28
forecasts of river discharges and water levels. Radar estimations of QPE (Quantitative Precipitation
29
Estimation) are very useful information for hydrological applications because of high spatial and
30
temporal resolution improving runoff forecasts and reducing model dependence on unreliable
31
parameter estimates of watershed characteristics. However, radar QPE depends on the calibration,
32
Preprints (www.preprints.org) | NOT PEER-REVIEWED | Posted: 4 June 2019 doi:10.20944/preprints201906.0026.v1
Figure 1.(a) Radar and basin location in South America; (b) Marrecas river basin in radar range and Francisco Beltrao city; (c) Marrecas river basin and rain gauges (yellow markers.
good adjustment with rain gauges and distrometers, data filtering, distance from the radar, orography,
33
signal propagation, among other factors. A multi-sensor integration approach of remote sensing
34
precipitation estimation using meteorological satellites and weather radars with rain gauges improves
35
the accuracy of hydrological models when compared to a model using gauge data only.
36
1.1. Study area 37
In this study, we have selected the Marrecas River catchment to evaluate the performance of
38
quantitative precipitation estimates for in rainfall-runoff modeling. The Marrecas River flows in a
39
mostly rural catchment until it enters the city of Francisco Beltrao where it is channelized. Figure1
40
presents the area of the catchment in the region. Near the urbanized area, it also receives a major
41
contribution from the Quatorze River, but there are no water level gauges installed in this tributary.
42
The city of Francisco Beltrao grew up beside the Marrecas River and have suffered with occasional
43
inundations due to its major floods.
44
Over the last 25 years, these floods caused almost 0.5 billion US Dollars in property and crop
45
losses. Between 2013 and 2015, three events were recorded bringing great injuries to local properties.
46
In recent years, river floods resulted in economic damages related to overbank inundation but also
47
due to restrictions in the water supply operation during floods. In fact, a recent rainfall event during
48
early November 2017 resulted in a flooding event with peak flow about 230 m3/s ( 10 years return 49
period) with a rising limb developing in 2 days (Figure2).
50
The watershed area is 335 km2and the fast rainfall-runoff response time, between the rainfall
51
and river flow peaks is between 12 to 24 hours. But, larger floods can have full development up to
52
2 – 5 days. The hydrological network is sparse in the region with rain gauges outside the catchment.
53
Because of such characteristics, an early warning system is vital to prevent even bigger losses.
54
2. Methodology 55
In this study, we evaluate the use of rainfall estimates retrieved from radar, multisensor QPE
56
product [1] and tipping-bucket observations in the simulation of a rainfall-runoff at a 335 km2river
57
catchment. We used a limited dataset from a S-Band dual polarimetric radar with tropical R(Z) relations
58
based on distrometer data and a polarimetric R(Z,ZDR) and R(Z,KDP) algorithm, following Crisologo
59
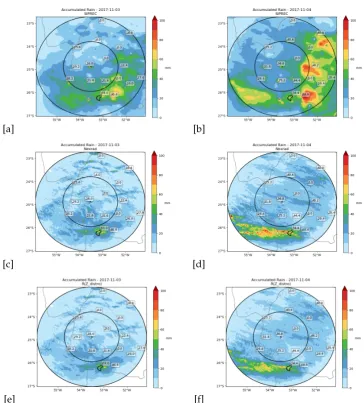
et al.[2]. Figures3and4present sample cases of precipitation estimation with the multisensor QPE
60
product (SIPREC)as well as the polarimetric rainfall estimation obtained from the S-Band and also a
3 of 8
Figure 2.Flooding in Francisco Beltrao city in November, 2017.
distrometric relation for the region of the events. Those accumulations were integrated throughout 2
62
days during the period of study. The rainfall estimation from the polarimetric weather radar will be
63
used to evaluate the impact of radar data in river basin in Brazil.
64
At present, various hydrological models have been developed and widely used in water resources
65
planning and flood forecasting. Each model has its specific conceptual formulation, thus the capability
66
to reproduce aspects of the real world depends on the underlying assumptions, but also in input and
67
output measurements that sets model forcing, boundary and initial conditions. The areal precipitation
68
is the dominant input for rainfall-runoff models and is often estimated from interpolation of rain gauge
69
data, derived from remote sensors and radars.
70
Model performance was assessed for flood events in years 2016 and 2017 (verification and
71
calibration). Hourly data of rainfall and streamflow were used for model calibration using the
72
Multi-objective Complex Evolution (MOCOM-UA, [3]). In the multi-objective approach,parameter
73
optimization was defined towards a trade-off between the KGE ([4]), logNS (Nash-Sutcliffe of
74
log-transformed discharges) and (error in volume). Finally, other statistics such as Nash-Sutcliff
75
(NS), pearson correlation and RMSE were also evaluated. In order to reduce the sensitivity to initial
76
state variables a dry warm-up period was used and not considered in the model calibration.
77
Two hydrologic models were selected for this study including the Sacramento Soil
78
Moisture-Accounting model (SAC-SMA, [5]; [6]) and the Brazilian SMAP (Soil-Moisture Accounting
79
Procedure, ([7]). These are nonlinear, time-continuous and conceptual rainfall-runoff models, requiring
80
inputs of precipitation and potential evapotranspiration (i.e. Penman-Monteith). The SMAP model is
81
based on the USGS SCS TR-55 model accounting for water balance dynamics and uses tank models for
82
catchment/river routing. The hydrologic models were forced with three different rainfall estimates
83
retrieved from radar, tipping-bucket observations and multi-sensor QPE [1]. The SAC-SMA is known
84
to be used operationally for flood forecasting by several weather services including the United States of
85
America. At SIMEPAR, both SAC-SMA and SMAP are operational for flood warning and hydropower
86
operation systems. Nevertheless, the ONS (Operador Nacional do Sistema Eletrico Brasileiro) uses the
87
SMAP model (and adaptations) to support short-range energy planning in many brazilian watersheds.
88
3. Results 89
The rainfall-runoff model performance for SAC-SMA and SMAP for the flood events of nov/2017
90
are summarized in the Table1. Hence, it was possible to reproduce the large floods with both
91
hydrological models and the four different rainfall estimates. The correlations between observed and
92
simulated discharges was high, in most cases larger than 0.75, and RMSE in the range of 15 and 35
93
m3/s is low when compared to flood peaks of 200 m3/s (return period of 5 years). For the SAC-SMA
94
model simulations the KGE values were mostly between 0.50–0.82 with rainfall retrieved from radar;
95
and 0.93 for the raingauge. In general, model performance was satisfactory for the SAC-SMA and best
96
simulations with rain gauge, R(Z,ZDR) and SIPREC. The results for the SMAP model were also in
97
[a] [b]
[c] [d]
[e] [f]
5 of 8
[a] [b]
[c] [d]
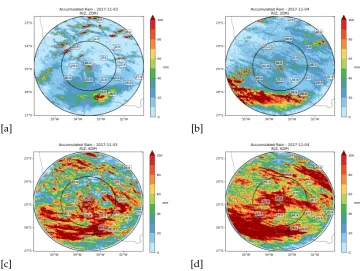
Figure 4.Precipitation estimation in the radar and basin area compared with raingauge daily rainfall accumulation. (a) and (b): Polarimetriz R(Z,ZDR); and c) and (d): Polarimetric R(Z,KDP).
good agreement with KGE between 0.75–0.94, however, KGE, NS and Pearson were in general larger
98
for R(disdro) and SIPREC than for rain gauge.
99
Table 1.Rainfall-runoff model performance for SAC-SMA and SMAP - flood events in nov/2017
Forcing Model KGE ∆V (*1e2%) NS logNS PEARSON RMSE
Raingauge SAC-SMA 0.93 0.01 0.87 0.80 0.93 17.64
SMAP 0.91 0.00 0.82 0.73 0.91 20.50
R(Z.ZDR) SAC-SMA 0.82 0.02 0.66 0.68 0.82 28.68
SMAP 0.75 0.01 0.51 0.66 0.75 34.08
Rdistro SAC-SMASMAP 0.510.94 0.030.00 0.560.89 0.130.83 0.780.94 32.4216.48
SIPREC SAC-SMA 0.71 0.00 0.69 0.29 0.83 27.19
SMAP 0.94 0.00 0.88 0.81 0.94 17.21
Figures5and6show the observed discharges and simulation results from SMAP and SAC-SMA
100
model runs for a sequence of major flood events during oct-nov/2017. For the SAC-SMA model,
101
it is also possible to verify a good agreement in simulations, although in this case R(Z,ZDR) and
102
raingauge were more reliable. The SMAP was able to reproduce the peak of the two major flood events.
103
It was also possible to see that R(disdro) and SIPREC were in better agreements with the smaller
104
floods. The 100 m3/s flood in the beginning of oct/16 clearly illustrates uncertainty related to different
105
combinations of rainfall inputs and models.
106
Figure 5. Simulated discharges for flood events in november 2017 with the SAC-SMA model and different QPE
Figure 6.Simulated discharges for flood events in november 2017 with the SMAP model and different QPE
The rainfall-runoff model performance for SAC-SMA and SMAP for the flood events of oct/2017
107
are summarized in the Table2. Correlations between observed and simulated discharges was high
108
(>0.71) and RMSE in the range of 15–44 m3/s, large in relation to the flood peak of 100 m3/s. For
109
this case, most of the statistics were not satisfactory for this event, as a result from overestimation
110
of discharges. There is general trend in the formation of two convoluted floods in the first days of
111
model runs, associated with rainfall estimates that did not result in real increase of the water level.
112
However, SAC-SMA performed well for rain gauge and R(Z,ZDR) with KGE(NS) of 0.77(0.81). The
113
SMAP model also showed a good agreement for R(Z,ZDR) with KGE(NS) value of 0.68(0.53). Figures
114
7and8illustrates results for model runs for the oct/2016 flood events.
115
Table 2.Rainfall-runoff model performance for SAC-SMA and SMAP - flood event in oct/2016
Forcing Model KGE ∆V (*1e2%) NS logNS PEARSON RMSE
Raingauge SAC-SMA 0.77 0.11 0.59 0.75 0.81 11.97
SMAP -0.43 0.92 -1.49 0.44 0.93 21.69
R(Z,ZDR) SAC-SMA 0.77 0.02 0.81 0.39 0.91 5.99
SMAP 0.68 0.18 0.53 0.38 0.84 9.43
Rdisdro SAC-SMA -1.47 2.15 -7.06 -2.32 0.71 38.99
SMAP -0.20 0.90 -0.94 0.00 0.90 19.11
SIPREC SAC-SMA -1.92 2.19 -9.07 -1.78 0.87 43.61
7 of 8
Figure 7.Simulated discharges for flood events in october 2016 with the SAC-SMA model and different QPE
Figure 8.Simulated discharges for flood events in october 2016 with the SMAP model and different QPE
The hydrological processes in the SMAP conceptual model is less complex than the SAC-SMA
116
and can explain, at least partially, the inter-model capabilities. The SMAP model tends to reproduce
117
hydrogragh flashiness in smaller catchments, but it is also more sensititive to initial conditions. Since
118
the Marrecas River has peak flows much larger than the mean discharge (10 m3/s), the multi-objective
119
optimization provided a good balance for both high and low flows forecasts, reproducing the
120
hydrograph variability.
121
Both SAC-SMA and SMAP simulated river discharges in a realistic manner, but with no clear
122
better estimation in radar-derived rainfall. Even if R(Z,ZDR) showed good agreement in both periods
123
of flood events (oct/2016 and nov/2017), a more conservative approach for flood forecast and alert
124
in the Marrecas River should consider an ensemble of these models. The successful use of rainfall
125
retrieved from radar for rainfall-runoff modeling stresses its potential use in providing reliable rainfall
126
and flood estimates in less-well monitored areas within its range, such as the Quatorze river.
127
4. Conclusion 128
In this study we evaluated rainfall-runoff models forced with radar rainfall inputs for river
129
flood prediction. In general, simulations with SAC-SMA and SMAP indicate that tipping-bucket
130
and radar-derived rainfall were both capable to provide reliable to flood prediction in the Marrecas
131
river. The rainfall derived from R(Z,ZDR) provided reliable simulations for the major flood events in
132
oct/2016 and nov/2017. The prediction of catchment runoff in ungauged catchments in the region
-133
such as the Quatorze River - is most likely to benefit from the radar information. Finally, besides the
134
(e.g., materials used for experiments). 144
Conflicts of Interest:The authors declare no conflict of interest. The funders had no role in the design of the 145
study; in the collection, analyses, or interpretation of data; in the writing of the manuscript, or in the decision to 146
publish the results. 147
Abbreviations 148
The following abbreviations are used in this manuscript: 149
150
DOAJ Directory of open access journals 151
References 152
1. Calvetti, L.; Beneti, C.; Neundorf, R.L.A.; Inouye, R.T.; dos Santos, T.N.; Gomes, A.M.; Herdies, D.L.; 153
de Goncalves, L.G.G. Quantitative Precipitation Estimation Integrated by Poisson’s Equation Using 154
Radar Mosaic, Satellite, and Rain Gauge Network. Journal of Hydrologic Engineering2017,22, E5016003. 155
doi:10.1061/(ASCE)HE.1943-5584.0001432. 156
2. Crisologo, I.; Vulpiani, G.; Abon, C.C.; David, C.P.C.; Bronstert, A.; Heistermann, M. Polarimetric rainfall 157
retrieval from a C-Band weather radar in a tropical environment (The Philippines). Asia-Pacific Journal of
158
Atmospheric Sciences2014,50, 595–607. doi:10.1007/s13143-014-0049-y. 159
3. Yapo, P.O.; Gupta, H.V.; Sorooshian, S. Multi-objective global optimization for hydrologic models. Journal
160
of Hydrology1998,204, 83 – 97. doi:https://doi.org/10.1016/S0022-1694(97)00107-8. 161
4. Gupta, H.V.; Kling, H.; Yilmaz, K.K.; Martinez, G.F. Decomposition of the mean squared error and NSE 162
performance criteria: Implications for improving hydrological modelling.Journal of Hydrology2009,377, 80 163
– 91. doi:https://doi.org/10.1016/j.jhydrol.2009.08.003. 164
5. Burnash, R.J.C., F.R.; McGuire, R. A Generalized Streamflow Simulation System Conceptual Modeling for 165
Digital Computers. Technical report, Joint Federal-State River Forecast Center, Sacramento, CA, 1973. 166
6. Duan, Q.; Sorooshian, S.; Gupta, V. Effective and Efficient Global Optimization for Conceptual 167
Rainfall-Runoff Models. Water Resources Research1992,28, 1015–1031. 168
7. Lopes J.E.G, Braga B.P.F, C.J. SMAP - A Simplified Hydrological Model. Applied Modelling in Catchment 169