Jurnal Teknologi, 46(C) Jun 2007: 59–74 © Universiti Teknologi Malaysia
SOLID PHASE MICROEXTRACTION-GAS CHROMATOGRAPHY FOR THE ANALYSIS OF EXPLOSIVES IN POST BLAST WATER
SAMPLES
UMI KALTHOM AHMAD1* & KIU KEE HENG2
Abstract. In this study, a solid-phase microextraction (SPME) technique followed by gas chromatography (GC) was used to determine explosive residues. Several parameters including adsorption time, desorption time and temperature, SPME fiber types, stirring effect and salting out effect were optimized to obtain reproducible data with good accuracy. Addition of 10% w/v of NaCl in the aqueous medium and the use of a Carboxen/Polydimethylsiloxane (CAR/PDMS) fiber coating led to optimal extraction efficiencies. The optimized SPME/GC-ECD method was applied to the trace analysis of explosive residues in water samples. 2,6-dinitrotoluene (2,6-DNT), trinitrotoluene (TNT) and pentaerythritol tetranitrate (PETN) were successfully detected from water samples. Direct Immersion SPME/GC-ECD was found to be an attractive technique for qualitative and quantitative analysis of explosives in post blast water samples.
Keywords: Explosives, direct immersion SPME, GC-ECD, post blast water samples
Abstrak. Dalam kajian ini, teknik pengekstrakan mikro fasa pepejal (SPME) diikuti dengan kromatografi gas (GC) telah digunakan untuk menentukan sisa letupan. Beberapa parameter termasuk masa penjerapan, masa dan suhu nyahjerapan, jenis gentian SPME, kesan pengadukan dan kesan garam telah dioptimumkan untuk mendapat data yang tepat. Penambahan 10% w/v NaCl dalam medium akues dan penggunaan gentian Carboxen/Polidimetilsiloksana (CAR/PDMS) menghasilkan pengekstrakan yang paling cekap. SPME/GC-ECD yang telah dioptimumkan digunakan untuk menganalisis sisa letupan 2,6-dinitrotoluena (2,6-DNT), trinitrotoluena (TNT) dan pentaeritritol tetranitrat (PETN) berjaya dikesan daripada sampel air. SPME/GC-ECD secara rendaman langsung didapati kaedah yang menarik digunakan untuk menganalisis bahan letupan dalam sampel air pasca letupan secara kualitatif dan kuantitatif.
Kata kunci: Bahan letupan, SPME rendaman langsung, GC-ECD, sampel air pasca letupan
1.0 INTRODUCTION
The forensic identification of bulk explosive and post explosion residues is important in bombing investigation. The information can be used to determine the type of explosive, to link the suspect to the explosive and ultimately to provide evidence in court [1]. The bombings that occurred in Bali on the 12th October 2002 were the most
1&2 Department of Chemistry, Faculty of Science, Universiti Teknologi Malaysia. 81310 UTM Skudai,
Johor Darul Ta’zim.
callous act of terrorism in Indonesian history. Two hundred and two people were killed and many hundreds more were injured. Indonesian police investigated the devastating bombing of a night club have found traces of plastic explosive at the site of the attack. After investigation by police together with expert from the FBI, they concluded that C4 explosive was used - a type manufactured mainly in the United States and used widely by military forces around the world [2].
An explosive can be liquid, gaseous or solid. A chemical explosive is a compound of mixture or alone which upon initiation undergoes a rapid chemical reaction without participation of external reactants such as atmospheric oxygen, resulting in large amount of gaseous pressure [3]. Explosives are either made of pure compounds or mixture of compounds. Basically, explosives which are pure compounds can also be divided to two categories that are organic and inorganic explosives [4]. Explosives can also be classified by their applications: high-order explosives, low-order explosives (propellants) and pyrotechnics, which are primarily differentiated by the burning rate and the manner of initiation.
Some extraction techniques for explosive residues have been studied included Soxhlet extraction, ultrasonic, centrifugation, swabbing and solid-phase microextraction (SPME) [5-9]. Many separation approaches for explosives have been suggested and published. The methods and techniques reported may be classified as chromatographic methods such as gas chromatography (GC), high performance liquid chromatography (HPLC), ion chromatography (IC) or supercritical fluid chromatography (SFC) and mass spectrometric methods such as gas chromatography-mass spectrometry (GC-MS) or liquid chromatography-chromatography-mass spectrometry (LC-MS) [10].
afforded by the technique [9]. SPME has been used for the extraction of explosives and showed promising results in previous studies [9, 14-19].
This study was aimed at developing a direct immersion (DI)-SPME method for the detection of nitro explosives. The extraction conditions of DI-SPME for explosives analysis was optimized and the developed technique applied to the analysis of simulated post blast water samples.
2.0 EXPERIMENTAL
2.1 Apparatus
A Supelco SPME fiber manual holder and three different fibers types were used in this study. The SPME fibers were a 7 µm film thickness polydimethylsiloxane (PDMS), a 75 µm film thickness partially crosslinked Carboxen/polydimethylsiloxane (CAR/ PDMS) and a 4 µm film thickness lab-made FICONSICA (octyltriethoxysilane (C8 -TEOS): methyltrimethoxysilane (MTMOS)) fiber. The PDMS and CAR/PDMS fibers were commercially obtained from Supelco (Bellefonte, USA). GC analysis was performed using a Perkin Elmer Autosystem XL Gas Chromatograph equipped with an electron capture detector (ECD) and data processing using Turbochrom Navigator Version 4.1 software.
Temperature programming involved initial oven temperature at 100°C, held for 2 min then ramped to 250°C at 15°C/min and then held for 1 min at 250°C. Injector temperature was set at 230°C while detector temperature was at 250°C. GC column comprised of an HP-5 MS column (30 m × 0.25 mm I.D. × 0.25 µm film thickness) from Hewlett Packard, USA. Carrier gas was helium (MOX, Pasir Gudang) at a flow rate of 1 mL/min and nitrogen as the make up gas for ECD at 30 mL/min. The GC conditions were developed in the laboratory and initially adapted from Walsh[6].
2.2 Chemicals
2.3 Sampling of Post Blast Water Samples
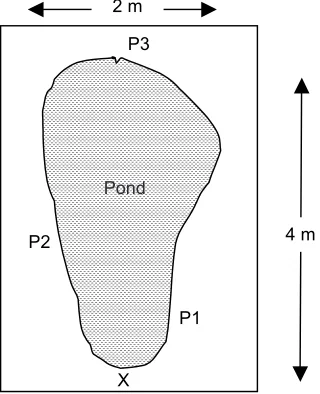
Sampling of post blast water samples was carried out at Maktab Teknik PDRM Bakri, Muar on 29th March 2006. It was a collaborative effort between UTM Forensic Research Team and Forensic officers of the Royal Malaysia Police in Cheras (PDRM). The impact area where the detonation took place was an open space grass field. The field was known to be free from all types of explosive residues. It was sunny and rather windy on the day of sampling. The locations of sampling points are as given in Figure 2. The sampling points were at least 10 m apart from each other so that cross contamination due to each explosion would not occur.
Explosives were hung from a wooden pole with a string (approximately 1 m from the ground) at locations A, B and C while at sampling point D, explosives were embedded at one edge of the pond. Plastic trays that were filled with 1 L of tap water were hooked to the ground using stainless steel hook. The trays were placed according to the position of labelled metal pegs placed at specified distances from the wooden pole (at sampling points A-C). These trays were hooked to avoid them being blown off during the blast. The post blast water samples from the plastic trays were transferred
Figure 1 Chemical structures of (a) TNT (b) 2,4-DNT (c) 2,6-DNT and (d) PETN H3C NO2
NO2
O2N
H3C
NO2
O2N
H3C NO2
O2N
H2 C
C C H2
C H2 H2 C O
O2N
O NO2 O
O2N
O NO2
(a) (b) (c) (d)
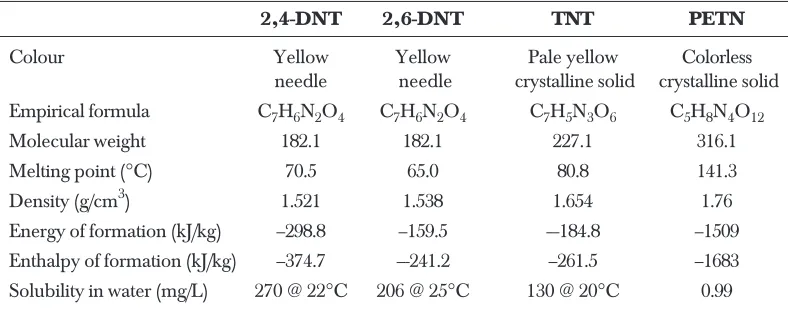
Table 1 Properties of some explosives [3]
2,4-DNT 2,6-DNT TNT PETN
Colour Yellow Yellow Pale yellow Colorless
needle needle crystalline solid crystalline solid
Empirical formula C7H6N2O4 C7H6N2O4 C7H5N3O6 C5H8N4O12
Molecular weight 182.1 182.1 227.1 316.1
Melting point (°C) 70.5 65.0 80.8 141.3
Density (g/cm3) 1.521 1.538 1.654 1.76
Energy of formation (kJ/kg) –298.8 –159.5 –-184.8 –1509
Enthalpy of formation (kJ/kg) –374.7 –-241.2 –261.5 –1683
into sample bottles using a plastic funnel. The sample bottles were labelled accordingly. Separate funnels were used for each sampling point to avoid any contamination. Besides water samples from the plastic trays that were collected at sampling point D, post blast water samples from the pond were collected directly by dipping the sample bottles
Figure 2 Position of sampling points A-D at impact area
⊗
Figure 3 Location of water collection at sampling point D. X: Explosion Point; P1, P2 and P3: Water Sample Collecting Points
Pond
into the pond from three edge positions (P1, P2 and P3) as shown in Figure 3. All water samples were placed in a cooler box immediately after collection and stored in the refrigerator at 4°C in the lab prior to analyses.
2.4 Direct Immersion SPME Optimizations
A series of experiments were conducted in terms of SPME fiber types, desorption time and temperature, salting out and stirring effect with the step mention above. For salting out effect experiment, the fiber was carefully rinsed before placement into the injection port. This was to avoid accumulation of the salt in the syringe needle or in the glass liner of the GC injection port. Table 2 shows the parameters optimized in this study.
2.5 Analysis of Post Blast Water Samples
Prior to solid-phase microextraction (SPME), the water samples were gravity filtered through a Whatman no. 2 filter paper to separate the soil and other unwanted solids. Water samples were then extracted by immersing a specified SPME fiber in the aqueous solution (10 mL) contained in a vial at room temperature. The water samples were extracted in triplicate using the optimized direct immersion solid-phase microextraction (DI-SPME) conditions.
3.0 RESULTS AND DISCUSSION
3.1 SPME Sampling Mode
The choice of SPME sampling mode (direct immersion or headspace) is quite critical. From the study of Psillakis et al. [20], the headspace sampling works relatively well for analytes of lower molecular weight such as nitrobenzene (NB) and nitrotoluene (NTs). However, extraction of the larger molecules (DNB and DNTs) was not very efficient or even not possible for some explosives such as trinitrotoluene (TNT), trinitrobenzene (TNB) and amino-dinitrotoluene (ADNTs). From previous studies [9, 13, 17-19], direct
Table 2 Optimization of DI-SPME parameters
Parameters Conditions / Range
Extraction time (min) 5, 10, 5, 20, 25, 30, 40
Desorption time (min) 1, 3, 5, 7
Desorption temperature (°C) 200, 210, 220, 230, 240
Salting out effect (% w/v) 0, 5, 10, 15, 20
Stirring effect With stirring (100 rpm) and
immersion sampling mode was used for the extraction of explosives. Hence, in this study, direct immersion solid phase microextraction (DI-SPME) was chosen for the extraction of explosive residues in water samples.
3.2 DI-SPME Optimization
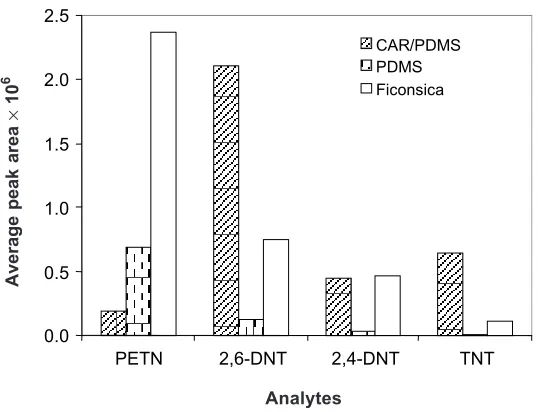
From the results obtained as shown in Figure 4, CAR/PDMS fiber gave an optimum peak area for 2,6-DNT and TNT while the FICONSICA fiber was highly efficient for extracting PETN. The stationary phase of CAR/PDMS fiber (75 µm) is a porous material (micro-, meso- and macro-pores from 6 to 50 Å) resulting from a mixture of PDMS and CAR fibers (Supelco Manual). The mixture of PDMS and CAR (the porous activated carbon support) increase retention capacity due to the mutual effect of adsorption to and distribution within the stationary phase [21]. A relation between the molecular weight of the compounds and the extraction efficiency of CAR/PDMS was observed. In the case of CAR/PDMS, adsorption on the particles’ surfaces dominates the extraction process whereas in the case of PDMS, absorption partitioning in the bulk of the phase is dominant [22]. Smaller compounds can be retained into the pore of polymeric phase and bigger compounds might diffuse better into the pure phase [22]. Therefore, CAR/PDMS was chosen in the extraction of target compounds in subsequent study.
Figure 4 Comparison of extraction efficiency using different SPME fibers; (a) CAR/PDMS, (b) PDMS and (c) FICONSICA in extracting individual analytes. DI-SPME conditions:
Extraction time 30 min at room temperature, desorption time 5 min at GC injection
port (230°C)
! !" ! !" ! !"
# $%& $&
*+ ,-.
Average peak area
×
10
6
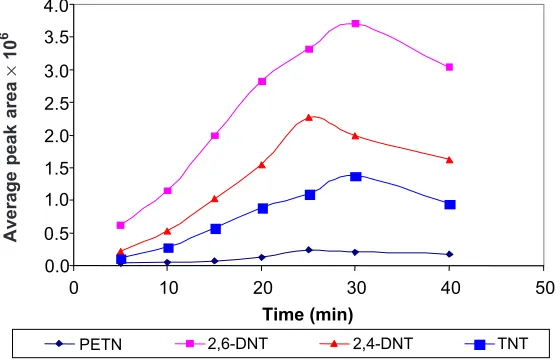
The influence of extraction time on the GC responses obtained for the four explosive compounds are shown in Figure 5. The extraction time of 25 min gave optimum peak area for PETN and 2,4-DNT while 2,6-DNT and TNT showed the optimum peak area at 30 min. Equilibration was attained after around 30 min for almost all the analytes investigated. An adsorption time of 30 min was therefore used for later experiments.
Average peak area
×
10
6
Figure 5 Extraction time profile for PETN, 2,-4-DNT, 2,6-DNT and TNT by SPME/GC-ECD using CAR/PDMS fiber at room temperature, desorption time 5 min at GC injection port
(230°C)
! !" ! !" ! !" ! !" !
"
# $%& $&
The results (Figure 6) indicated that desorption time from CAR/PDMS was quite fast (3 min for all analytes). For all analytes, peak areas increased between 1 to 3 min of desorption time and decreased thereafter. A desorption time of 3 min was then used for all other SPME/GC-ECD experiments.
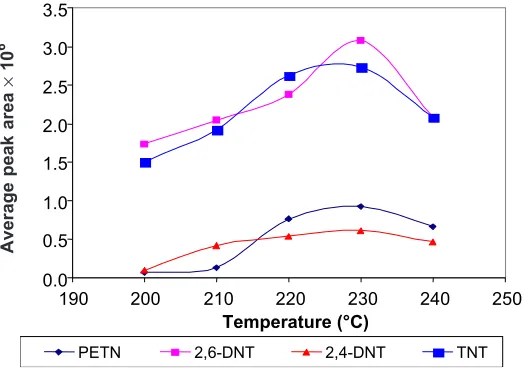
When using SPME/GC, desorption temperature can affect drastically the recovery of the analyte from the fiber. Temperature should be high enough to allow fast and quantitative desorption without decomposing the thermolabile chemicals [18]. The influence of desorption temperature on desorption efficiency is shown in Figure 7. The chromatographic response for all target compounds increased with temperature until 230°C.
areas of analytes increased with addition of salt up to 10% since the ionic strength clearly affects the extraction of analytes. However, at higher percentages of NaCl, peak areas were found to decrease slightly. This could be due to the salt solution that became too saturated for the salting out of analyte to be effective.
Stirring is another parameter which may affect the kinetics of the SPME since it hastens the transfer of the analytes to the fiber. The effect of stirring on the yield of Figure 6 Desorption time profile for PETN, 2,-4-DNT, 2,6-DNT and TNT by SPME/GC-ECD
using CAR/PDMS fiber at room temperature for 30 min extraction time,
desorption time 5 min at GC injection port (230°C)
! !" ! !" ! !" ! !" !
% /
# $%& $&
Figure 7 Effect of desorption temperature on the analysis of explosives by SPME/GC-ECD. CAR/PDMS fiber was immersed for 30 min in the solution at room temperature and
desorption time was 3 min in the GC injector port (230°C)
Time (min)
! !" ! !" ! !" ! !"
0 "
# $%& $&
Average peak area
×
10
6
Average peak area
×
10
Figure 8 Influence of varying percentage of NaCl on DI-SPME extraction performed at room temperature, 40 min extraction time and 3 min desorption time. GC desorption
temperature was at 230°C
! ! ! ! !" !% !1 !/
# $%& $&
"2 2 "2 2
Figure 9 Influence of stirring effect (stirred at 100 rpm) on the SPME extract of explosive mixtures. CAR/PDMS fiber was immersed for 30 min in the solution at room
temperature and desorption time was 3 min in the GC injector port (230°C)
! !" ! !" ! !" ! !" !
# $%& $&
-
Average peak area
×
10
6
Average peak area
×
10
SPME was reported to be compound independent [23]. Comparison of GC responses between the analytes of these two conditions is shown in Figure 9. All peak areas were increased when the sample was stirred at 100 rpm as compared to the extraction of analytes without stirring. This effect could be clearly seen especially for the higher molecular weight compounds such as PETN and TNT, which probably have the lower diffusion coefficients in the water sample.
3.3 Application to Post Blast Water Samples
The developed method was applied to the analysis of several post-blast water samples. Two types of water samples were used in this study. One was the water sample taken directly from the pond after the explosion. The other sample was the water in the collection tray containing soil that had fallen into the tray during the explosion.
From the pond water samples, the chromatograms (Figure 10) only showed the presence of 2,6-DNT and some unknown peaks. The unknown peaks could be due to other explosives, which were not used in this study or other non-explosive materials. From Figure 10a, several peaks were present in the blank pond water. Therefore, some of the unknown peaks in the chromatograms arose from the pond water, and not by the explosion.
The concentration of the 2,6-DNT in the pond water samples are shown in Table 3. Although all the samples were collected from the same pond, the results for each point were different. A probable reason could be the static condition of the water in the pond. After the explosion, the water in the pond would not be homogenous in a short time. The concentration of explosives at a point nearest to the explosion point (P1) was higher than the other points.
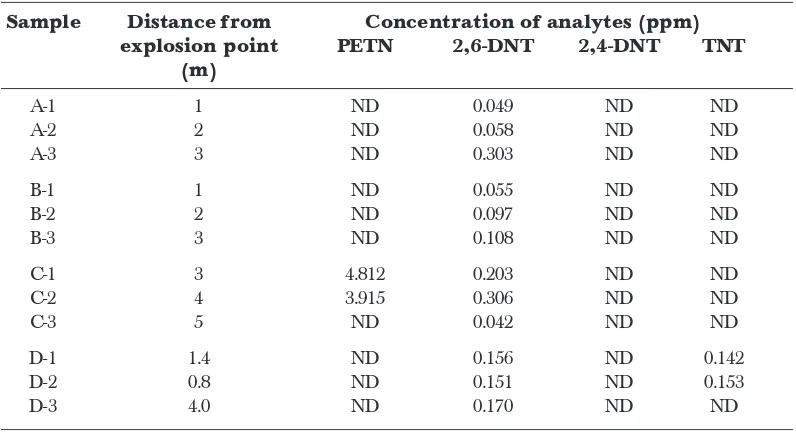
Another type of water samples were those from the collection trays which were set on the ground near every explosion points (A, B, C and D). All samples showed the presence of 2,6-DNT at concentrations that varied between the different distances of explosion points (Table 4). However, sample C showed the presence of another explosive, PETN while sample D showed the presence of TNT. These samples were almost similar as the samples that were collected in the pond water. From the results, the distance of the point of explosion to the sample collection tray did not show specific relationship with the concentration of the explosives. The reason could be due to the explosive debris as well as the contaminated soil may not have fallen into the tray which was nearest to the explosion point. During explosion, the soil containing explosive residues would randomly spread from the explosion point. Therefore, the trays were set at different distances from the explosion point in order to ensure the explosive residues could be efficiently collected.
Table 3 Concentration of 2,6 DNT in pond water samples (location D) using GC-ECD
Sample 2,6-DNT (ppm)± SD*
D-P1 0.079 ± 0.003
D-P2 0.047 ± 0.005
D-P3 0.065 ±0.002
Time (minutes)
Figure 10 GC-ECD chromatograms of the extracts of (a) blank pond water; samples at point D; (b) D-P1; (c) D-P2; (d) D-P3 and (e) a standard solution of 0.5 ppm explosives mixture (a)
(b) (e)
(d)
(c)
2
2,6-DNT 2,6-DNT 2,6-DNT PETN
TNT
2,4-DNT 2,6-DNT
The average concentration at sampling point C for 2,6-DNT was 0.184 ppm and for PETN was 2.91 ppm. The concentration of 2,6-DNT for the third tray was very low and PETN was not detected. For this tray, the concentration of 2,6-DNT was 0.0042 ppm and for PETN, it was not detected. The reason for this phenomenon might be due to the quantity of either contaminated soil or explosive debris in this tray being too little. Since this explosive was hanged during explosion, the direction of wind could also play an important role in the collection of the post blast samples. There could be a change in direction of the wind during the sampling that might blow the soil or debris to other places.
For sampling point D, concentrations of 2,6-DNT for these three different distance of tray were not much different. The average of the concentration was 0.159 ppm. TNT was also detected in this point with an average concentration of 0.109 ppm. Some of the unknown peaks which appeared in these chromatograms could be due to the conversion of TNT to other degradation products. From the study of Stucki [24], all organic explosives and their residues showed degradation in water and soil, influenced by microorganisms, light, oxygen and reducing chemicals. From the previous study regarding the degradation of TNT, TNT could be degraded to amino toluene. From the time of sampling (29 March 2006) until samples were analyzed (June 2006), there was a duration of 3 months. The samples could have undergone appreciable degradation. This could probably be the reason for the appearance of some unknown peaks in the chromatograms. The unknown peaks could also be caused
Table 4 Concentration of explosives in water samples from collection trays by using
SPME-GC-ECD (n=3)
Sample Distance from Concentration of analytes (ppm) explosion point PETN 2,6-DNT 2,4-DNT TNT
(m)
A-1 1 ND 0.049 ND ND
A-2 2 ND 0.058 ND ND
A-3 3 ND 0.303 ND ND
B-1 1 ND 0.055 ND ND
B-2 2 ND 0.097 ND ND
B-3 3 ND 0.108 ND ND
C-1 3 4.812 0.203 ND ND
C-2 4 3.915 0.306 ND ND
C-3 5 ND 0.042 ND ND
D-1 1.4 ND 0.156 ND 0.142
D-2 0.8 ND 0.151 ND 0.153
D-3 4.0 ND 0.170 ND ND
by other non-explosive substances. Confirmation of the unknown peaks however warrants further study.
3.4 Comparison between Post Blast Water Sample from Collection Tray and Field Pond
Both the pond water (D-P1, P2 and P3) and the water samples from collection trays (D-1, 2 and 3) were collected from the same detonation point. Therefore, the explosive residues from these two types of samples should be of the same identity. However, a difference of concentration of analytes between these two samples was noted. Table 5 shows the concentration of 2,6-DNT and TNT in these two samples.
Table 5 Average concentration of 2,6-DNT and TNT in water samples from collection tray and real pond
Average concentration of explosive (ppm) in water
sample from
Explosive Collection tray Field pond
2,6-DNT 0.159 0.064
TNT 0.109 ND
ND: Not detected
A possible explanation could be the volume of water in the collection tray (1 L) being less than the volume of water in the real pond (around 4 m long, 2 m wide and 1.5 m deep). The ratio of water to post blast residues was higher in the water sample from collection tray. There was a very big difference for the comparison ratio of water to soil amongst these two samples. Besides, the pond water might also contain other substances such as microorganisms that could influence the concentration of explosive after a period of time.
4.0 CONCLUSIONS
DI-SPME/GC-ECD method was applied to several post blast water samples. No correlation was found between amount of explosive residues and distance from point of explosion. External factors such as direction of wind blow and amount of initial explosive weight used might influence the quantity of explosive residues detected. It can thus be concluded that DI-SPME/GC-ECD is a viable and attractive technique for the analysis of explosives in post blast water samples.
ACKNOWLEDGEMENTS
Special thanks are due to the officers of the PDRM forensic laboratory in Cheras, Selangor and Maktab Teknik PDRM, Muar for assistance in the sampling and collection of post blast water samples. Research facilities provided by the Department of Chemistry, Faculty of Science, UTM are greatly appreciated.
REFERENCES
[1] Grob, R. L. and E. F. Barry, 2004. Modern Practice of Gas Chromatography. 4th. ed. Hoboken, New Jersey: John Wiley & Sons, Inc.
[2] BBC News World Edition. Plastic Explosive Clue in Bali Bombing. 2002. http://www.news.bbc.co.uk/2/hi/ asia-pacific/default.stm. (accessed on 21/5/2006)
[3] Köhler, J. and R. Meyer. 1993. Explosives. 4th, rev. and extended ed. Weinheim: VCH. [4] Cooper, P. W. 1996. Explosives Engineering. United States of America: Wiley-VCH, Inc.
[5] Deuster, R., N. Lubahn, C. Friedrich, and W. Kleibrhmer. 1997. Supercritical CO2 assisted Liquid Extraction of Nitroaromatic and Polycyclic Aromatic Compounds in Soil. J. Chromatogr. A. 785: 227-238.
[6] Walsh, M. E. 2001. Determination of Nitroaromatic, Nitramine and Nitrate Ester Explosives in Soil by Gas Chromatography and an Electron Capture Detector. Talanta. 54: 427-438.
[7] Hilmi, A., L. H. T. John, and A. L. Nguyen. 1999. Determination of Explosives in Soil and Ground Water by Liquid Chromatography - Amperometric Detection. J. Chromatogr. A. 844: 97-110.
[8] Samuels, J. E., D. G. Boyd, and R. M. Rau. 2000. A Guide for Explosion and Bombing Scene Investigation. Washington: National Institute of Justice.
[9] Furton, K. G., J. R. Almirall , J. Wang, and L.Wu. 2000. Application of Solid-phase Microextraction to the Recovery of Explosives and Ignitable Liquid Residues from Forensic Specimens. J. Chromatogr. A. 885: 419-432.
[10] Yinon, J. and S. Zitrin, 1993. Modern Methods and Applications in Analysis of Explosives. West Sussex, England: John Wiley & Sons.
[11] Snow, N. H. 2000. Solid-phase Micro-extraction of Drug from Biological Matrices. J. Chromatogr. A. 885: 445-455.
[12] Leong L. W. 2005. Forensic Analysis of Alcohol in Urine Samples Employing Headspace Solid Phase Micro Extraction-Gas Chromatography Technique. MSc. Dissertation. Universiti Teknologi Malaysia.
[13] Calderara, S., G. Gardebas, and F. Martinez, 2003. Solid-phase Microextraction Coupled with on-column GC/ ECD for the Post-blast Analysis of Organic Explosives. Forensic Sci. Int. 137: 6-12.
[14] Horng J. Y. and S. D. Huang. 1994. Determination of the Semi-volatile Compounds Nitrobenzene, Isophorone, 2,4-dinitrotoluene and 2,6-dinitrotoluene in Water Using Solid-phase Microextraction with a Polydimethylsiloxane-coated Fiber. J. Chromatogr. A. 678(2): 313-318.
[15] Kirkbride, K. P., G. Klass, and P. E. Pigpi. 1998. Application of Solid-phase Microextraction to the Recovery of Organic Explosives. J. Forensic Sci. 43: 76-81.
[17] Monteil-Rivera, F., C. Beaulieu, S. Deschamps, L. Paquet, and J. Hawari. 2004. Determination of Explosives in Environmental Water Samples by Solid-phase Microextraction-Liquid Chromatography. J. Chromatogr. A.
1048: 213-221.
[18] Monteil-Rivera, F. and J. Hawari. 2005. Use of Solid-phase Microextraction/Gas Chromatography-Electron Capture Detection for the Determination of Energetic Chemicals in Marine Samples. J. Chromatogr. A. 1066: 177-187.
[19] Psillakis, E. and N. Kalogerakis. 2001. Solid-phase Microextraction versus Single-drop Microextraction for the Analysis of Nitroaromatic Explosives in Water Samples. J. Chromatogr. A. 938: 113-120.
[20] Psillakis, E., G. Naxakis, and N. Kalogerakis. 2000. Detection of TNT-Contamination in Spiked-soil Samples using SPME and GC/MS. Global Nest: The Int. J. 2(3): 227-236.
[21] Pinho, O., I. M. P. L. V. O. Ferreira, and L. H. M. L. M. Santos. 2006. Method Optimization by Solid-phase Microextraction in Combination with Gas Chromatography with Mass Spectrometry for Analysis of Beer Volatile Fraction. J. Chromatogr. A. 1121(2): 145-153.
[22] Polo, M., M. Llompart, C. Garcia-Jares, G. Gomez-Noya, M. H. Bollain, and R. Cela. 2006. Development of a Solid-phase Microextraction Method for the Analysis of Phenolic Flame Retardants in Water Samples.
J. Chromatogr. A. 1124(1-2): 11-21.
[23] Canosa, P., I. Rodríguez, E. Rubí, M. H. Bollaín, and R. Cela. 2006. Optimisation of a Solid-phase Microextraction Method for the Determination of Parabens in Water Samples at the Low ng per Litre Level.
J. Chromatogr. A. 1124(1-2): 3-10.