ABSTRACT
GUERDAT, TODD CAMERON. A Comprehensive Analysis of Marine Recirculating Aquaculture Effluent Treatment. (Under the direction of Dr. Thomas M. Losordo.)
The development of marine aquaculture is limited by the cost of coastal land and the inherent limitations in the management of saltwater effluent. Greater oversight of nutrient discharge has brought about the need to develop ecologically-sound wastewater treatment systems for marine aquaculture. To promote further development of marine aquaculture, a renewed focus on the capture and storage and a reduction in the cost of treatment of the saline wastewater is required such that facilities may be located further inland.
The Marine Aquaculture Research Center (MARC) was developed for the purpose of promoting marine recirculating aquaculture research and is operated by the Department of Biological and Agricultural Engineering at North Carolina State University. The MARC utilizes recirculating aquaculture systems (RAS) for all ongoing marine aquaculture research inside the facility. All effluent from the ongoing RAS operations is treated in a multi-stage wastewater treatment facility prior to discharge or reuse of the treated effluent. The wastewater treatment system consists of a primary solids removal stage and a dissolved nutrient treatment stage. The primary solids removal stage employs a geotextile bag system using a flocculant-aid to improve solids removal from the waste stream. The dissolved nutrient treatment stage consists of two separate biological treatment systems: a
Geotextile bag systems using flocculant-aids offer a low cost, low energy, highly efficient means for capturing and dewatering waste solids from a RAS effluent. Two separate geotextile bag systems were evaluated using either freshwater or marine RAS effluents. The results were compiled to provide consistency and determine any potential differences between marine and freshwater systems. Results from the two separate geotextile bag systems were similar and showed excellent nitrogen, chemical oxygen demand (COD), total suspended solids (TSS), and phosphorus removal. The resulting filtrate was high in total Kjeldahl nitrogen (TKN) and soluble reactive phosphorus (SRP).
The conventional biological filtration system is a two-stage reactor system operated in series employing an anoxic fixed bed bioreactor (FBBR) and an aerobic mixed bed bioreactor (MBBR), operated in triplicate. The treatment system effectively converted and removed nitrogen at a suitable rate to support the ongoing operations inside the facility. The study provided both realistic TN removal rates as well as operational COD:TN ranges for maximizing the efficiency and performance of the FBBRs.
The second dissolved nutrient treatment system was a two-stage constructed
treatment wetland system employing a combination of subsurface vertical flow (VF) and free water surface (FWS) flow wetland cells, each operated in triplicate. Variation of treatment performance was observed due to seasonal effects. The constructed treatment wetland system successfully treated the wastewater prior to discharge. A portion of the treated effluent was successfully reused in a 1.5 m3 marine RAS growing Hybrid Striped Bass (Morone saxatillis).
manuscript details the work using the geotextile bag systems for the purpose of solids removal and dewatering for RAS. The second manuscript details the denitrification and nitrification processes utilized in the two-stage biological reactor system and the limitation excess organic carbon may impose on the removal of TN. The third manuscript is an evaluation of a constructed treatment wetland system treating the effluent from a marine RAS facility. Each of the studies described in this dissertation provide a unique
A Comprehensive Analysis of Marine Recirculating Aquaculture Effluent Treatment
by
Todd Cameron Guerdat
A dissertation submitted to the Graduate Faculty of North Carolina State University
in partial fulfillment of the requirements for the degree of
Doctor of Philosophy
Biological and Agricultural Engineering
Raleigh, North Carolina 2012
APPROVED BY:
_______________________________ ______________________________
Dr. Thomas M. Losordo Dr. Francis de los Reyes
Committee Chair Minor Chair
________________________________ ________________________________
DEDICATION
To my families. I have many.
To my wife, Kate, and daughter, Cadence - I owe my very existence to you both. Without the two of you, this would never have happened.
To my parents and sister I owe a lifetime of gratitude and appreciation for your patience, understanding, and loving support throughout my (many) years obtaining my degrees. The time spent will be well worth the rewards.
To my family of friends – thank you. Without your love and encouragement and mudslides I never would have made it through.
BIOGRAPHY
Todd Guerdat grew up in Rochester, NY graduating high school in Penfield, NY. After obtaining a Bachelor of Science at the University of North Carolina at Wilmington and an Associate of Science at Brunswick Community College, he went on to work for the North Carolina State University Fish Barn. With encouragement and support from his mentor, Dr. Thomas Losordo, Todd went on to obtain his Master of Science and Doctorate of
ACKNOWLEDGMENTS
The person to whom I owe the greatest thanks is my mentor and friend, Tom Losordo. Your guidance, advice, counseling, and love have provided for me an excellent foundation on which I will support my family. I am forever grateful.
There are two other people who have significantly contributed to my success as a student as well as a person – Dennis DeLong and Rick Jones. Thank you both for your humor and support. Here’s hoping for many more years of the same.
I would like to thank my committee, of course, for their support and guidance as well. Dr. Francis de los Reyes has assisted in showing me the intricacies of wastewater treatment like no one else could. Dr. Mike Burchell has allowed me to bounce many a strange idea off of him and provided me with advice and guidance in my understanding of constructed treatment wetlands. Dr. Steve Broome helped me in the shaping and designing of my constructed treatment wetlands project and for his help I am greatly appreciative.
I would like to thank Dr. Marc Turano. Marc has been my liaison between graduate student and PhD. Marc, your persistent support and guidance have not gone unnoticed. I owe you many more thanks than I can express here.
TABLE OF CONTENTS
LIST OF TABLES ... ix
LIST OF FIGURES ... xi
Solid waste capture from recirculating aquaculture systems using a geotextile bag system with a flocculant-aid ...1
Abstract ...1
1. Introduction ...2
2. Materials and Methods ...5
2.1. Freshwater system ...5
2.1.1. Containment system ...6
2.1.2. Flocculant-aid dosing system...7
2.1.3. Operation of the freshwater geotextile bag system ...8
2.2. Saltwater system ...9
2.2.1. Containment system ...11
2.2.2. Flocculant-aid dosing system...12
2.2.3. Operation of the marine geotextile bag system ...12
2.3. Sampling ...13
2.4. Water quality and sludge analysis...14
3. Results and discussion ...15
3.1. Freshwater system ...16
3.1.1. Water quality analysis ...16
3.1.2. Sludge analysis ...18
3.2. Marine system ...20
3.2.1. Marine system water quality analysis ...20
3.2.2. Phosphorus capture and transformation ...23
3.3. Nitrogen removal and transformations ...23
4. Conclusions ...27
6. References ...28
Nitrogen conversion and removal from marine recirculating aquaculture effluent using aerobic and anoxic biological filtration ...30
Abstract ...30
1. Introduction ...31
2. Materials and methods ...37
2.1. Biological filtration ...39
2.1.1. Fixed bed bioreactors ...40
2.2. Organic carbon dosing ...44
2.3. Water quality sampling ...44
2.4. Water quality analysis ...45
2.5. Data analysis ...47
3. Results and Discussion ...47
3.1. Summary statistics...49
3.2. Denitrification ...52
3.2.1. Denitrification statistical analysis ...55
3.2.2. Effects on VTNR performance ...61
3.2.3. VTNR performance ...68
3.3. Nitrification ...70
3.3.1. Nitrification statistical analysis ...72
3.3.2. VTR and VNR performance ...79
3.4. Phosphorus Removal ...81
4. Conclusions ...83
5. Acknowledgements...84
Abstract ...89
1. Introduction ...90
2. Materials and methods ...96
2.1. Wastewater ...98
2.2. Constructed treatment wetland ...98
2.2.1. Vertical flow wetland cells ... 101
2.2.2. Free water surface wetland cells ... 103
2.3. Weather monitoring ... 105
2.4. Sampling ... 105
2.5. Water quality analysis ... 106
2.6. Data analysis ... 108
3. Results and Discussion ... 108
3.1. Summary Statistics ... 110
3.2. Vertical flow constructed wetland performance ... 120
3.2.1. VF treatment effects ... 121
3.2.2. VF cell phosphorus removal ... 126
3.2.3. VF plant performance ... 127
3.2.4. VF observations... 128
3.3. Free water surface wetland cell performance... 130
3.3.1. FWS TAN removal performance ... 131
3.3.2. FWS TN removal performance ... 135
3.3.3. Phosphorus removal in the FWS cells ... 137
3.3.4. FWS observations and implications ... 137
3.4. Batch treatment analysis ... 139
3.5. Phosphorus removal ... 145
3.6. Implications ... 147
4. Conclusions ... 148
5. Acknowledgements... 150
APPENDICES ... 155
Appendix A – Geotextile Statistical Analysis ... 156
1. SAS Code ... 156
2. SAS Output ... 157
APPENDIX B: Biofilter Statistical Analysis ... 160
1. SAS Code ... 160
2. SAS Output ... 175
APPENDIX C – Wetlands Statistical Analysis ... 196
1. SAS Code ... 196
1.1. General analysis ... 196
1.2. Means analysis ... 211
1.3. VF analysis ... 226
1.4. FWS analysis ... 243
2. SAS Ouput ... 270
2.1. General analysis output... 270
2.2. Means output ... 280
2.3. VF output ... 294
LIST OF TABLES
Solid waste capture from recirculating aquaculture systems using a geotextile bag system with a flocculant-aid
Table 1. Summary of influent and effluent water quality parameters for the freshwater
geotextile bag system. ...18 Table 2. Sludge analysis from the freshwater geotextile bag system collected on day 300 (day 70 of the dewatering phase). ...19 Table 3. Metal analysis for the sludge from the freshwater geotextile bag system...19
Table 4. Summary of influent and effluent water quality parameters for the marine
geotextile bag system. ...22
Nitrogen conversion and removal from marine recirculating aquaculture effluent using aerobic and anoxic biological filtration
Table 8. ANOVA table for VTR...74 Table 9. ANOVA table for VNR. ...75 Table 10. Phosphorus removal using SeaKlear Phosphate Remover. ...82
Treatment of marine recirculating aquaculture effluent using a two-stage constructed treatment wetland
Table 1. Influent water quality parameters for the vertical flow wetland cells. A
characterization is provided for the entire study, the growing season portion of the study, and the non-growing season portion of the study. ... 112 Table 2. The operational and performance characteristics for the vertical flow wetland cells. A characterization is made for the entire study period, and the portions of the study during either the growing or non-growing seasons. ... 113 Table 3. The influent water quality parameters for the free water surface wetland cells during the HRThigh operational phase... 115 Table 4. The operational and performance characterization of the free water surface
wetland cells during the HRThigh operational phase. ... 116 Table 5. The influent water quality parameters for the free water surface wetland cells during the HRTlow operational phase. ... 118 Table 6. The operational and performance characteristics of the free water surface wetland cells during the HRTlow operational phase. ... 119 Table 7. Analysis of treatment for the entire constructed treatment wetland system
LIST OF FIGURES
Solid waste capture from recirculating aquaculture systems using a geotextile bag system with a flocculant-aid
Figure 1. The freshwater geotextile bag effluent solids capture system for the North
Carolina State University FishBarn. ...6
Figure 2. The marine geotextile bag system at the Marine Aquaculture Research Center. ..10
Figure 3. Inlet and outlet total nitrogen concentrations for the freshwater geotextile bag system...24
Figure 4. Effluent ratios for NO3-N:TN and TKN:TN for the freshwater geotextile bag system...25
Nitrogen conversion and removal from marine recirculating aquaculture effluent using aerobic and anoxic biological filtration Figure 1. Experimental biological waste treatment facilities for the Marine Aquaculture Research Center. ...39
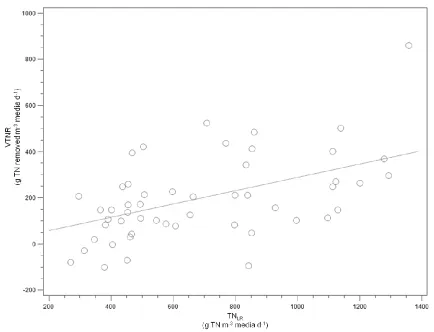
Figure 2. A regression analysis for the effect of TNLR on VTNR. ...63
Figure 3. A quadratic regression analysis on the effect of CODLR on VTNR. ...64
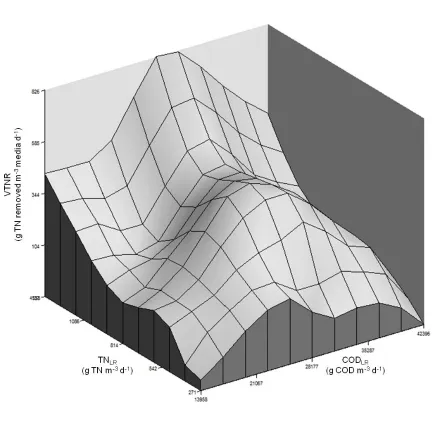
Figure 4. The combined effect of TNLR and CODLR on VTNR for the overall study. ...66
Figure 5. The combined effect of TNLR and CODLR on VTNR for COD:TN > 30. The CODLR axis scale is reversed (high to low) for improved visualization. ...67
Figure 6. The combined effect of TNLR and CODLR on VTNR for COD:TN < 30. ...68
Figure 7. The linear regression analysis of the effect on VTR by TANLR. ...76
Figure 9. A time-series analysis of the acclimation period after a new batch of wastewater was moved into the reactor system reservoir. The influent TAN and NO2-N concentrations are listed on the vertical axis on the right. ...80
Treatment of marine recirculating aquaculture effluent using a two-stage constructed treatment wetland
Figure 1. Layout of the constructed treatment wetland system at the Marine Aquaculture Research Center. ... 100 Figure 2. Volumetric TAN removal rate for the VF cells during the growing season. A
Solid waste capture from recirculating aquaculture systems using a geotextile bag system with a flocculant-aid
Todd C. Guerdat
Abstract
Two separate geotextile bag systems were evaluated as a means for capturing and dewatering bio-solids in the effluent stream from a recirculating aquaculture system (RAS), each using a different high molecular weight cationic polyacrylamide (PAM) polymer as a flocculant-aid under freshwater and brackish water conditions. A complete analysis
including water quality and agronomic sludge analysis was conducted at the North Carolina State University Fish Barn - a large-scale, freshwater RAS demonstration and growout facility. An evaluation of water quality and performance of a similar geotextile bag system was also conducted at the Marine Aquaculture Research Center near Marshallberg, North Carolina, USA, under brackish conditions (15 PPT). Results indicated that performance was similar with TSS, COD, TN, and TP removal greater than 95%, 65%, 50%, and 38%,
respectively, for both systems. Analysis of the sludge collected in the freshwater system after 70 days in a dewatering, inactive mode, showed a moisture content (MC) of 86%, or 14% dry matter (DM), indicating the system was highly effective at dewatering the bio-solids with no external energy input. Nutrient removal efficiency may be system specific due to geotextile bag size and influent flow rate.
research is needed to optimize geotextile bag system designs to promote near steady-state operating conditions that will aid in determining the size and type of treatment required downstream from the geotextile bag system.
1. Introduction
Due to increased regulatory limitations imposed on effluent discharge, there is an increased need for economically sustainable, ecologically conscious wastewater treatment systems. Most aquaculture systems are designed and operated to capture and treat all wastewater to meet local discharge regulations. However, these regulations vary widely within industries depending on the production facility location. Recirculating aquaculture systems (RAS) are used throughout the world as a means for culturing aquatic organisms in a controlled environment. RAS offers an ideal means for effluent capture, thus enabling further treatment of the effluent with the potential to meet even strict effluent limitations. As developed today, commercial recirculating systems generally replace 5 – 15% of the total production systems volume per day. As such, a commercial facility that carries an average biomass of 100 metric tons (with a culture density of 80 kg fish m-3 water) would produce 62 – 188 m3 of wastewater per day.
The traditional wastewater treatment process train is typically a 3-stage process with a primary solids separation and removal process, a secondary biological treatment process for the purpose of biochemical oxygen demand (BOD) and other dissolved nutrient
dictated by the effectiveness of each preceding treatment process. Improving the efficiency and effectiveness of any stage of the treatment process would only reduce the size and cost of downstream processes. Improving the efficiency in the first stage would reduce the impact on the subsequent stages and potentially improve the economics of the treatment process on the whole.
(Leonard et al., 2002; Nogueira et al., 2002) thus potentially reducing the size of the treatment systems required in the second and third stages. Therefore, to improve the efficiency of the wastewater treatment system, and potentially reducing the cost of treatment, efforts should be focused on maximizing the efficiency of the primary solids removal process in the wastewater treatment system.
Restrictions placed on effluent disposal by concentrated aquatic animal production (CAAP)facilities by the United State Environmental Protection Agency (EPA) require a reduction in discharged TSS, BOD and other dissolved nutrients (EPA, 2004). To improve the TSS removal efficiency of a geotextile bag system, organic polymers are typically employed to aid in the flocculation of the particulate matter in the waste stream. Polymers typically employed in the drinking water and wastewater industries range in type and molecular weight and are designed to target certain constituents in a waste stream. An evaluation of the different types of polymers available for water treatment in a geotextile bag system showed promising results for the treatment of recirculating aquaculture wastewater (Ebeling et al., 2005). The combined use of a polymer as a flocculant-aid with a geotextile bag system increases the TSS removal efficiency while serving as a low energy, relatively low cost, highly efficient solids separation system that has been utilized in the renovation of confined animal production lagoons with excellent results (Cantrell et al., 2008; Sharrer et al., 2009).
producing wastewater during the operation of two different recirculating systems at North Carolina State University.
2. Materials and Methods
The work reported in this study was conducted at two different facilities operated by the Department of Biological and Agricultural Engineering at North Carolina State University (NCSU). Two different geotextile bag systems were evaluated using waste generated from either freshwater or marine recirculating aquaculture systems.
2.1. Freshwater system
The NCSU Fish Barn facility was used to evaluate the operational characteristics of a geotextile bag with a flocculant-aid for the purpose of solids removal from a freshwater RAS waste stream. The NCSU Fish Barn is a commercial-scale, research and demonstration recirculating aquaculture production facility. The project was conducted with waste that was generated by a two-tank (60 m3 each) fish production system. A detailed description of the production system and its primary water re-use components can be found in Losordo et al. (2000). Waste from the production system passed through a drum-screen filter (Hydrotech, model 802; Hydrotech AB, Sweden) fitted with 40 micron polyester screens. The backwash waste stream from the microscreen filter flowed by gravity to the geotextile bag system.
Figure 1. The freshwater geotextile bag effluent solids capture system for the North Carolina State University FishBarn.
2.1.1. Containment system
PVC pipe. Sump 1 was configured with a submersible pump (Little Giant 0.3 KW, submersible sewage pump) that was activated by a water level float switch. The float switch, at a “high-water” setting, activated both the submersible pump in Sump 1 and a polymer pump (BL20, Hanna Blackstone, RI, USA) (see Fig. 1) located adjacent to Sump 1. The geotextile bag containment structure consisted of an EPDM rubber lined rectangular 9.1 m x 6.0 m wooden basin with a central 110 mm perforated corrugated polyethylene drain pipe. The basin was filled with crushed granite gravel (20 - 38 mm average diameter) which covered over the drain pipe and created a level surface on to which the geotextile bag was placed. The geotextile bag used for this study was 7.62 m x 4.57 m diameter with an approximate pore size of 400 microns (Geotube®, Tencate Geosynthetics, GA, USA). The containment basin was covered to prevent rainwater interference. Clarified effluent seeped through the pores of the geotextile bag, infiltrated through the rocks, and drained from the lined basin through the 110 mm perforated polyethylene drainage pipe. The clarified effluent sump (Sump 2, Fig. 1) received all of the captured effluent from the containment basin by gravity flow. Water collected in Sump 2 flowed by gravity to a storage pond for storage prior to being irrigated on crop land.
2.1.2. Flocculant-aid dosing system
device was made of twelve 110 mm diameter PVC 90° elbows. The injection point was configured with a 90 mm diameter “wye” PVC pipe fitting. The polymer was delivered to the injection point via a 9.5 mm diameter polyethylene semi-rigid tube. Water from Sump 1 was pumped to the geotextile bag at a rate of approximately 40 L min-1. Water flow rate to the geotextile bag was regulated using two ball valves. The remaining water flow capacity was recirculated within the sump to facilitate mixing of settled solids. The polymer solution was simultaneously pumped into the influent stream at a rate of 175 – 200 mL min-1 producing a PAM dose concentration of 10.4 – 12 mg L-1. The larger diameter mixing device provided more time, more quiescent mixing conditions, and less shearing of the flocculated particles in the waste stream prior to entering the geotextile bag.
2.1.3. Operation of the freshwater geotextile bag system
Installation of the geotextile bag system was completed by May 20, 2005 and waste began flowing from the fish culture system. The fish culture system contained approximately 15,000 juvenile tilapia (Oreochromis nilotica). Feed to the two tanks was distributed evenly over a 24 hour period every 30 minutes with automatic feeders. The feed used in this trial was a 40% protein, 10% fat commercial floating pellet diet (Finfish Silver, Zielger Brothers, PA, USA).
Similar stocking rates and feed type were used in this cohort also. Sampling ended for this cohort on January 25, 2006 and the geotextile bag system was taken offline and allowed to further dewater for a period of 70 days.
2.2. Saltwater system
The saltwater geotextile bag system was evaluated under marine conditions at the Marine Aquaculture Research Center (MARC) near Marshallberg, North Carolina, USA. This study was conducted with waste from two marine recirculating aquaculture systems at the MARC. Each system utilized granular filtration for the purpose of solids removal. System 1 utilized a bubble washed bead filter (BBF-XS12000, Aquaculture System Technologies, LA, USA) which was backwashed approximately once daily with an average water usage per backwash of 250-300 L. System 2 utilized two air-washed granular bead filters (BF60BL, Aquatic Ecosystems, FL, USA). Additionally, there were two smaller broodstock
2.2.1. Containment system
The geotextile bag system for the MARC was designed similarly to the NCSU Fish Barn setup. The containment system consisted of a primary effluent sump, a covered, EPDM lined basin, and a clarified effluent sump.
All of the marine aquaculture wastewater leaving the MARC facility flowed by gravity through a 110 mm PVC pipe into a single primary effluent sump (Sump 1, Fig. 2). Inside Sump 1 a water level float switch activated a submersible pump which pumped at an approximate flow rate of 40 L min-1 into the geotextile bag (Geotube®, Tencate Geosynthetics, USA). As in the freshwater system, the float switch also simultaneously activated a polymer injection pump (BL20, Hanna Blackstone, RI, USA) which injected at a point immediately upstream of the mixing device (see Fig. 2). The waste stream was pumped through a mixing device and finally into the geotextile bag where the flocculated solids were captured and stored for future treatment. The geotextile bag was contained in an EPDM lined wooden basin (9.1 m x 5.2 m) and was covered to block sunlight and prevent rainwater infiltration into the system. The geotextile bag was 7.6 m long x 4.5 m diameter with a single inlet in the middle of the top of the bag. The bag was placed on a water-wicking mat supplied by Tencate
2.2.2. Flocculant-aid dosing system
Upon activation of the water level float switch in Sump 1, the polymer injection pump injected a cationic PAM polymer (Hyperflow CE809, Hychem Inc., FL, USA) solution of 100 mL of PAM per 40 L of water into the waste stream at an average rate of 200 - 300 mL min-1 producing a polymer dose of 12.5 – 18.75 mg L-1. The CE809 PAM polymer used for this study was different from the freshwater system as it is designed for use with saltwater. The polymer injection rate was able to be varied using an adjustment knob on the pump. The polymer solution was injected directly upstream from the mixing device which was made of twelve 110 mm diameter PVC elbows. The injection point was configured with a 50 mm diameter “wye” PVC pipe fitting. The polymer was delivered to the injection point with a 9.5 mm diameter polyethylene semi-rigid tube.
2.2.3. Operation of the marine geotextile bag system
The marine geotextile bag system began receiving wastewater March 25, 2010 and was still in operation at the time of completion of this manuscript. Influent and effluent water samples were taken starting March 8, 2011 (day 349) for a period of 112 days to provide an analysis of performance and a comparative analysis between the marine and freshwater water quality parameters.
other feed was a 40% protein, 10% lipid feed (Finfish Silver, Zeigler Brothers, Inc., PA, USA).
Water leaving the marine geotextile bag system was stored for further treatment in a 75.7 m3 storage tank (ST1). Water in ST1 was stored until the tank was full and then
pumped to a separate reservoir tank for further treatment. The wastewater storage tank was covered to block sunlight and prevent rainwater accumulation.
2.3. Sampling
Water sample collection for both systems was scheduled at the time of the
backwashing events from the systems inside each facility. Grab samples were collected in the primary and the clarified effluent sumps of each system. Primary effluent sump samples were taken after the sump was fully mixed to provide the most accurate characterization of the influent waste stream. In the event that samples were not able to be analyzed
immediately, samples were preserved via acidification at a pH of 2.0 or lower using reagent grade sulfuric acid (H2SO4) and then refrigerated. When samples were acidified, a second separate, non-acidified sample was collected for suspended solids analysis and was refrigerated immediately until the time of analysis. SRP samples were filtered immediately and refrigerated but not acidified per analysis requirements.
collected on day 70. The freshwater geotextile bag was opened and a total volume and weight of the dewatered sludge were measured.
2.4. Water quality and sludge analysis
Water quality samples for both systems were analyzed for the following parameters: TAN, NO2-N, NO3-N, TP, COD, pH, alkalinity, dissolved oxygen (DO), temperature.
Additionally, the marine geotextile bag system samples were analyzed for soluble reactive phosphorus (SRP, PO4-3-P) and salinity.
The measuring of DO, temperature, and salinity was conducted on-site using a handheld multi-parameter meter (YSI85, Yellow Springs Instruments, OH, USA). Samples were analyzed for pH as soon as possible after collection using a portable pH meter (pH100, Yellow Springs Instruments, OH, USA). Alkalinity was measured by titration to a pH
endpoint of 4.8 (EPA, 1984).
Water quality samples for both the freshwater and marine systems were analyzed at the Environmental Analysis Laboratory (EAL) at the department of Biological and
addition to correct for Chloride interference (Hach Method 8000. EPA Approved-Federal register, 1980). Analysis of TOC was conducted using a Teledyne Tekmar Apollo 9000 combustion TOC analyzer with auto-sampler via oxidation by combustion and IR detection (EPA, 1984).
On-site water quality analysis for the marine system at the MARC facility included TAN, NO2-N, and NO3-N using a spectrophotometer and standardized curves based on the salinity of the sample water (DR2800, Hach Company, CO, USA). TAN analysis was conducted using the Nessler method (Hach method 8038). NO2-N analysis was conducted using the diazotization method (Hach method 8507). NO3-N analysis was conducted using the cadmium reduction method (Hach method 8039).
Soluble reactive phosphorus and total phosphorus analysis was performed by the North Carolina State University Center for Applied Aquatic Ecology. Total phosphorus and soluble reactive phosphorus analyses were performed per Standard Methods (Standard Method 4500 P F (EPA Method 365.1); APHA, 1995).
Sludge analysis was performed by the North Carolina Department of Agriculture (NCDA) Agronomic Division waste analysis services (Raleigh, NC, USA).
3. Results and discussion
Summary statistics are provided for each system. Water quality analysis was performed for the influent and effluent for each system. A complete volumetric, weight, and agronomic sludge analysis was performed on the freshwater system sludge once
3.1. Freshwater system
Water quality data collection started on day 4 of operation of the freshwater geotextile bag system. Initial operation resulted in water pooling on the surface of the flat geotextile bag. Once an ample amount of solids were collected inside to round out the top of the bag, the pooling of water on the surface of the bag stopped and water began to exit the bag through the bottom and sides. For approximately the first 30 days of operation the bag produced an ammonia-like odor. To eliminate the odor, hydrated lime was spread on the top of the bag every two days for approximately 2 weeks. Once the odor began to subside, lime addition was no longer required.
The average daily rate of feed applied to the system was 52.4 ± 26.7 kg d-1 (mean ± standard deviation), with a maximum feed rate of 90 kg d-1, over the total period of 230 days. The amount of feed for the evaluation totaled 12,099 kg. During the time of operation, daily water flow rates from the drum-screen waste stream to the geotextile bag system averaged 12.1 ± 6.2 m3 day-1.
Sludge analysis was performed on day 300 after the system was left idle for 70 days for the purpose of dewatering the collected solids.
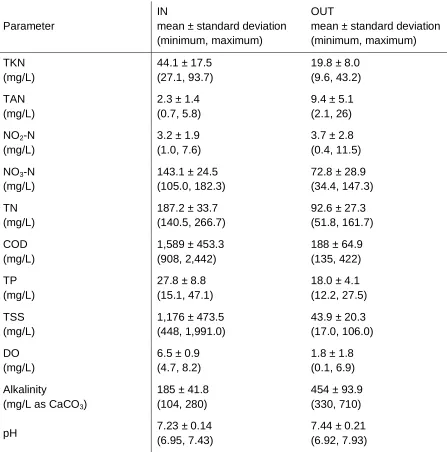
3.1.1. Water quality analysis
Table 1. Summary of influent and effluent water quality parameters for the freshwater geotextile bag system.
Parameter
IN
mean ± standard deviation (minimum, maximum)
OUT
mean ± standard deviation (minimum, maximum) TKN
(mg/L)
44.1 ± 17.5 (27.1, 93.7)
19.8 ± 8.0 (9.6, 43.2) TAN
(mg/L)
2.3 ± 1.4 (0.7, 5.8)
9.4 ± 5.1 (2.1, 26) NO2-N
(mg/L)
3.2 ± 1.9 (1.0, 7.6)
3.7 ± 2.8 (0.4, 11.5) NO3-N
(mg/L)
143.1 ± 24.5 (105.0, 182.3)
72.8 ± 28.9 (34.4, 147.3) TN
(mg/L)
187.2 ± 33.7 (140.5, 266.7)
92.6 ± 27.3 (51.8, 161.7) COD
(mg/L)
1,589 ± 453.3 (908, 2,442)
188 ± 64.9 (135, 422) TP
(mg/L)
27.8 ± 8.8 (15.1, 47.1)
18.0 ± 4.1 (12.2, 27.5) TSS
(mg/L)
1,176 ± 473.5 (448, 1,991.0)
43.9 ± 20.3 (17.0, 106.0) DO
(mg/L)
6.5 ± 0.9 (4.7, 8.2)
1.8 ± 1.8 (0.1, 6.9) Alkalinity
(mg/L as CaCO3)
185 ± 41.8 (104, 280)
454 ± 93.9 (330, 710)
pH 7.23 ± 0.14
(6.95, 7.43)
7.44 ± 0.21 (6.92, 7.93)
dewatering period) the freshwater geotextile bag was opened and the collected sludge was removed for agronomic analysis, weight, and volume. The total amount of sludge produced on a wet basis was 4.94 m3 with a total weight of 4,545 kg. The sludge percent dry matter (%DM) was 13.9%, yielding 632 kg sludge on a dry weight basis. A full agronomic nutrient and metal analysis was performed on the sludge and the results are shown in Table 2 and Table 3, respectively.
Table 2. Sludge analysis from the freshwater geotextile bag system collected on day 300 (day 70 of the dewatering phase).
TKN TAN NOx-N1 TP COD TOC Cl K S SS 2 DM 3
(%) VS 4
(%) Wet basis
(g m-3) 9,162 1,710 0.8 2,602 297,000 8,407 119 100 637 18 13.9 84.8 Total dry
weight (kg)
6.3 1.2 0.001 1.8 203.9 5.8 0.1 0.1 0.4 0.01 632 536
1
NOx-N = combined NO2-N and NO3-N 2 SS = Soluble salts
3 DM = dry matter 4 VS = Volatile solids
Table 3. Metal analysis for the sludge from the freshwater geotextile bag system.
B Ca Cd Cu Fe Mg Mn Na Ni Pb Zn
Wet basis
(g m-3) 0.4 3,300 0.1 42 440 178 82 498 0.7 1.1 118 Total dry
weight (g)
3.2. Marine system
Water quality analysis began on day 349 of operation of the marine geotextile bag system. Water quality data was collected for 112 days. Similar to the freshwater system, standing water was observed on the top of the geotextile bag and a strong odor was produced until a sufficient amount of solids were collected to round out the top of the geotextile bag. Hydrated lime was also broadcast on the surface of the bag to control the odor.
During the period of study, the MARC facility had two separate marine RAS in operation with a total system volume of 24 m3 (8.7 m3 system and a 15.3 m3 system). The average daily rate of feed applied to both of the systems for the period of this study was 5.1 kg d-1 (0 kg d-1 minimum, 11 kg d-1 maximum) over the total operational period of 230 days. During the time of the study, daily water flow rates from the MARC facility waste stream to the geotextile bag system averaged 1.9 m3 day-1.
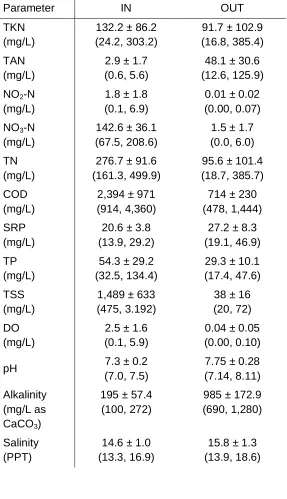
3.2.1. Marine system water quality analysis
effluent as compared to the influent. Average alkalinity concentrations increased in the effluent by 883.6 ± 131.9 mg L-1 as CaCO3. Salinity also increased an average of 10.4% ± 13.1%, potentially due to evaporation in the covered containment basin causing an
Table 4. Summary of influent and effluent water quality parameters for the marine geotextile bag system.
Parameter IN OUT
TKN (mg/L)
132.2 ± 86.2 (24.2, 303.2)
91.7 ± 102.9 (16.8, 385.4) TAN
(mg/L)
2.9 ± 1.7 (0.6, 5.6)
48.1 ± 30.6 (12.6, 125.9) NO2-N
(mg/L)
1.8 ± 1.8 (0.1, 6.9)
0.01 ± 0.02 (0.00, 0.07) NO3-N
(mg/L)
142.6 ± 36.1 (67.5, 208.6)
1.5 ± 1.7 (0.0, 6.0) TN
(mg/L)
276.7 ± 91.6 (161.3, 499.9)
95.6 ± 101.4 (18.7, 385.7) COD
(mg/L)
2,394 ± 971 (914, 4,360)
714 ± 230 (478, 1,444) SRP
(mg/L)
20.6 ± 3.8 (13.9, 29.2)
27.2 ± 8.3 (19.1, 46.9) TP
(mg/L)
54.3 ± 29.2 (32.5, 134.4)
29.3 ± 10.1 (17.4, 47.6) TSS
(mg/L)
1,489 ± 633 (475, 3.192)
38 ± 16 (20, 72) DO
(mg/L)
2.5 ± 1.6 (0.1, 5.9)
0.04 ± 0.05 (0.00, 0.10)
pH 7.3 ± 0.2
(7.0, 7.5)
7.75 ± 0.28 (7.14, 8.11) Alkalinity
(mg/L as CaCO3)
195 ± 57.4 (100, 272)
985 ± 172.9 (690, 1,280)
Salinity (PPT)
14.6 ± 1.0 (13.3, 16.9)
3.2.2. Phosphorus capture and transformation
The total amount of phosphorus in the marine geotextile bag effluent was reduced by approximately 42% as compared to the influent. As noted above, to better characterize the phosphorus content in both the influent and effluent, SRP was measured in conjunction with TP. The marine geotextile bag system effectively captured approximately 42% of all
phosphorus in the influent stream, likely as particulate matter. The remaining phosphorus was primarily in the ortho-phosphate form (PO4-3) and measured as SRP. The average SRP:TP ratio in the influent was 0.379 while in the effluent the SRP:TP was 0.928. The likely explanation for the increase in SRP in the effluent may be attributed to the degradation of biomass inside the geotextile bag and the subsequent release of orthophosphate from the cell mass. A small amount of biological phosphorus is contained in microbial cells, and as the cells degrade, the phosphorus is released back into the system.
3.3. Nitrogen removal and transformations
As waste solids were collected in the geotextile bag, it was expected that ammonification would occur as a part of the biological processes occurring in the bag. Ammonification is the process by which organic nitrogen is mineralized to ammonium (NH4+) as part of the biological organic degradation process. As the amount of collected solids in the geotextile bag increases, the process of degradation of the organics begins. Over time, the effluent water quality characterization changes in terms of composition due to
constituents may show the evolution of the degradation processes occurring inside the geotextile bag.
Characterizing the freshwater system over the duration of the study provided a good picture of the evolution of the effluent character. The freshwater geotextile bag system removed an average of 50% of the influent TN over the entire study period. The TN removal efficiency gradually increased over the course of the study, but generally remained
consistent near 50% (see Fig. 3).
Figure 3. Inlet and outlet total nitrogen concentrations for the freshwater geotextile bag system.
treatment performance from a geotextile bag system (see Fig. 4). As a means for describing the variability of a set of ratios, the coefficient of variation (CV) divides the standard
deviation by the mean. The smaller the CV, the less variation in the set of ratios. The overall trend for the effluent NO3-N:TN ratio (0.77 ± 0.10) was decreasing showing that as the processes occurring in the geotextile bag matured, the ratio became more steady (CV = 0.13). The best-fit regression curve describing the NO3-N:TN ratio required a natural log transform of the data and showed a generally decreasing trend and beginning to level off at 0.7 (R2 = 0.34) (see Fig. 4). Comparatively, the TKN:TN ratio (0.23 ± 0.10) showed a general increasing trend and CV = 0.43 indicating more variability in the ratio of the course of the study. The regression curve describing the TKN:TN ratio over time also required a natural log transform of the data and shows a generally increasing trend and indicates the trend also levels off (R2 = 0.38) (see Fig. 4).
Evaluating the marine geotextile bag system NO3-N:TN and TKN:TN ratios provided a different characterization from the freshwater system, and suggested the TKN:TN ratio may offer a more reliable measure for determining near-steady state conditions in a
geotextile bag system over NO3-N:TN. The TKN:TN ratio (0.93 ± 0.11 and CV = 0.12) was more consistent than the freshwater system while the NO3-N:TN ratio was very small and not as informative (0.04 ± 0.05 and CV = 1.25). The primary difference between the marine and freshwater systems was flow rate. The freshwater system averaged 12.1 m3 d-1 while the marine system averaged 1.9 m3 d-1. The geotextile bags for each system were virtually identical in size. The difference in flow rates also relates to the HRT for each system and the overall efficiency. As a further characterization, the freshwater system was operated for a total period of 230 days (beginning with an empty geotextile bag) while sampling for the marine system began on day 349 and continued for 112 days. The characterization
provided in this report describes a beginning-to-end performance for the freshwater system while the marine system is likely a better representation of a fully acclimated system. While a longer time study fully detailing the entire period of operation would be the most
informative, the similar performances in each of the geotextile bag systems implies an excellent representation of performance for both marine and freshwater operation.
water flow rates as each system may be operated. A longer time-scale study may yield a more complete understanding of the geotextile bag constituent evolution and provide a final TKN:TN ratio as it pertains to the system.
4. Conclusions
Improving the efficiency of a wastewater treatment system may reduce the cost of treatment. Maximizing the efficiency of the primary solids removal process in the
wastewater treatment system will reduce the impact on downstream treatment processes, thus reduce the size and cost of the subsequent treatment processes and provide the greatest potential for overall treatment cost reduction. The use of a geotextile bag system with a flocculant-aid offers an improved performance in terms of TSS, COD, TN, and TP reduction and may cost considerably less than alternative solid waste capture and
dewatering mechanisms with similar performance and with minimal maintenance required. Both reduced cost and maintenance advantages offer great appeal to facility managers and will more effectively promote environmental stewardship.
5. Acknowledgments
The authors wish to acknowledge the assistance of Mr. Grant Hollowell, Mr. Nick Reynolds, and Dr. Marc Turano. We would also like to acknowledge the generous support of Dr. IJ and Sue Won. Support for this project also was provided through grants from USDA NIFA and the NOAA and the North Carolina Sea Grant, Fisheries Resource Grants program.
6. References
American Public Health Association, American Water Works Association and Water Environment Federation, 1995. Standard Methods for the Examination of Water and Wastewater, 19th ed.. 154 D. McIntosh, K. Fitzsimmons and American Public Health Association, Washington, DC, USA.
Comeau, Y., Hall, K. J., Hancock, R. E. W., and Oldham, W. K., 1986. Biochemical model for enhanced biological phosphorus removal. Wat. Res. 20 (12), 1511-1521.
Cripps, S.J., Bergheim, A., 2000. Solids management and removal for intensive land-based aquaculture production systems. Aquacult. Eng. 22, 33–56.
Ebeling, J. M., Rishel, K. L., Sibrell, P. L., 2005. Screening and evaluation of polymers as flocculation aids for the treatment of aquacultural effluents. Aquacult. Eng. 33 (4), 235-249. EPA (United States Environmental Protection Agency, 2004. Effluent Limitations Guidelines and New Source Performance Standards for the Concentrated Aquatic Animal Production Point Source Category, Final Rule. 40 CFR Part 451. EPA, Washington, DC.
Leonard, N., Guiraud, J.P., Gasset, E., Cailleres, J.P., Blancheton, J.P., 2002. Bacteria and nutrients - Nitrogen and carbon - In a recirculating system for sea bass production. Aquacult. Eng. 26 (2), 111–127.
Michaud, L., Blancheton, J.P., Bruni, V., Piedrahita, R., 2006. Effect of particulate organic carbon on heterotrophic bacterial populations and nitrification efficiency in biological filters. Aquacult. Eng. 34 (3), 224–233.
Nogueira, R., Melo, L.F., Purkhold, U., Wuertz, S., Wagner, M., 2002. Nitrifying and
heterotrophic population dynamics in biofilm reactors: Effects of hydraulic retention time and the presence of organic carbon. Water Res. 36 (2), 469–481.
Nitrogen conversion and removal from marine recirculating aquaculture effluent using aerobic and anoxic biological filtration
Todd C. Guerdat
Abstract
Greater oversight of nutrient discharge has brought about the need to develop ecologically-sound marine aquaculture wastewater treatment systems. Marine aquaculture is typically located near a coastline and is therefore faced with two primary challenges: effluent management and competition for space. As marine aquaculture develops, systems providing improved wastewater treatment or reuse will help to minimize the environmental impact and potentially reduce capital costs by enabling a new facility to be located further inland.
To develop improved treatment systems a characterization of the effluents from marine aquaculture is required. Recirculating aquaculture systems (RAS) provide an ideal means for facilitating the capture and storage of effluent. By enabling the capture of
effluent, marine RAS wastewater may be characterized and suitable treatment systems may be designed to address required limitations for a facility. Research focused on maximizing the efficiency of treatment must balance maintenance requirements, economic feasibility, and the required limitations imposed on a particular facility for the final handling of the treated effluent.
Marine Aquaculture Research Center (MARC). The MARC is located near Marshallberg, North Carolina and is operated by the North Carolina State University department of Biological and Agricultural Engineering. The treatment system was a two-stage reactor system operated in series which employed an anoxic fixed bed bioreactor (FBBR) and a. aerobic mixed bed bioreactor (MBBR). The effluent from the FBBR served as the influent for the MBBR in an attempt to select for the removal of chemical oxygen demand (COD) via heterotrophic denitrification. The amount of biologically available COD was not adequate to facilitate the nitrogen removal processes thus an exogenous organic carbon source was required. The treatment system effectively converted and removed nitrogen at a suitable rate to support the ongoing operations inside the facility. The study provided both realistic total nitrogen (TN) removal rates as well as operational COD:TN ranges for maximizing the efficiency and performance of the FBBRs. Future designs must first determine if the amount of biologically available organic carbon in the system is adequate to support the required nitrogen removal processes.
1. Introduction
The development of coastal marine aquaculture operations faces two primary
challenges: effluent management and competition for space. Environmental regulations and greater oversight of effluent nutrient discharge has brought about the need to develop sustainable practices and improve the efficiency and economic feasibility of new and
treatment prior to discharge also brings about the need to improve the treatment processes to achieve economic sustainability. In addition to the effluent management challenges faced in the development of coastal aquaculture operations, competition for space and associated expensive coastal land costs may prove to be cost prohibitive. Systems enabling new marine aquaculture operations to move farther inland may dramatically reduce capital investments and improve economic feasibility. To meet both environmental impact and cost associated goals, the aquaculture industry must develop ecologically-sound systems using innovative processes and models that better address the needs of the industry and
surrounding communities.
A characterization of wastewater and the associated treatment processes as they pertain to marine aquaculture is required. Properly designed, recirculating aquaculture systems (RAS) provide an ideal means for effluent capture, thus enabling further treatment. Enabling the move inland for marine aquaculture requires a renewed focus on the capture and storage of effluent and a new approach toward the treatment of aquaculture wastewater that is highly saline. Land-based RAS may aid in addressing the environmental limitations of marine aquaculture by reducing natural resource consumption while producing high yields and potentially minimizing nutrient discharge (van Rijn, 1996; Losordo et al., 2000). As an effective means for reducing the volume of the effluent stream, RAS replace approximately 5-15% of the culture system volume within a system on a daily basis. The use of
is typically characterized as highly organic and requires a significant amount of treatment prior to disposal (Chen et al., 2002). The primary constituents of concern in the effluent stream from RAS are biochemical oxygen demand (BOD) or chemical oxygen demand (COD), total suspended solids (TSS), nitrogen (N), phosphorus (P), and salinity. Marine RAS wastewater treatment systems must be designed to address these wastewater characteristics to maximize efficiency and meet regulatory limitations.
The wastewater treatment process train is a 3-stage process: primary solids separation, secondary wastewater treatment via biological filtration, and tertiary polishing treatment. Improving the efficiency of a single stage of the treatment process reduces the downstream impact and the size and cost of the subsequent treatment processes and potentially improves the economic feasibility overall. Secondary treatment is dependent on both the efficiency of the primary solids separation process as well as the characterization of the RAS wastewater which may be system-specific. Tertiary treatment of the wastewater is dependent upon the final intended use or discharge and/or local regulatory restrictions. As such, the focus must be primarily aimed at the first two stages on the treatment train so as to address the major constituents in the waste stream immediately, thus preventing further break-down into dissolved forms that would be more difficult to remove.
al., 2006), and geotextile bag systems (Sharrer et al., 2009; Guerdat, GEOTEXTILE). One recent pilot-scale study has produced promising results utilizing an activated sludge-type approach coupled with the combination of autotrophic anaerobic ammonia oxidation
(ANAMMOX) and heterotrophic denitrification nitrogen removal processes creating a pseudo closed-loop marine RAS with minimal discharge due to accumulation of inorganic solids (Tal et al., 2009). The closed-loop approach offers a number of resource conservation benefits, but little is reported in the literature on the viability at the commercial scale and may come with higher energy costs. Each of these systems provides a range of benefits but may vary significantly in price.
In the second stage of wastewater treatment the removal of nitrogen and dissolved phosphorus is addressed. Nitrogen conversion and removal is typically addressed utilizing biological filtration, while phosphorus is may be removed from the wastewater via chemical or biological means. Biological filtration processes enable the aerobic conversion of ammoniacal-nitrogen (NH3-N / NH4+-N) to nitrate-nitrogen (NO3-N) via nitrification and the anoxic conversion of NO3-N to gaseous N2 through denitrification. Ammonia in the waste stream originates from the decay of organic matter in the waste stream and is also excreted as a metabolic byproduct by the culture organisms. Total ammoniacal nitrogen (TAN) is the sum of NH3-N and NH4+-N and is converted first to nitrite-nitrogen (NO2-N) as an
Autotrophic nitrogen removal pathways exist as well, though the microbes employing these pathways generally have significantly lower growth and removal rates than the heterotrophic counterparts and are not economically viable as independent solutions based on the
required reactor size needed to treat the typical volume of wastewater produced from a large scale RAS facility (Strous et al., 1998; Schreier et al., 2010). Denitrification within the RAS facility system boundaries can help to reduce the amount of water exchanged by effectively creating an alternative pathway for nitrogen removal and enabling the reuse of the effluent stream.
The discharge of phosphorus in a wastewater stream in the USA is heavily regulated in freshwater, estuarine, and marine waters (Parry, 1998). Phosphorus removal may be addressed in the first and/or second stage of the treatment process train through the removal of particulate organic and inorganic solids, chemical precipitation of
ortho-phosphate (OP), or enhanced biological phosphorus removal (EBPR) (Ebeling et al., 2005; Comeau et al., 1986; Jenkins and Hermanowicz, 1991; Sharrer et al., 2009). Phosphorus is accepted as the limiting nutrient in freshwater ecosystems and is a key factor in causing the eutrophication of surface waters (Schindler, 1977; Hecky and Kilham, 1988). While
phosphorus is considered a potential threat to the eutrophication of estuarine surface waters, nitrogen is more often the limiting nutrient in estuarine and marine ecosystems (Howarth and Marino, 2006). As such, systems must be designed to address both the nitrogen and phosphorus removal processes in marine aquaculture wastewaters.
of organic and inorganic suspended solids and dissolved nutrients when compared to the culture system water. A zero-discharge system must convert or remove all constituents in the waste stream internally without the need to discharge anything from the system. The difficulty of such a design is the accumulation of inorganic solids within the system over time implying the need for some discharge or other removal process. This creates the need to discharge some wastewater and for a place to which these inorganic solids may be discharged. In order for systems to move inland, wastewater treatment systems must address the treatment requirements of these effluents prior to discharge into the
environment. Creating a zero-discharge marine RAS facility may close the loop on one aspect of resource consumption by constantly recirculating the entire volume of water within a facility and may eliminate one possible vector for environmental impact.
This study focuses on the development and characterization of technology for the removal of nitrogen from a pre-treated marine recirculating aquaculture waste stream. The wastewater in this study was first passed through a primary solids removal process
2. Materials and methods
The site for this study was the Marine Aquaculture Research Center (MARC) located in Marshallberg, North Carolina. The MARC is operated by the North Carolina State
University department of Biological and Agricultural Engineering. This pilot-scale marine recirculating aquaculture facility was designed to examine the potential for marine
recirculating aquaculture operations as well as methods to treat the effluent from marine recirculating aquaculture systems (RAS).
The MARC facility is located at the headwaters of a small tidal creek that feeds into a harbor and the adjacent Core Sound along the North Carolina eastern coastline. This tidal creek is both the source for saltwater for all operations within the building and also the receiving body of water into which all treated effluent is discharged. The creek is
surrounded by natural marine wetlands containing a variety of salt-tolerant wetland plants. The facility is a 385 m2 building and is designed to accommodate a variety of experimental marine recirculating aquaculture systems at the pilot scale. There were two primary
recirculating aquaculture systems in operation during the course of this study. Each system consisted of 12 tanks. System 1 was approximately 11 m3 and used twelve 0.75 m3 tanks. During this study, System 1 had a starting and ending biomass of 50 kg and 102 kg,
the backwashing processes of the granular filters served as the wastewater source for this study.
The effluent coming from the ongoing operations inside the research facility was treated to remove primary solids using a geotextile bag system (see Guerdat,
GEOTEXTILE) for complete details) and then stored for further treatment in a 75.7 m3 covered fiberglass tank with a concrete bottom storage tank. The wastewater in the storage tank from the geotextile bag system was pumped to the biological filter reactor system reservoir (see Fig. 1) when a sufficient water level was reached for this study. The
geotextile bag system storage tank and reactor system reservoir were identical in size and construction. The biofilter reactor system layout is shown in Fig. 1. The overall treatment system was operated as a recirculating loop in batches to provide consistent treatment until the treatment process was complete. At the end of each research trial, each batch would be treated for the removal of phosphorus. Phosphorus removal was achieved through
chemical precipitation using a commercially available aqueous solution of a lanthanum (La III) salt (LaCl3; SeaKlear Phosphate Remover, HaloSource, Inc., WA, USA). The treated water was then either discharged through a level spreader onto the surrounding natural wetlands at low tide or reused back in the facility.
Figure 1. Experimental biological waste treatment facilities for the Marine Aquaculture Research Center.
2.1. Biological filtration
PVC pipe. Each pumping sump was a 2.1 m3 polyethylene tank that was painted gray to block sunlight. A constant-head distribution system supplied water from each of the pumping sumps in each biofilter system to an upflow fixed bed bioreactor (FBBR) (DN1, DN2, and DN3; see Fig. 1) to facilitate the equalization of flows between the replicates and maintain consistent flow rates without regular adjustment. Each constant head distribution system delivered water to the FBBR by gravity through a calibrated orifice designed to maintain a consistent flow rate. The holes were monitored regularly for restriction due to bio-fouling or foreign objects. The effluent from the FBBR flowed by gravity into a MBBR (N1, N2, N3; see Fig. 1). The effluent from the MBBR then flowed by gravity back to ST3. Below is a more detailed description of each of the reactors.
2.1.1. Fixed bed bioreactors
Each fixed be bioreactor (FBBR) contained 0.072 m3 of Kaldnes media (Kaldnes North America Inc., RI, USA). The Kaldnes media was previously used in an upflow FBBR in a freshwater wastewater treatment system. To eliminate any possibility of interference from previous use, the media was rinsed, treated with sodium hypochlorite (NaClO) for 48 hours, and then rinsed and dechlorinated using sodium thiosulfate (Na2S2O3).
tank and was only able to exit through a perforated pipe located at the top of the media bed inside the PVC pipe that exited the side of the 30 cm PVC pipe and the containment
polyethylene tank via a 50.8 mm PVC pipe.
A regular air-backwash schedule was maintained for the FBBRs once every 48 hours. Additional backwashes were performed on an as-needed basis as well when the media bed showed signs of clogging due to excess biomass production during times of high nutrient loading. Backwashing of the FBBRs was not performed less than 24 hours prior to sampling.
Nitrogen removal may be reported either as the removal of NO3-N or TN, though performing a full mass balance is the only reliable way to determine complete nitrogen removal was achieved rather than converted via other possible reduction pathways. The TN removal rate was chosen as the most suitable means for reporting the rate of nitrogen removal in this study. Reporting the volumetric constituent removal rates for biological filters in RAS has been suggested as a standardized means for relating performance. Preferable to reporting biological filter removal rates based on biofilter media specific surface area, volumetric removal rates are generally accepted as an industry standard in the aquaculture community (Colt, 2006; Drennan et al, 2006). Volumetric TN removal rates (VTNR) were calculated based on the difference in the influent and effluent TN concentrations and normalized based on the volume of unexpanded media in each reactor (Eq. 1) and described as:
VT 1. f T T
where VTNR = volumetric TN removal rate (g TN removed m-3 media day-1), Qf = reactor flow rate (L min-1), TNI and TNE are the influent and effluent TN concentrations, respectively (g TN L-1), and Vm = the total unexpanded volume of filter media (m3) in the reactor.
2.1.2. Moving bed bioreactors
The effluent from each FBBR flowed by gravity to the MBBR in each of the biofilter systems. Each MBBR contained 0.36 m3 of Kaldnes media. The same batch of biofilter media was used for both the MBBRs and FBBRs and was treated the same as previously described prior to addition to the reactor systems. The MBBR media was contained in a 1.14 m3 diameter, 2.1 m high polyethylene tank, identical to the FBBR, which was also painted gray to block sunlight and inhibit algae growth inside the reactor. Water entered the reactor from the bottom of the tank and exited through a perforated 50.8 mm diameter PVC pipe located at the top of the tank.
The MBBRs were constantly mixed via aeration. Mixing with air provides the
necessary oxygen required for the aerobic nitrification processes and effectively makes the MBBRs a continuously stirred tank reactor (CSTR). Measuring the rate at which both TAN and NO2-N are removed from the water is important in determining the expected
performance of the biological filter under specific operating conditions.
removal rate (VNRA) is based on the measured difference in the influent and effluent NO2-N concentrations normalized over the reactor media volume (Eq. 3). VNRA does not account for the production of nitrite-nitrogen in the TAN conversion process. Thus, the actual volumetric nitrogen removal rate (VNR) is the normalized removal rate of nitrite-nitrogen accounting for both the production of nitrite-nitrite-nitrogen from the TAN conversion process as well as the conversion of NO2-N to NO3-N (Eq. 4). The equations used to determine the VTR, VNRA, and VNR are described as follows:
VT 1. f T T
Vm (2)
V 1. f
Vm (3)
VNR = VNRA + VNR (4)
2.2. Organic carbon dosing
An exogenous organic carbon source was provided as the required amount of available organic carbon was not available in the water from the geotextile bag system. The supplemental organic carbon source, sucrose (C12H22O11), was provided in an 857 mg sucrose L-1 aqueous solution mixed with water from the reactor system reservoir. The sucrose solution was dosed directly into the influent flow of each FBBR at a rate proportional to the influent NOX-N mass flow (NOX-N = NO2-N + NO3-N). The sucrose COD equivalent was determined empirically as 1.12 g COD per g sucrose. The required COD:NO3-N ratio of 2.86 (2.66 for COD:NO2-N) as determined empirically. The NOX-N mass flow was used to determine the COD dose rate because both NO2-N and NO3-N are removed in the
heterotrophic denitrification processes. Dosing was administered using an adjustable positive displacement pump (BL20, Hannah instruments, RI, USA) and was adjusted after each sample was analyzed.
2.3. Water quality sampling
nitrogen (NO2-N), and nitrate-nitrogen (NO3-N). Off-site analysis was performed by the North Carolina State University Center for Applied Aquatic Ecology (CAAE) and the Biological and Agricultural ngineering B department’s nvironmental nalysis Lab (EAL) to determine concentrations of NO3-N, COD, total Kjeldahl nitrogen (TKN), soluble reactive phosphorus (SRP), and total phosphorus (TP).
Samples were collected at the inlets of each FBBR, the outlets of each FBBR, and the outlets of each MBBR. To ensure near-steady state conditions, samples were collected at least 24 hours after a backwash of the FBBRs and at least 7 days after a new batch of wastewater was added to the reservoir. Data collected during the 7-day acclimation period were not used for analysis. True steady state conditions are unattainable in real-world conditions. Additionally, with the entire system essentially operated as a batch reactor, steady state conditions never exist. As such, pseudo-steady state conditions are defined as a suitably representative set of operating conditions that are representative of steady state conditions. Providing a suitable amount of time for the microbial communities to acclimate to new batches of wastewater was important to ensure accurate measurement of constituent removal rates.
2.4. Water quality analysis
method with a standard salinity solution to account for chloride (Cl-) interference with each test and were standardized monthly or as reagents were replaced. The standard salinity solution was made using distilled water and a synthetic seawater mix (Crystal Sea
Marinemix – Reef blend, Marine Enterprises International, MD, USA). On-site results were verified periodically with the Biological and gricultural ngineering B department’s Environmental Analysis Lab (EAL) or the North Carolina State University Center for Applied Aquatic Ecology (CAAE) to insure accuracy and consistency. Alkalinity and pH
measurements were made using a portable pH meter (Model # pH100CC, Yellow Springs Instruments, MA, USA). Alkalinity measurements were performed on site by potentiometric titration to end point pH 4.8 (EPA, 1984). Dissolved oxygen concentrations, salinity, and temperatures were measured using a portable oxygen meter (Model 85, Yellow Springs Instruments, OH, USA).
Water quality samples for both the freshwater and marine systems were analyzed at the Environmental Analysis Laboratory (EAL) at the department of Biological and
Agricultural Engineering for total Kjeldahl nitrogen (TKN), TAN, nitrite-nitrogen (NO2-N), nitrate-nitrogen (NO3-N), and chemical oxygen demand (COD). Samples were analyzed by automated analysis (Bran & Luebbe Digital Autoanalyzer III) for TAN by the salicylate method, NO2-N by the cadmium reduction method, and nitrite-nitrogen plus nitrate-nitrogen (NO2-N + NO3-N) by the copper–cadmium reduction method (EPA, 1984). Chemical oxygen demand (COD) was analyzed by potassium dichromate–sulfuric acid digestion and
combustion TOC analyzer with auto-sampler via oxidation by combustion and IR detection (EPA, 1984).
Soluble reactive phosphorus and total phosphorus analysis was performed by the North Carolina State University Center for Applied Aquatic Ecology. Total phosphorus and soluble reactive phosphorus analyses were performed per Standard Methods (Standard Method 4500 P F (EPA Method 365.1); APHA, 1995).
2.5. Data analysis
Statistical analysis of data was performed using SAS statistical software package (SAS, 2010, NC, USA), to obtain the output needed for inference about the effects of the experimental factors. A significance level of 5% was used for all tests of statistical significance.
3. Results and Discussion
endogenous organic carbon source. Upon operation of the system in parallel it was determined that the amount of biologically available COD was either being consumed too quickly in the aerobic MBBR or was not sufficient to support the denitrification processes as a stand-alone endogenous organic carbon source. As such, the biofilter system design was then switched to operate in series. Water was first directed through the FBBR so as to preferentially select for the denitrification processes by first making the COD available for consumption in the FBBR and the FBBR effluent flowed by gravity and served as the only input into the MBBR. Operation of the system with the new flow regime in series also showed that the biologically available COD was not sufficient to support the denitrification processes. As such, an exogenous organic carbon solution (sucrose; C12H22O11) was dosed directly into the influent flow of the FBBR at a rate proportional to the influent NOX-N (NO2-N + NO3-N) mass flow (as described above). All data presented for this study was collected after beginning the exogenous organic carbon source dosing to the FBBRs. Data for this study was collected for 126 days starting February 24, 2011 and ending June 30, 2011. Samples were collected prior to the period reported in this study, but the addition of an exogenous organic carbon dosing regimen required the exclusion of data collected prior to February 24, 2011. Organic carbon dosing was introduced January 18, 2011 and the systems were given 37 days to acclimate prior to collecting data for this study.
7 days to acclimate to the new water quality conditions in an attempt to allow the microbial communities to attain a pseudo-steady state operating level.
3.1. Summary statistics