A
BSTRACTPATTERSON, JOAN DIANA. Continuous Depolymerization of Poly(ethylene terephthalate) via Reactive Extrusion. (Under the direction of George Roberts and Saad Khan.)
A single-step, extrusion-based process to depolymerize poly(ethylene terephthalate) (PET)
has been investigated. The depolymerization is effected by reacting ethylene glycol (EG)
with the high molecular weight polymer (glycolysis). The ethylene glycol causes chain
scission by attacking the ester linkages along the polymer backbone. The objective is to
recover purified low molecular weight oligomers of bis(hydroxyethyl) terephthalate (BHET)
for repolymerization. A key feature of this process is that it employs the use of a twin-screw
extruder as a reactor. The twin-screw extruder conveys the polymer and continuously creates
a fresh surface area that facilitates penetration of the depolymerizing agent into the polymer.
This research could play a role in reducing the considerable amount of bottle-grade PET resin
that is manufactured from virgin materials, resulting in a significant environmental and
economic impact.
Results of glycolysis experiments on a Leistritz 34 mm counter-rotating twin-screw extruder
have been characterized by substantially faster depolymerization rates than typical batch
glycolysis reactions, shortening reaction times from hours to minutes. Oligomers with
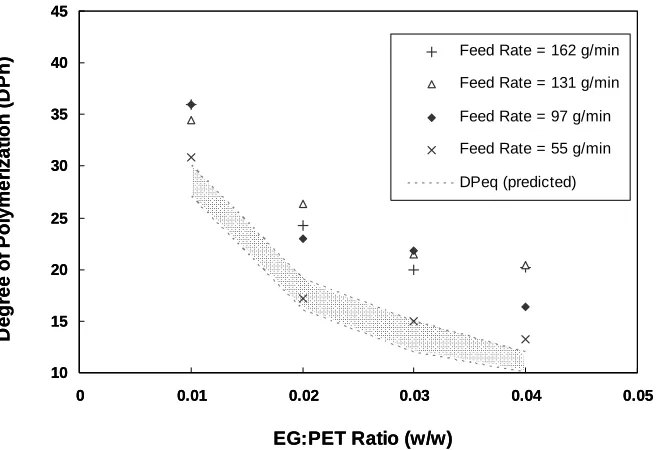
number-average degrees of polymerization (DPn) as low as 13 (Mn = 2,500) can be produced
continuously from the starting bottle-grade PET resin (DPn = 102 and Mn = 20,000) in
residence times of just 10 minutes. By changing operating conditions, e.g. feed rate and
EG:PET ratio, the DPn of the final product can be controlled at essentially atmospheric
C
ONTINUOUSD
EPOLYMERIZATION OFP
OLY(
ETHYLENE TEREPHTHALATE)
VIAR
EACTIVEE
XTRUSIONby
JOAN DIANA PATTERSON
A dissertation submitted to the Graduate Faculty of North Carolina State University
in partial fulfillment of the requirements for the Degree of
Doctor of Philosophy
CHEMICAL ENGINEERING
Raleigh, NC
March 28th, 2007
APPROVED BY:
_________________________ _________________________
C. Maurice Balik Juan Hinestroza
__________________________ _________________________
George Roberts Saad Khan
ii
D
EDICATIONThis work is dedicated to the most important people in my life: my family. Thanks to my
mom Julia, my dad Bob, my sister Kristi and my brother Jack for all of their love,
iii
B
IOGRAPHYJoan Diana Patterson was born on November 15, 1978 in Roanoke, VA. She grew up on a
beautiful farm in Fincastle, VA where she lived with her parents, sister and brother. She
attended Lord Botetourt High School in Daleville, VA and the Roanoke Valley Governer’s
School for Science and Technology in Roanoke, VA. She graduated as valedictorian from
Lord Botetourt in the spring of 1996. That same spring, she was awarded a
Beneficial-Hodson scholarship to attend the Johns Hopkins University in the fall.
While at Johns Hopkins, she was an undergraduate assistant in the lab of Dr. Mark McHugh.
She was chosen for an NSF internship at the IBM Almaden Research Center in San Jose, CA
in the Summer of 1999. She graduated with honors in May 2000 with a B.S. in Chemical
Engineering and a minor in Hispanic & Italian Studies.
After graduation, she decided to continue her education by pursuing a Ph.D. in Chemical
Engineering. She accepted the offer to enroll at North Carolina State University and joined
the department in August 2001. That fall, she chose a research project under the advisement
of Dr. George Roberts and Dr. Saad Khan. In the Spring of 2002, she was named a National
Science Foundation Graduate Research Fellow. In her time at North Carolina State, she was
very active in the department, serving as a Graduate Student Association (GSA) officer and
as a Recruiting Captain for the department. After graduation, she will pursue a career in
iv
A
CKNOWLEDGMENTSI would like to first acknowledge my advisors, Dr. George Roberts and Dr. Saad Khan.
Thank you for your limitless support and patience through all of the ups and downs of this
project. It has been an honor to work under your guidance. Thanks also to my committee for
their time and helpful suggestions. I would like to acknowledge the funding that made this
research possible: a Graduate Research Fellowship from the NSF, Grant # CTS-0124618
from the NSF and additional support from the Kenan Center for the Utilization of CO2 in
Manufacturing and the NSF Science and Technology Center for Environmentally
Responsible Solvents and Processes. I am also grateful to the College of Textiles for
laboratory space, to Voridian for material donations and to Stuart Kapp and Frank Eisenhauer
at Leistritz for their technical support.
I’d like to thank a few people without whom this research would not have been possible. The
first is Kit Yeung, master handyman, for taking so much time to help me with seemingly
impossible extruder repairs. Not only was your help invaluable, but I have also enjoyed your
company and friendship over the years. I’d also like to thank Hai Bui in the Textiles
machine shop for always going out of his way to help me and somehow never groaning upon
seeing me walk through the door! Finally, I’d like to thank the Textiles 1102 lab managers
Chad Graham and Tim Mumford for also going beyond their job duties to give me a hand
v I’d like to thank my fellow group members in both the Roberts and Khan groups and also the
members of the CO2 Center for their willingness to help whenever asked – to answer
questions, discuss theories, set up equipment, etc.— and for creating a supportive research
environment. I’d also like to acknowledge the efforts of all of the undergraduate students
who have worked with me on this project over the years. I’d like to thank all of the members
of the Chemical Engineering Department for collectively making our department such a
warm place. I knew right away from my initial visit that this was the place for me and I
never once doubted my choice in coming here.
There are, of course, some special members of the department who deserve recognition. I’d
like to thank my first-year class for making that year such a positive experience. I’d
especially like to thank Angelica, Brian and Paul for being such good friends, both that year
and for all of the years that followed. Angelica (Fab), you are the most terrific friend anyone
could have – grad school, and life as I know it, would never have been the same without you.
Brian, thanks for always being such a good person and friend – I’ll say again how wrong my
first impression of you was! Paul, I lucked out in ending up with you as a roommate and
having you as a homework partner, a group member, a fellow volleyballer and a reliable,
thoughtful friend. Thanks also to those friends not in my year, but no less important: to Jim
and Jeff, for allowing me into your “elitist” circle of friends and for making my first few
years feel like home – I miss you guys!; to Omon, for being such good company, for being so
patient and caring, especially during these very stressful last days, and for making my last
vi listen and for always making me laugh. Thanks also to Srini, Mimmo, Julie, Nathan, Shaun,
Alan, Vinnie, Josh, JB, Sachin, Carl, Evren, Omer and many others. Sharing the graduate
school experience with all of you – great friends and fun, wonderful people– has been an
exceptional privilege.
Sports have always been a big part of my life, both for the physical and mental rewards.
Having these activities outside of school kept me happy, balanced and productive and I’d like
to express my gratitude to all those who made that possible. A special thanks goes out to the
Jaycee volleyball crew – too many to name – for countless Saturdays spent in your company,
not to mention some Wednesday evenings, various leagues and social outings. Being a part
of this group was a great source of stress relief, constancy and happiness for me every week!
I would also like to thank my volleyball team at the Cary YMCA, members (and friends) past
and present: Chuck, Jeff, Jim, Tom, Bob, Todd, Lance, Shawn and Jean. I was so lucky to
find a team like this to be a part of and frankly, I am lost on Thursday nights that I don’t join
you at the Y! Thank you for always making it a night I looked forward to, and for playing
with skill, humor and humility. Another thank-you goes out to my dodgeball team – Pimps
past and present: Sam, Jen, Courtney, Travis, Paul, Vinnie, Matt, Angelica, the Erins.
Playing this sport was a blast and it was all the much more fun having you there to share it
with! Thanks also to my various racquetball and running partners over the years – Aysa,
vii I’d like to thank a special family in Raleigh that has been very loving and supportive: the
van Zantens. Thanks to all of you, Dr. vZ, Heidi, Eli, Avi, Zev and little Ori, for welcoming
me into your terrific family. Thanks to Dr. vZ for all of the professional support and advice,
thanks to Heidi for her thoughtfulness and for the delicious home-cooked meals, thanks to
the guys for fun weekend nights hanging out watching movies and eating popcorn and
M&Ms, thanks for everything else that you all have done for me and just generally for being
such great people.
One final thanks goes out to my own family, Bob, Julia, Kristi and Jack. I could never say
enough how much you all mean to me and how much stronger I am having you there to
viii
T
ABLE OFC
ONTENTSL
IST OFT
ABLES... xL
IST OFF
IGURES... xi1.
PET
R
ECYCLING...11.1BACKGROUND...1
1.2RESEARCH INTRODUCTION...2
1.3REFERENCES...4
2.
PET
DEPOLYMERIZATIONC
HEMISTRY...52.1INTRODUCTION...5
2.2HYDROLYSIS...9
2.3METHANOLYSIS...14
2.4GLYCOLYSIS...15
2.4.1BATCH GLYCOLYSIS...16
2.4.2CONTINUOUS GLYCOLYSIS...22
2.5REFERENCES...23
3.
T
HEE
QUILIBRIUM OFPET
M
ELTG
LYCOLYSIS...273.1INTRODUCTION...27
3.2POLYCONDENSATION EQUILIBRIUM...28
3.3EXPERIMENTAL PROCEDURE...31
3.3.1MATERIALS...31
3.3.2METHOD...31
3.3.3PRODUCT ANALYSIS...32
3.4RESULTS AND DISCUSSION...33
3.5CONCLUSIONS...41
3.6REFERENCES...41
4.
E
XTRUDERC
HARACTERIZATION...434.1INTRODUCTION...43
4.2TWIN-SCREW EXTRUSION SYSTEM...44
4.2.1SCREW CONFIGURATION...46
4.2.2DIE MODIFICATION...47
4.3MASS FLOW RATES AND RESIDENCE TIME...49
4.4RESIDENCE TIME DISTRIBUTION...54
ix
5.
C
ONTINUOUSG
LYCOLYSIS OFPET
VIAR
EACTIVEE
XTRUSION...595.1INTRODUCTION...59
5.2EXPERIMENTAL PROCEDURE...60
5.2.1MATERIALS...60
5.2.2EXTRUDER OPERATION...60
5.2.3SAMPLE ANALYSIS...61
5.2.4PETCHARACTERIZATION...61
5.3RESULTS AND DISCUSSION...62
5.4CONCLUSIONS...70
5.5REFERENCES...71
6.
C
ONCLUSIONS ANDF
UTURED
IRECTIONS...726.1CONCLUSIONS...72
6.2FUTURE DIRECTIONS...74
A
PPENDIX...76A.1OPERATING PROCEDURE FOR BATCH GLYCOLYSIS EXPERIMENTS...77
A.2SAMPLE CALCULATION OF KDEP ...81
A.3DERIVATION OF EQUATION 3.7...83
A.4DERIVATION OF EQUATION 3.10...85
A.5ESTIMATING THE SOLUBILITY OF EG IN BHETUSING ASPEN...87
A.6OPERATING PROCEDURE FOR TWIN-SCREW EXTRUSION SYSTEM...89
A.7OPERATING PROCEDURE FOR RHEOTEK RPV-1POLYMER VISCOMETER..96
A.8DSC&MELT RHEOLOGY OF PET AND OLIGOMERS...100
A.9SAMPLE CALCULATION OF PREDICTED EQUILIBRIUM DP...102
A.10DEPOLYMERIZATION OF POST-CONSUMER PET IN TSE VIA GLYCOLYSIS...103
x
L
IST OFT
ABLESTABLE 3.1 Equilibrium constant, Kdep, at varying EG:PET ratios(w/w)
and temperatures ...36
TABLE 4.1 Recorded values of residence time with PS, T = 200°C, TSE
speed = 150 rpm...52
TABLE 5.1 Addition ofscCO2 at 260°C, 100 g/min PET. ...64
TABLE 5.2 Influence of temperature on glycolysis, EG:PET = 0.04
xi
L
IST OFF
IGURESFIGURE 2.1 Schematic of the PET hydrolysis reaction ...5
FIGURE 2.2 Schematic of the PET methanolysis reaction...6
FIGURE 2.3 Schematic of the PET glycolysis reaction ...6
FIGURE 2.4 Schematic of bottle-grade PET synthesis steps ...8
FIGURE 2.5 Schematic of PET production with recycling via glycolysis. ...9
FIGURE 3.1 Batch glycolysis of PET at 260°C, EG:PET=1:1 (w/w). ...35
FIGURE 3.2 Batch glycolysis of PET at 260°C, EG:PET=0.67:1 (w/w). ...35
FIGURE 3.3 Batch glycolysis of PET at 260°C, EG:PET=0.5:1 (w/w). ...36
FIGURE 3.4 Predicted distribution of BHET oligomers at equilibrium at 260°C, Kdep = 1.0...40
FIGURE 4.1 Schematic of Twin-screw Extrusion System. ... 44
FIGURE 4.2 Leistritz 34 mm TSE Screw Configuration. ...47
FIGURE 4.3 Original die configuration for Leistritz 34 mm TSE. ...48
FIGURE 4.4 Schematic of TSE die modification with valve. ...49
xii
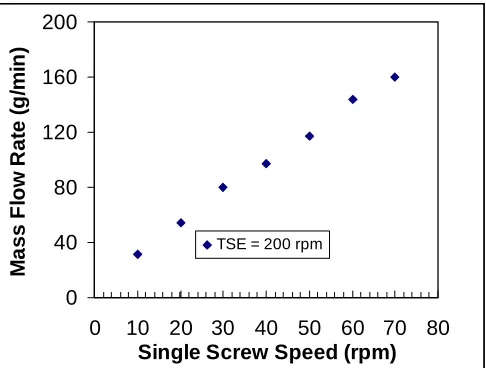
FIGURE 4.6 Dependence of throughput on feed rate for GPPS at 200°C... 51
FIGURE 4.7 Average residence time in TSE System for GPPS at 200°C. ...52
FIGURE 4.8 Extruder Throughput for Voridian CB12 PET at 260°C. ...53
FIGURE 4.9 Dependence of throughput on feed rate for Voridian CB12 at 260°C. ...53
FIGURE 4.10 Variance versus throughput for PP at 210°C, TSE = 200 rpm. ...55
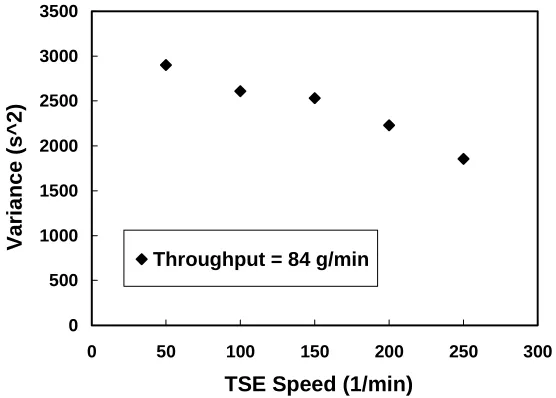
FIGURE 4.11 Variance vs. TSE speed for PP at 210°C at a throughput of 84 g/min. ...56
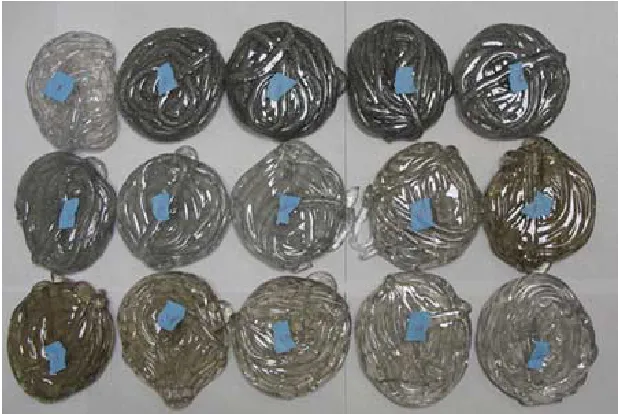
FIGURE 4.12 PS extrudate samples collected over time after 1 g Al flake pulse. ...57
FIGURE 5.1 Glycolytic extrusion of PET over time, T=260°C, P=1 atm...62
FIGURE 5.2 Effect of varying feed rate and EG:PET ratio on glycolysis at 260°C,1 atm. ...63
FIGURE 5.3 Varying PET feed rate at 260°C, EG:PET = 0.01 (w/w), 1 atm. ...65
FIGURE 5.4 Influence of TSE Speed on Glycolysis at 260°C, 1 atm. ...66
FIGURE 5.5 Sensitivity of DPeq to Kdep for EG:PET = 0.04 (w/w) feed. ...68
1
C
HAPTER1
PET
R
ECYCLING1.1BACKGROUND
Since its discovery in the early 1940s, poly(ethylene terephthalate) (PET) has seen a fast rise
in popularity among plastics. In the year 2000, world PET production capacity amounted to
more than 66 billion pounds/year.1 While the largest end use of PET still goes toward making fibers, the second largest market is for bottle-grade resin. Production of bottle-grade PET
worldwide exceeded 17.4 billion pounds/year in the year 2000. Demand for bottle-grade
PET has grown steadily at 7-8% annually2, 3 as applications broaden from water and soda bottles to beer, milk, wine and other specialty containers.4, 5As consumption of PET bottles continues to rise, the extent to which this plastic is recyclable becomes a key issue.
The first patents dealing with the chemical recycling of PET date back to the 1950s. PET is
generally considered one of the easiest plastics to recycle. A typical 2-liter soft drink bottle
consists of 1 g of polyethylene (PE), 5 g of label material (+ glue), and 60 g of PET, making
the separation of components fairly straightforward (washing removes the glue and label
while PE is separated from PET based on density differences). In fact, PET has one of the
highest scrap values for recycled materials, second only to aluminum.6 However, when
examining the recycled PET market for bottles in the United States, a discrepancy arises.
2 billion pounds of PET bottles were available in the U.S. for recycling in 2005.5 Of that amount, a mere 2.3% was recycled back into food and beverage containers. This clearly
demonstrates the need for larger-scale recycling of PET into such high-value applications.
As described in guidelines put forth by the FDA, traditional PET recycling falls under three
main categories.7 The primary means is an in-house recycling in which scrap PET from certain processes is redirected to other product lines. The secondary means is a physical
reprocessing that involves washing, grinding, melting and reforming of post-consumer PET.
It is by this means that the majority of PET is recycled, into sheet, fiber and strapping. The
tertiary means is via a chemical recycling wherein PET is broken down into its originating
monomers or oligomers which are then purified for repolymerization. Generally, in order to
meet strict FDA regulations, processes for recycling PET for end-use in food or beverage
containers must involve a chemical recycling step.
1.2RESEARCH INTRODUCTION
This study investigates a single-step, extrusion-based process to depolymerize poly(ethylene
terephthalate) (PET) and recover low-molecular-weight oligomers for repolymerization. A
key feature of this process is that it employs the use of a twin-screw extruder as a reactor.
The twin-screw can convey the polymer and continuously create a fresh surface area that
facilitates penetration of the depolymerizing agent into the polymer. This research could
3 manufactured from virgin materials, resulting in a significant environmental and economic
impact.
A review of scientific literature presented in Chapter 2 reveals that traditional
depolymerization methods are far from ideal. They suffer from drawbacks including slow
reaction rates, inability to run continuously and inefficiency in terms of yield and separation
of depolymerization products. Furthermore, the kinetics and the equilibrium of the
depolymerization reactions are not fully understood. In Chapter 3, we present a review of
previous work dealing with the equilibrium of the PET polycondensation reaction, along with
the results of our own experimental study on the equilibrium of melt glycolysis. In Chapter
4, we present a brief introduction to reactive extrusion as it applies to this research and
discuss characterization of the twin-screw extruder as a reactor. In Chapter 5, we present the
results of PET glycolysis in the twin-screw extruder and discuss the process parameters that
affect the extent of depolymerization.
This project sought to address several issues in order to fully understand the reaction system.
In particular, we sought answers to the following questions:
• What is the equilibrium constant for the melt glycolysis of PET?
• How does the extruder perform as a depolymerization reactor?
• What are the process parameters that influence the kinetics of this reaction?
4
1.3REFERENCES
1. Rieckmann, T., Poly (Ethylene Terephathalate) Polymerization - Mechanism, Catalysis, Kinetics, Mass Transfer and Reactor Design, in Modern Polyesters: Chemistry and Technology of Polyesters and Copolyesters., J. Scheirs, T. E. Long, Editor. 2003, John Wiley & Sons, Ltd: New York.
2. Lerner, I., Too much PET may lower prices. Chemical Market Reporter, (2006) p. 22-23.
3. Hoffman, J., PET demand to stay strong in 2005. Chemical Market Reporter, (2005) p. 26.
4. Hoffman, J., PET and Polyester Markets Face Challenges Despite High Long-Term Growth. Chemical Market Reporter, (2003) p. 6.
5. 2005 Report on Post Consumer PET Container Recycling Activity. National Association for PET Container Resources (NAPCOR): Sonoma, California, 2006.
6. Scheirs, J., Polymer Recycling: Science, Technology and Applications. John Wiley & Sons: New York,1998.
5
C
HAPTER2
PET
D
EPOLYMERIZATIONC
HEMISTRY2.1INTRODUCTION
The chemical recycling of PET involves a partial to full depolymerization. The synthesis of
PET is a reversible polycondensation. Therefore, addition of a condensation product to the
polymer pushes the reaction in the reverse direction, favoring the formation of monomers and
low-molecular-weight oligomers. Traditional depolymerization methods used for the
chemical recycling of PET are hydrolysis, methanolysis and glycolysis wherein water,
methanol and ethylene glycol, respectively, are the condensation products added to effect
depolymerization.
In the hydrolysis reaction, shown in Figure 2.1, PET is reacted with water to produce
terephthalic acid (TPA) and ethylene glycol (EG).
6 By a similar mechanism, methanolysis involves reacting PET with methanol to yield
dimethyl terephthalate (DMT) and EG (Figure 2.2).
The glycolysis reaction (Figure 2.3) results in the formation of bis(hydroxyethyl)
terephthalate (BHET) and EG when PET is reacted with EG.
FIGURE 2.2 Schematic of the PET methanolysis reaction.
7 The reaction mechanism for PET depolymerization consists of three reversible reactions.1 The first step is a rapid protonation of the carbonyl carbon in the polymer chain wherein the
carbonyl oxygen is converted to a second hydroxyl group. In the second step, the hydroxyl
oxygen of the added hydroxyl-bearing molecule (i.e. water, methanol or ethylene glycol)
slowly attacks the protonated carboxyl carbon atom. The last step is a rapid removal of the
carbonyl oxygen (now a hydroxyl group) and a proton to form water or a simple alcohol and
the catalytic proton. Because the second step is the slow step, the rate of depolymerization
will vary based on how fast the depolymerizing agent can attack the carboxyl carbon after
protonation.
Comparing the three depolymerizing agents, both methanol and ethylene glycol are weaker
acids than water, with acid dissociation constant (pKa) values of 15.5 and 14.24,2
respectively, compared to a pKw for water of 14.0 (at 25°C).3 The order of nucleophilicity is
inversely proportional to the strength of the acid, suggesting that of the three depolymerizing
agents, water is the weakest nucleophile. Indeed, the hydrolysis reaction is slow in
comparison to methanolysis and glycolysis. A further drawback to hydrolysis is that
recovery of the TPA monomer typically requires many steps in order to reach the required
purity. Depolymerization done via methanolysis also involves a costly separation and
purification of monomers, rendering the process uneconomical. Glycolysis typically yields
an end product that contains other higher oligomers in addition to BHET monomer, making it
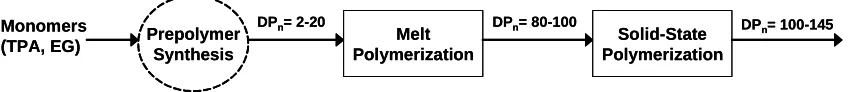
8 A typical PET synthesis involves two steps4 and a schematic of the process is shown in Figure 2.4. In the first step, BHET oligomer is synthesized in an esterification reaction for
use as a prepolymer in subsequent melt polymerization. The starting monomers can be either
TPA and EG or DMT and EG, although due to increasing costs of DMT over TPA, PET
synthesis using TPA has become almost the sole commercial means. The prepolymer made
in the first step can have a degree of polymerization (DP) anywhere from 2-20.5, 6 The second step is the melt condensation polymerization of the BHET oligomer (which regenerates EG)
and yields a product with a DP around 80-100. The molecular weight of the product from
step 2 can be increased further by adding an additional solid-state polymerization step to
obtain PET with a DP anywhere from 100-145.5, 7 This final step is necessary to produce a bottle-grade PET resin.
The objective of this project is to obtain a reaction product that can be repolymerized by
conventional methods. Therefore, we will concentrate specifically on the glycolysis of
PET, allowing production of BHET oligomers, or prepolymer, to be targeted directly. As
shown in Figure 2.5, this product can be fed directly to the melt polymerization step for
repolymerization, thereby producing a bottle-grade material from post-consumer materials.
Solid-State Polymerization Monomers
(TPA, EG) PrepolymerSynthesis
DPn= 100-145
Melt Polymerization
DPn= 80-100
DPn= 2-20
Solid-State Polymerization Monomers
(TPA, EG) PrepolymerSynthesis
DPn= 100-145
Melt Polymerization
DPn= 80-100
DPn= 2-20
9
2.2HYDROLYSIS
Although hydrolysis is of less interest commercially due to long reaction times, high
pressures and temperatures used and the high cost of purifying the reaction product, some of
the earliest studies of PET depolymerization are in this area. Consequently, more in-depth
analyses of this reaction have been carried out relative to methanolysis and glycolysis.
Several kinetic studies have been done on hydrolysis of PET in the melt, the focus of this
section, which better relate to reaction in an extruder than solution depolymerization. In the Solid-State Polymerization D e gr ee of Pol y mer iz a ti on ( D Pn ) Monomer Prepolymer Synthesis Glycolysis 100-145 2-20 1 PET Production Melt Polymerization 80-100 Solid-State Polymerization D e gr ee of Pol y mer iz a ti on ( D Pn ) Monomer Prepolymer Synthesis Glycolysis 100-145 2-20 1 PET Production Melt Polymerization 80-100
10 melt system, the PET is in a molten state and is in contact with water (or other condensation
product being used to effect depolymerization). In a solution system, solid PET is suspended
in the water (or other depolymerizing agent), typically in the form of pellets, chips, flakes, or
powder.
Campanelli et al.8 authored one of the earliest kinetic studies of batch hydrolytic depolymerization of PET in the melt. Prior studies9, 10 by other researchers done at
temperatures below the melting temperature of PET showed much lower reaction rate
constants. Although lower rate constants would be expected at lower temperatures,
Campanelli et al.8 speculated that the reaction at such conditions was also limited by mass transfer (diffusion of the depolymerizing agent into the polymer). To confirm, they used the
Arrhenius equation to extrapolate values of the rate constant calculated from their work in the
melt to such low temperatures as those used in solution hydrolysis. The rate constants they
calculated in this manner were orders of magnitude greater than those that were measured
experimentally in the previous studies. This result supported the hypothesis that reaction
rates in solution are dominated by mass transfer limitations and clearly demonstrated an
advantage of performing hydrolysis in the melt-phase.
By varying the reaction temperature, Campanelli et al.8 concluded that the initial rate
constant (i.e. the rate constant at short reaction times, less than 10 minutes) increased with
increasing temperature. The extent of reaction decreased as the water:PET ratio was
11 This was done by charging the batch reactor with known quantities of reactants, allowing the
reaction to reach equilibrium and analyzing the remaining amounts of reactant and product.
The value of the equilibrium constant was very sensitive to temperature, dropping from 1.43
at 250°C to 0.384 at 280°C. This behavior suggests that the reaction is exothermic, although
the heat of reaction is not mentioned. The activation energy for the hydrolysis was calculated
to be 55.7 kJ/mol.
Campanelli et al.8 coupled the experimental studies on hydrolysis with an attempt to model
the melt hydrolysis reaction. The rate equation for the appearance of carboxylic acid groups
(corresponding to the product) was written as follows:
OH COOH WATER
EL COOH
COOH dC dt kC C k C C
r = = − ' (2.1)
where CEL refers to the concentration of ester linkages in the polymer at any time, CWATER the
concentration of liquid water, CCOOH the concentration of carboxyl groups, and COH the
concentration of hydroxyl groups (all concentrations in mol/g of PET). The symbols k and k’
refer to the forward and reverse rate constants, respectively. The value of CWATER was
calculated using vapor-liquid equilibrium data and assuming that the only contributions to the
reactor pressure were due to saturated water vapor and air. This value was assumed to be
constant throughout the reaction due to the large excess of water used. Campanelli et al.,
neglecting the reverse reaction, obtained a good fit of the experimental data to Equation (2.2)
12 kinetics were assumed. The subscript 0 in the equation signifies the initial concentration at
time t = 0.
(
)
[
CCOOH −CCOOHo CELo −CCOOHo]
=(
kCWATER)
⋅tln (2.2)
A later study by Kao et al.11 found that the conversions of PET melt hydrolysis reached high
values, close to complete depolymerization, even at reaction times of just 10 minutes at
265°C. This suggests that the concentration of the products in the system was considerable
even at short times and therefore no longer negligible. The researchers concluded that the
reverse reaction had to be considered in the rate equation regardless of reaction time.
Campanelli et al.8 concurred that the reverse reaction would ultimately determine the
equilibrium in the complete hydrolysis reaction, and derived the following model (in final
form) for the melt hydrolysis using Equation (2.1) as a starting point:
B A C B A C t k k B B A C B A C COOH COOH COOH COOH + + − + + − − = + + − + 0 0 ln ) ' ( 2
ln (2.3)
where, ) ' ( 2 / ) ( 0
0 C k k
C k
A= EL + WATER − (2.4)
(
)
(
)
2 1 2 2 2 ' ' 4 0 0 0 0 − + − + = k k C kC k k C C k13
This model provided good agreement with their experimental results (obtained at 265°C for
reaction times up to one hour) and was also fairly successful at providing an estimate of the
equilibrium carboxyl group concentration. They found effectively complete hydrolysis at a
water:PET ratio of 5:1 (w/w) or greater with a reaction time of at least 60 minutes. At charge
ratios below that amount, the reaction reached equilibrium before complete conversion was
attained.
In an additional study, Campanelli et. al12 investigated the influence of addition of catalysts
on the rate of melt hydrolysis. Both zinc stearate and zinc acetate were studied at
concentrations equal to or greater than 1.58 x 10⁻³ mmol Zn2+/g PET. They found that the
addition of catalyst resulted in a modest increase of the reaction rate, with values of the rate
constant that were 20% greater than their previous results for the same system.
Kao et al.11 investigated several reaction parameters in the melt system that Campanelli’s
group did not, including a study of the influence of mass transfer in the system. This was
done by determining the effect of agitation speed (varied between 50-600 rpm) on the extent
of the PET hydrolysis after 10 minutes at 250°C. It was found that at agitation rates below
400 rpm, the reaction extent increased with the agitation speed. Above 400 rpm, there was no
variation, indicating that there was a mass transfer limitation that could be removed at high
agitation rates. This could be one reason that Kao’s reaction times are so much lower than
Campanelli’s for the same system, as Campanelli makes no mention of the agitation speed in
14 Kao also examined the effect of using different PET resins on the extent of reaction. The
results showed minimal difference between fresh PET chips and recycled flakes if both were
clear (IV=0.54 and 0.80 dl/g, respectively). However, recycled flakes that were green
(IV=0.70 dl/g) showed lower extents of reaction. This indicated that the shape and molecular
weight of the PET resin did not influence the hydrolytic reaction in the melt state at high
temperature, but that perhaps additives in the green PET affected the conversion.
There is one study of hydrolytic depolymerization in an extruder performed by Yalçinyuva et
al.13 that relates closely to this work. Although this research will be reviewed in more depth
in Chapter 5, the researchers report that oligomers with an average Mn of 325 (essentially
complete hydrolysis) were produced at 4757 kN/m2 (about 700 psi), their highest operating
pressure, 300°C, their highest operating temperature, and a residence time of about 3
minutes.
2.3METHANOLYSIS
As mentioned previously, traditional depolymerization products of PET methanolysis are
DMT and EG. Because almost all current PET production facilities use a TPA-based
synthesis, the methanolysis of PET has become obsolete due to lack of usefulness of
recovering the DMT monomer. Consequently, the literature does not contain many detailed
analyses of the kinetics of the methanolysis reaction. Although methanolysis has been
15 for these reactions are the parameters investigated by different groups. In their studies of
methanolysis, Goto et al.14, 15 used a batch reactor operated at high temperatures and
pressures (573-623K and 20MPa) at which methanol is in the supercritical state and PET is
in a molten state. They found that higher temperatures increased the initial rates of reaction
but at longer times, operation at higher temperatures increased the yield of products from
undesired side reactions. This brought into question the ease of separation of the desired
product.
Another study of supercritical methanolysis (at temperatures from 523-543 K where PET is
in a molten state and pressures from 8.5-14.0 MPa) in a batch reactor by Yang et al.16
interestingly revealed that increasing the temperature increased the rate of the reaction at
short times but that in order to approach 100% conversion, the reaction still had to proceed
for at least 40 minutes at any temperature. Above the critical pressure of methanol, no
influence of any further increase in pressure on the depolymerization degree was observed.
This group also investigated different sources of PET including green and transparent bottles
and waste fiber and found no significant difference in the degree of PET depolymerization
among them, reaching greater than 96% depolymerization for each source.
2.4GLYCOLYSIS
Research on the glycolysis of PET in the literature dates back to 1960 and involves early
16
These efforts were undertaken primarily by Challa17-19 and were followed up on by
Stevenson and Nettleton20 and Fontana.21 Although these works deserve mention here, they
are not targeted at recovering BHET or oligomers and contain only a brief mention of the
kinetics of the reverse reaction. They will be covered in more detail in Chapter 3 with a
discussion of the equilibrium of melt glycolysis. In this section, we will review glycolysis
studies in the scientific literature aimed at depolymerization and select works from patent
literature that have high relevance.
2.4.1 BATCH GLYCOLYSIS
Of the studies that investigate the glycolysis of PET, the majority are carried out using batch
reactors. There are 2 distinct systems; those that employ temperatures below the melting
point of PET and at or above the boiling point of EG, or solution glycolysis, and those that
investigate the glycolysis of PET in the melt, or melt glycolysis.
Solution glycolysis is carried out at temperatures ranging from 190°C-245°C. In such
systems, PET flakes, typically, are suspended in medium of ethylene glycol alone or mixed
with another solvent, creating a two-phase reaction system. Once the reaction reaches a high
conversion, the low-molecular weight oligomers (DP=2-4) are soluble in the heated ethylene
glycol. Typical reaction times in these systems range from 60-90 minutes or longer to
17 Studies on solution glycolysis date from the 1980s, although there are patents that deal with
this type of glycolysis dating from the 1970s. From 1987-1989, Vaidya and Nadkarni22-24
published several works dealing with the synthesis of polyester polyols from PET waste. In
order to obtain starting materials with which to conduct the synthesis, they first
depolymerized waste PET using propylene glycol and ethylene glycol. In their studies, they
conducted the glycolysis reaction at 200°C for 8 hours using large excesses of PG/EG (up to
62.5:37.5 EG:PET by weight) in the presence of a zinc acetate catalyst. They were able
achieve nearly complete depolymerization to BHET monomer under these conditions. In
1989, Baliga and Wong25 published a study on the glycolysis of post-consumer PET bottle
chips. They observed that equilibrium between the BHET monomer and dimer was reached
after allowing the system to react for 8 hours at 190°C with an excess of EG, also in the
presence of a metal acetate catalyst. At equilibrium, they found that only 25% of the initial
EG was consumed from an initial EG:PET weight ratio of 43.8:56.2. By testing zinc, lead,
manganese and cobalt acetates they concluded that the type of catalyst affected the initial rate
of the reaction but not the final equilibrium attained. When testing the glycolysis of green
bottle chips, they saw no difference in the extent of depolymerization as compared to clear
chips.
In the 1990s, more studies using batch reactors in the same temperature range were
conducted. Researchers were able to get reaction times down from 8 hours to 2-3 hours for
the same extents of conversion.26-28 Chen et al.26 found that without catalyst in the system,
18 however, the PET flakes disappeared after 2 hours and the reaction mixture became
one-phase.
There has been a large increase in the number of glycolysis studies since the year 2000. In
general, these works have searched for optimum conditions under which to carry out the
reaction, investigating variables such as temperature, reaction time, particle size, and reaction
catalyst.
Chen29 studied the glycolysis of post-consumer PET soft-drink bottles at 190°C and found
that the optimal reaction conditions for producing predominantly BHET monomer and dimer
were reaction times of 1.5 hours using manganese acetate as a catalyst. Xi et al.30 studied
the glycolysis of PET waste bottles at 196°C. In order to obtain 85.6% yield of BHET, their
optimal operating conditions were reaction times of 3 hours in the presence of zinc acetate
catalyst. Mishra and Goje31, 32 investigated the glycolysis of PET scrap at 197°C and found
optimal reaction times of 90 minutes for close to 99% PET conversion, using zinc acetate
catalyst.
Other groups investigated the effect of using non-traditional catalysts in the reaction system.
Shukla and Kulkarni33 found that qualitative and quantitative yields of BHET monomer using
alkali catalysts for the glycolysis reaction were equivalent to those obtained using
conventional heavy metal catalysts like zinc and lead acetates, which are known to have
19 catalyst with a novel titanium (IV)-phosphate catalyst. They saw improvement of reaction
rates using the titanium (IV)-phosphate catalyst when depolymerizing fiber-grade PET (Mw =
30,000), but no distinction between the two when depolymerizing bottle-grade PET (Mw =
51,000).
Still other groups performed glycolysis of PET in order to collect the depolymerization
products for use in other applications. Grzebieniak and Wesolowski35 recovered oligomers
to use in the synthesis of co-polyesters of ethylene terephthalate and L-lactic acid. Pimpan
et al.36 and Öztürk and Güçlü37 were both interested in using glycolyzed products to
synthesize unsaturated polyester resins.
Although some researchers were pushing for new advancements in the field, still others were
stuck at the same old conclusions. For example, in a 2005 study on batch glycolysis of PET
fibers in solution,38 the research team concluded that a minimum reaction time of 8 hours was
needed to achieve a conversion close to 85%.
One interesting feature of the publication by Mishra and Goje31 is that they address mass
transfer effects in the system by studying the influence of particle size on the glycolysis rate.
PET waste powder was used with particle sizes ranging from 50 to 512 µm. At particle sizes
smaller than 150 µm, there was no effect on the glycolysis rate or rate constant. Beyond 150
µm, the rates dropped substantially with an increase in particle size. This result indicates that
20 Mass transfer concerns are not eliminated entirely when moving to a melt system.
Campanelli et al.39 conducted the only literature study of glycolysis of PET in the melt state,
published in 1994. Using a batch reactor at temperatures above 245°C, they performed
glycolysis experiments at reaction times up to 11 minutes, reaching conversions close to
50%. The rate constants they calculate for the initial reaction rate are similar to those found
by other researchers using a two-phase system. They claim that the reactor is equipped with
rotors to ensure proper mixing but do not mention the agitation rate, shown to be important in
a melt system by Kao et al.11 in their studies on PET hydrolysis. While Campanelli’s study
of melt hydrolysis8 was thorough enough to show advantages over solution hydrolysis, this
study does not tackle that issue. They do, however, present a kinetic model for the system.
While the reverse reaction is neglected in their analysis, pseudo first-order kinetics are not
assumed in the following model for glycolysis:
[ ]
EG dt d[
EDE]
dt k[ ][
EG EDE]
d =− = G (2.6)
where [EG] is the concentration of ethylene glycol, [EDE] is the concentration of ethylene
diester groups and kG is the glycolysis rate constant. Although Challa17 originally found the
glycolysis rate to have a linear dependence on the EG concentration, it has since been
proposed that the glycolysis reaction may see some auto-catalytic effect by ethylene glycol in
21 that better fits to literature data are obtained using an equation that is first-order in [EG],
shown in Equation (2.6).
Thus, by writing a component balance for liquid EG and stoichiometrically relating the
amount of EG reacted to the amount of EDE groups remaining in the PET, the following
equation can be found:
[
EDE]
dt k[
EDE][
(
EDE]
A)
d = G +
− (2.7)
where the constant A is defined as A=[EG]0 – [EDE]0 , and the subscript 0 refers to the
concentration that is initially present in the system at time zero. Solution of Equation (2.7)
with integration limits of 0 and t for time and [EDE]0 and [EDE] for concentration of EDE
groups yields the following:
(
)
k t XA 1− = G
1 ln 1
(2.8)
[
] [
]
(
)
[
EDE] [
(
EDE]
A)
EDE EDE
A X
+ − =
0 0
(2.9)
where X represents the fractional conversion of [EDE] groups and varies between 0 and 1.
All concentrations here are in mol/L. Using Equation (2.8), Campanelli obtains excellent fits
22 of up to 11 minutes (reaction extents below 50%). Data is not presented for longer reaction
times and therefore the applicability of the model to complete glycolysis or even close
approaches to equilibrium is not confirmed.
2.4.2 CONTINUOUS GLYCOLYSIS
Patent literature reveals a few processes for continuous glycolysis of PET. The earliest work
was done by Ostrowski40 in 1970. He presents a process for depolymerizing PET into
low-molecular-weight oligomers in a continuous stirred-tank reactor (CSTR). In this system, he
reports residence times of 1.5-2 hours at 230°C, obtaining BHET oligomers with an average
DP of 2-4. Malik et al.41 followed that work with a patent covering a glycolysis process
operated at temperatures between 225°C-235°C. While they claim that the process is
operated continuously, they describe hold-up times (where hold-up time is defined as the
time elapsed from the time EG is added to the reactor to the time glycolysis is complete) of 4
hours to 15 hours. Finally, in 2 separate patents, Ekart et al.42, 43 present a continuous process
for glycolysis in a stirred reactor. They operate at 180°C-240°C for reaction times up to 4
hours in order to produce an “oligomeric material” that is fed to a downstream process for
separation of impurities.
Recently, Colomines et al.44 reported the use of a twin-screw extruder for glycolysis of PET
via oligoester diols to study polyurethane formulations. Compared to their own work
23 times of 2 hours drop to extruder residence times of 2-4 minutes, demonstrating the
advantage of using a continuous reactor for such processes.
Although the depolymerization of PET was introduced merely a decade after PET itself, the
depolymerization processes that have been developed to date are far from ideal. The need to
develop an efficient and economical process for the glycolysis of PET is evident, and the
motivation for this work investigating a single-step extrusion-based depolymerization of PET
is clear.
2.5REFERENCES
1. Cornell, D.D., Recycling Polyesters by Chemical Depolymerization, in Modern
Polyesters: Chemistry and Technology of Polyesters and Copolyesters, J. Scheirs, T. E. Long, Editor. 2003, John Wiley & Sons, Ltd: New York. p. 565-590.
2. Wypych, G., Knovel Solvents - A Properties Database. ChemTec Publishing: New
York, 2000.
3. Montgomery, J.H., Groundwater Chemicals Desk Reference. 3rd ed. CRC Press
(Lewis Publishers): New York, 2000.
4. Scheirs, J., Polymer Recycling: Science, Technology and Applications. John Wiley &
Sons: New York, 1998.
5. Yao, Z., Ray, W. H., Modeling and Analysis of New Processes for Polyester and
Nylon Production. AIChE Journal. 47, 2 (2001) p. 401-412.
6. US6,380,352. Polyester precursor purification process. Sumner, J., C. Edwan and R.
B. Sheppard, Eastman Chemical Company, April 30, 2002.
7. Culbert, B., Christel, A., Continuous Solid-State Polycondensation of Polyesters, in
24
8. Campanelli, J.R., Kamal, M.R. and D.G. Cooper., J. Appl. Polym. Sci. 48 (1993) p.
443.
9. Ravens, D.A.S., Ward, I. M., Trans. Farad. Soc. 57 (1961) p. 150-159.
10. Zimmerman, H., Kim, N. T., Polym. Eng. Sci. 20, 10 (1980) p. 680.
11. Kao, C.-Y., Wan, B.-Z. and W.-H. Cheng., Ind. Eng. Chem. Res.,. 37 (1998) p. 1228.
12. Campanelli, J.R., Cooper, D.G. and M.R. Kamal, J. Appl. Polym. Sci. 53 (1994) p.
985.
13. Yalcinyuva, T., Kamal, M.R., Lai-Fook, R.A. and S. Ozgumus., Inter. Polymer
Processing. XV, 2 (2000) p. 137.
14. Goto, M., Koyamoto, H., Kodama, A., Hirose, T., Nagaoka, S. and B. McCoy.,
AIChE Journal. 48 (2002) p. 136.
15. Goto, M., Koyamoto, H., Kodama, A., Hirose, T., and S. Nagaoka., J. Phys.:
Condens.Matter. 14 (2002) p. 11427-11430.
16. Yang, Y., Lu, Y., Xiang, H., Xu, Y., and Y. Li., Polymer Degradation and Stability.
75 (2002) p. 185.
17. Challa, G., The Formation of Polyethlene Terephthalate by Ester Interchange I. The
Polycondensation Equilibrium. Makromol. Chem. 38 (1960) p. 105.
18. Challa, G., The Formation of Polyethylene Terephthalate by Ester Interchange II. The
Kinetics of Reversible Melt Polycondensation. Makromol. Chem. 38 (1960) p. 123.
19. Challa, G., The Formation of Polyethylene Terephthalate by Ester Interchange III.
The Kinetics of the Redistribution Reaction. Makromol. Chem. 38 (1960) p. 138.
20. Stevenson, R.W., Nettleton, H.R., Polycondensation Rate of Poly(ethylene
Terephthalate). J. Poly. Sci. Part A-1. 6 (1968) p. 889-900.
21. Fontana, C.M., J. Poly. Sci. Part A-1. 6 (1968) p. 2343-2358.
22. Vaidya, U.R., Nadkarni, V. M., Polyester Polyols from Glycolyzed PET Waste: Effect
of Glycol Type on Kinetics of Polyesterification. J. Appl. Polym. Sci. 38 (1989) p. 1179-1190.
23. Vaidya, U.R., Nadkarni, V. M., Polyester Polyols for Polyurethanes from PET
25
24. Vaidya, U.R., Nadkarni, V. M., Unsaturated Polyesters from PET Waste: Kinetics of
Polycondensation. J. Appl. Polym. Sci. 34 (1987) p. 235-245.
25. Baliga, S., W.-T. Wong, Depolymerization of PET Recycled from Post-Consumer
Bottles. J. Poly. Sci. Poly. Chem. 27 (1989) p. 2071-2082.
26. Chen, J.-W., Chen L.-W., J. Appl. Polym. Sci. 73 (1999) p. 35-40.
27. Chen, J.Y., Ou, C.F., Hu, Y.C., and C.C. Lin., Depolymerization of PET Resin Under
Pressure. J. Appl. Polym. Sci. 42 (1991) p. 1501.
28. Güçlü, G., Kasgöz, A., Özbudak, S., Özgümüs, S., Orbay, M., J. Appl. Polym. Sci. 69
(1998) p. 2311-2319.
29. Chen, C.-H., J. Appl. Polym. Sci. 87 (2003) p. 2004-2010.
30. Xi, G., Lu, M., Sun, C., Depolymerization of waste PET into monomer of BHET.
Polym. Deg. Stabil. 87 (2005) p. 117-120.
31. Mishra, S., Goje, A. S., J. Appl. Polym. Sci. 87 (2002) p. 1569.
32. Goje. A. S.; Mishra, S., Macromolecular Materials and Engineering. 288, 4 (2003) p.
326-336.
33. Shukla, S.R., Kulkarni, K.S., J. Appl. Polym. Sci. 85 (2002) p. 1765-1770.
34. Troev, K., Grancharov, G., Tsevi, R., Gitsov, I., A Novel Catalyst for Glycolysis of
Poly(ethylene terephthalate). J. Appl. Polym. Sci. 90 (2003) p. 1148-1152.
35. Grzebieniak, K., Wesolowski, J., Fibres & Textiles in Eastern Europe. 12, 2 (2004) p.
21.
36. Pimpan, V., Sirisook, R., Chuajuljit, S., J. Appl. Polym. Sci. 88 (2003) p. 788-792.
37. Öztürk, Y., Güçlü, G., Unsaturated Polyester Resins Obtained from Glycolysis
Products of Waste PET. Polymer-Plastics Technology and Engineering. 43, 5 (2004) p. 1539-1552.
38. Ghaemy, M., Mossaddegh, K., Depolymerisation of poly(ethylene terephthalate) fibre
wastes using ethylene glycol. Polym. Deg. Stabil. 90 (2005) p. 570-576.
39. Campanelli, J.R., Kamal, M.R. and D.G. Cooper., Kinetics of Glycolysis of PET
26
40. US3,884,850. Continuous Atmospheric Depolymerization of Polyester. Ostrowski,
H.S., Fiber Industries, Inc., May 20, 1975.
41. US4,078,143. Process for depolymerizing waste ethylene terephthalate polyester.
Malik, A., Most, E. E., E. I. DuPont de Nemours and Company, March 7, 1978.
42. US6,410,607. Glycolysis process for recycling of post-consumer PET. Ekart, M.P.,
Murdoch, Jr., W. S., Pell, Jr., T. M., Eastman Chemical Company, June 25, 2002.
43. US5,635,584. Process including glycolysis and subsequent purification for recycling
polyester materials. Ekart, M.P., Pell, Jr., T. M, Eastman Chemical Company, June 3, 1997.
44. Colomines, G., Rivas, F., Lacoste, M.-L., Robin, J.-J., Macromolecular Materials and
Engineering. 290 (2005) p. 710-720.
45. Colomines, G., Robin, J.-J., Tersac, G., Study of the glycolysis of PET by oligoesters.
27
C
HAPTER3
T
HEE
QUILIBRIUM OFPET
M
ELTG
LYCOLYSIS3.1INTRODUCTION
The glycolysis of PET is effected by reacting the polymer with ethylene glycol. The ethylene
glycol attacks the ester linkages along the PET backbone, causing chain scission and
resulting in the production of low-molecular-weight oligomers. The glycolysis reaction is
reversible and therefore requires an understanding the equilibrium of the system so that the
desired conversion and reaction products in the chemical recycling process can be obtained.
In order to recover oligomers of BHET of a specific DP and not just the monomer, a large
excess of EG cannot simply be fed to the system as has typically been done in previous
glycolysis research. Producing an oligomer requires knowledge of not only the
stoichiometric amount of EG needed to reach a certain DP but also the additional amount of
EG that is required to hold the system at equilibrium at that point and prevent the reaction
from reversing. In order to determine that quantity of EG, the equilibrium constant for the
depolymerization reaction must be known. In the literature, the value of the equilibrium
constant for polycondensation has been studied in detail because of its importance in PET
synthesis. The polycondensation reaction is considered the forward reaction, with
equilibrium constant Keq. The reverse reaction is the depolymerization reaction and in order
28 Kdep. The relationship between the equilibrium constants for the forward and reverse
reactions is as follows:
eq dep
K
K = 1 (3.1)
3.2POLYCONDENSATION EQUILIBRIUM
Most step-growth polymerizations are reversible. For these systems, it is important to know
the conversion and the molecular weight distribution of the polymer at equilibrium. For
polyesterification reactions (forward), the equilibrium constant, Keq, is typically in the range
of 1-10 and for transesterifications (forward), the value drops to 0.1-1.1 It is expected that
the value of the equilibrium constant for PET polycondensation, Keq, will fall in this range
and consequently, the value of the equilibrium constant for depolymerization, Kdep, will be on
the order of 1.
As mentioned in Chapter 2, studies on the equilibrium of melt polycondensation of PET were
pioneered by Challa2-4 in 1960. He looked at the equilibrium reached between BHET monomer, dimer and higher oligomers at temperatures over a range of 195°C-282°C in the
absence of catalyst. For samples with an average DPn=1.05 at temperatures of 254°C, the
equilibrium constant is 0.47. As the DPn of the sample increased, the value of the
equilibrium constant increased. For an average DPn = 2.22, Keq = 0.73 at 254°C. For DPn =
29 values, we can estimate the value of Kdep to be in the range of 2.6-0.9 at temperatures
between 254°C-282°C.
Challa concludes that while the value of Keq increases greatly with increasing extent of
polymerization (demonstrated at 262°C), the effect of temperature on Keq is minimal. For the
DPn = 1.05 sample, Challa measured the equilibrium constant at four temperatures: 195°C,
223°C, 254°C and 282°C. As the temperature increased, the value of the equilibrium
constant for polycondensation, Keq, dropped from 0.59 to 0.51, 0.47 and 0.38, respectively.
While the difference in values is not large, it does indicate that increasing the temperature
causes a decrease in the value of Keq. This is expected behavior for an exothermic reaction
and in fact, most step polymerizations are exothermic. For the polymerization reaction of
TPA with EG, used to make BHET oligomers, the heat of reaction, ∆HR, is -10.9 kJ.mol.1
For an endothermic reaction, the value of the equilibrium constant should increase with
increasing temperature. Kao et al.5 monitored the glycolysis reaction by differential scanning
calorimetry (DSC). Their results show a reaction endotherm, i.e. a positive heat of reaction,
for glycolysis. A value of ∆HR for PET glycolysis can be estimated by finding the difference
in activation energy (Ea) between the polycondensation and glycolysis reactions. For the
transesterification of BHET, the typical value of Ea is 188 kJ/mol in the absence of catalyst.1 The value of Ea for glycolysis is fairly consistent in the literature and is reported to be 92
30 that ∆HR for glycolysis is the opposite of that for the transesterification of TPA and EG,
about +10.9 kJ/mol.
Stevenson and Nettleton8 followed Challa’s work with a study of melt polycondensation equilibrium in the presence of an antimony trioxide catalyst. They report that the equilibrium
constant, Keq, for a range of temperatures from 231-251°C is 0.36 with no discernible
influence of temperature. At the same time, Fontana9 published a study of the polycondensation equilibrium in the presence of lead, zinc and calcium salts over a
temperature range of 199°C-278.5°C. He found an average value of Keq of 0.5.
Baliga and Wong,10 in their study of PET depolymerization via glycolysis at 190°C, report values of 1.13-1.53 for the equilibrium constant between 2 BHET molecules, a dimer and
EG. Collectively, these values suggest that the equilibrium constant for glycolysis should be
on the order of 1, but there remains ambiguity about where it falls exactly. For this reason,
we found it essential to conduct our own study on the equilibrium of PET glycolysis in the
31
3.3EXPERIMENTAL PROCEDURE
3.3.1MATERIALS
Bottle-grade (CB12) virgin PET resin used in this study was donated by Voridian (Mw =
55,000; PDI = 2.8; IV=0.83). Ethylene glycol (purity > 99%) from Acros Organics was used
as received.
3.3.2METHOD
Reactions were carried out in 5 mL stainless steel Micro-reactors from High Pressure
Equipment. The reactors were immersed in a Fisher High-Temperature Bath filled with
Dynalene 600 heat transfer fluid, stable to 288°C. Reactors were stabilized on a platform
which oscillated up and down within the bath, while stainless steel balls were added to the
reaction mixture to ensure proper agitation. Reactions were run at 260°C with varying
EG:PET charge ratios from 0.5 to 1. Reactors were left in the bath for times of up to 6 hours
to ensure the reaction had reached equilibrium. The reactions were quenched immediately
upon removal from the oil bath by immersing the reactors in cold water. Reaction products
were collected from the reactors and dried in a vacuum oven for at least 12 hours at
90-100°C to remove EG. A detailed description of the procedure including product analysis
32 3.3.3PRODUCT ANALYSIS
The products were analyzed using a hydroxyl end group titration. The procedure for the
hydroxyl end group titration was taken from ASTM D2849 Method A, described by Chen et
al.,11 with the exception that dry dichloroethane was used instead of benzene according to the procedure described by Polk.12 A summary of the method used is as follows. Between 0.35
– 0.50 g of sample was weighed into a 100-mL reaction flask and 10 mL of the acetylation
solution (1.2 mL of anhydrous pyridine and 8.8 mL of acetic anhydride) was added. The
flask was fitted with a reflux condenser and heated in a boiling water bath under stirring until
the polyol sample was completely dissolved. After complete dissolution, the flask was
removed from the water bath and 10 mL of dry dichloroethane was added under stirring.
Next, 100 mL of water was added to the mixture under stirring and the solution was titrated
with 0.5 N KOH solution, using phenolphthalein as an indicator. A blank run without the
sample was also performed.
The hydroxyl value is calculated from the following equation
m n v v value
Hydroxyl =56( 1− 2)
33
where v1 and v2 are the volumes in mL of 0.5 N KOH used for titration of the blank and the
sample, respectively; n is the normality of the KOH solution, and m is the weight of the
polyol sample in grams.
The hydroxyl value can be used to calculate the average degree of polymerization (DPn) of
the product which is then used to calculate the value of the equilibrium constant for
depolymerization, Kdep. A sample calculation can be found in Appendix A.2.
3.4RESULTS AND DISCUSSION
We follow the reverse reaction by monitoring the concentration of functional groups in the
system, as described by Challa.4 The balanced equation describing the glycolysis of PET is
below:
PET + (n-1) EG ↔ n BHET (3.3)
When written in terms of functional groups, this equation becomes:
34 where HEE is the hydroxyl ethyl ester group in BHET, EDE is ethylene diester group in the
PET backbone, and EG is ethylene glycol.
The equilibrium constant of this reaction can thus be written in terms of functional groups as:
] ][ [
]
[ 2
EG EDE
HEE
Kdep = (3.5)
The quantities of each are in molar equivalents per mole repeat unit. The values of [HEE],
[EDE] and [EG] can be written in terms of DP, allowing Eq. (3) to be solved using the
average DPn calculated from the hydroxyl number. For our calculations of Kdep, we assume
that all of the EG charged to the reactor remains in the liquid phase.
Following are the results of equilibrium experiments run at 260°C for varying EG:PET
ratios. Figure 3.1 shows the progression of the glycolysis reaction over time for an initial
EG:PET charge of 1:1 (w/w). From the data points at short times, we can see that the
reaction reaches equilibrium quickly, i.e. in about 1 hour. This is supported by work done by
Chen et al.,11 who also show that this reaction proceeds to a mixture of trimer, dimer and
monomer within 1.5 hours, after which equilibrium is reached among those 3 species. As
shown in Figure 3.1, we found the average OH# for this reaction to be 340, corresponding to
35 Figures 3.2 and 3.3 show results for the EG:PET = 0.67:1 and EG:PET = 0.05:1 cases,
respectively, with values of the average OH# and DPn shown.
Batch Equilibrium for 1:1 EG:PET at 260C
0 50 100 150 200 250 300 350 400
0 1 2 3 4 5 6 7
Time (h) OH # 0 5 10 15 DP
OH#eq= 340
DPeq= 1.72
Batch Equilibrium for 1:1 EG:PET at 260C
0 50 100 150 200 250 300 350 400
0 1 2 3 4 5 6 7
Time (h) OH # 0 5 10 15 DP
OH#eq= 340
DPeq= 1.72
FIGURE3.1Batch glycolysis of PET at 260°C, EG:PET=1:1 (w/w).
0 50 100 150 200 250 300 350 400
0 1 2 3 4 5
Time (h) OH # 0 5 10 15 20 25 30 35 40 45 50 DP
DPeq= 2.11
OH#eq= 276
0 50 100 150 200 250 300 350 400
0 1 2 3 4 5
Time (h) OH # 0 5 10 15 20 25 30 35 40 45 50 DP
DPeq= 2.11
OH#eq= 276
36
Values of the equilibrium constant for glycolysis, Kdep, for each EG:PET ratio are shown
below in Table 3.1. The error shown is the standard deviation in the value of Kdep calculated
for each data point obtained at equilibrium.
TABLE 3.1 Equilibrium constant, Kdep, at varying EG:PET ratios(w/w) and temperatures.
EG:PET (w/w) Temperature (°C) OH#eq DPeq Kdep
0.5 260 248 2.37 1.1 ± 0.4
0.67 260 276 2.13 1.1 ± 0.3
1:1 260 340 1.74 1.2 ± 0.3
1:1 270 306 1.91 0.8 ± 0.2
0 50 100 150 200 250 300 350
0 1 2 3 4 5
Time (h) OH # 0 5 10 15 20 25 30 35 40 45 50 DP
OH#eq= 248
DPeq= 2.35
0 50 100 150 200 250 300 350
0 1 2 3 4 5
Time (h) OH # 0 5 10 15 20 25 30 35 40 45 50 DP
OH#eq= 248
DPeq= 2.35
37 Based on these results, there does not seem to be any influence of the charge EG:PET ratio,
or the extent of depolymerization, on the equilibrium constant. This contradicts what Challa
found in his studies of polycondensation equilibrium4, although in our reactions, the values
of the average DPn for each ratio are very close to one another, varying only from 1.74 to
2.37 while those of Challa ranged from 1.05 to 33.
We also investigated the influence of temperature by conducting equilibrium reactions at
270°C for an EG:PET ratio of 1:1 (w/w). The reactions were allowed to proceed for up to 6
hours with the results shown in Table 3.1. Although the value of 0.8 for Kdep at 270°C is
slightly lower than those measured at 260°C, it does not fall outside of experimental error
and therefore is not significantly different. This is consistent with early works2-4, 8 that
concluded that temperature had little influence on the equilibrium of the polycondensation
reaction, but it is not expected behavior for an endothermic reaction.
It is also possible to predict the average DPn that can be obtained at equilibrium by modeling
the depolymerization kinetics. The glycolysis reaction can be written as follows, assuming
the reaction only takes place in the liquid phase and that there is no monomer or polymer in
the vapor phase:
(
)
( )
− + + − − =∑
−∑
∑
= ∞ + = − ∞ + = − 11 1 1
2 2
1
i
j j i
i j i j i b E j f j i j b E i f L i
LP V k P i C k PP k PC k PP
V dt
d