DOI: 10.1534/genetics.109.104042
Frequency Spectrum Neutrality Tests: One for All and All for One
Guillaume Achaz
1Syste´matique, Adaptation et Evolution (UMR 7138) and Atelier de Bioinformatique, Universite´ Pierre et Marie Curie-Paris VI, Centre National de la Recherche Scientifique, Museum National d’Histoire Naturelle, Institut de Recherche pour le De´veloppment,
75005 Paris, France Manuscript received April 16, 2009 Accepted for publication June 12, 2009
ABSTRACT
Neutrality tests based on the frequency spectrum (e.g., Tajima’sDor Fu and Li’sF) are commonly used by population geneticists as routine tests to assess the goodness-of-fit of the standard neutral model on their data sets. Here, I show that these neutrality tests are specific instances of a general model that encompasses them all. I illustrate how this general framework can be taken advantage of to devise new more powerful tests that better detect deviations from the standard model. Finally, I exemplify the usefulness of the framework on SNP data by showing how it supports the selection hypothesis in the lactase human gene by overcoming the ascertainment bias. The framework presented here paves the way for constructing novel tests optimized for specific violations of the standard model that ultimately will help to unravel scenarios of evolution.
T
HE standard models of population genetics (i.e., the Wright–Fisher model and related ones) con-stitute null models for which an amazing amount of theory has been developed. Population geneticists have used some aspect of the theory (e.g., summary statistics) to test the goodness-of-fit of the standard model on a given data set. Rejection of the standard model typically suggests that alternative hypotheses, such as selection or demographic history, have to be accounted for. Al-though they test for more than neutrality, tests that compute the goodness-of-fit of the standard model have been referred to as ‘‘neutrality tests.’’ Since ferent neutrality tests have varying sensitivity to dif-ferent violations of the standard model, one typically uses a plethora of tests on the data set of interest. One then hopes that the evolutionary processes that gen-erated the data set will be, at least partially, uncovered by the tests. Although neutrality tests based on pop-ulation samples exhibit important diversity, they can be assigned to families such as ‘‘haplotype tests’’ (e.g., Fu1997; Depaulis and Veuille 1998) that use the
dis-tribution of haplotypes, ‘‘tree shape tests’’ that try to capture specific tree deformations (e.g., Ramos-Onsins
and Rozas2002), and ‘‘frequency spectrum tests’’ that
are based on the frequency spectrum (e.g., Tajima
1989; Fuand Li1993b; Fayand Wu2000; Achaz2008).
In this study, I investigate neutrality tests based on the frequency spectrum (hereafter referred to simply as neutrality tests) and show that they are all specific
instances of a general framework. Neutrality tests compare two estimators of the population mutation parameteruthat characterizes the mutation–drift equi-librium. It is defined asu¼2pNem, wherepis the ploidy
(1 for haploids and 2 for diploids), Neis the effective
population size, and m is the locus neutral mutation rate. When the standard model is true, the expectations of the several unbiased estimators ofuare equal.
Typical estimators ofu, in a sample ofnsequences, are ˆ
uS ¼S=an, whereS is the number of polymorphic sites and an¼Pn1
i¼1ð1=iÞ (Watterson1975), and ˆup¼p,
where pis the average pairwise difference between all sequences in the sample (Tajima1983). If an outgroup
is available, mutations at frequency i/n can be distin-guished from mutations at frequency 1i/n. Following Fu (1995)’s notations, j is a vector that represents
the unfolded frequency spectrum composed of ji, the number of polymorphic sites at frequency i/n in the sample (i2[1, n1]). When no outgroup is available, the frequency spectrum is folded and is given by a vector h, composed ofhi, the number of polymorphic sites at both frequencies i/n and 1 i/n. Accordingly, it has been shown thatucan be estimated from ˆuj1 ¼j1, with j1the number of derived singletons (Fuand Li1993b),
from ˆuh1¼ ððn1Þ=nÞh1, withh1the total number of
singletons (derived and ancestral) (Fuand Li1993b),
and from ˆuH ¼Pn 1
i¼1ð2i
2=ðnðn1ÞÞÞj
i (Fay and Wu 2000). Recently, it has been suggested that singletons should be ignored whenuis estimated in samples with sequencing errors; this leads to estimators such as ˆ
upj1, ˆuSj1, ˆuph1, and ˆuSh1 (Achaz2008). Other esti-mators ofu, such as ˆujand ˆuh, were designed to minimize
their variance (Fu 1994b), although they can be
com-puted using recursions only for a given value ofu. Supporting information is available online athttp://www.genetics.org/
cgi/content/full/genetics.109.104042/DC1.
1Address for correspondence:Atelier de Bioinformatique, Universite´ Pierre et Marie Curie, 4 Place Jussieu, Boıˆte Courrier 1202, 75005 Paris, France. E-mail: [email protected]
Neutrality tests compute the goodness-of-fit of a statisticT, which is the difference between two estima-tors ofu, normalized by its standard deviation:
T ¼ ffiffiffiffiffiffiffiffiffiffiffiffiffiffiffiffiffiffiffiffiffiffiffiffiffiuˆ1uˆ2 Var½uˆ1uˆ2
q ¼ ffiffiffiffiffiffiffiffiffiffiffiffiffiffiffiffiffiffiffiffiffiffiffit
anu1bnu2
p : ð1Þ
For a given u, under the standard model, T has a mean ofE[T]¼0 and a variance of Var[T]¼1. Lower-case letters (e.g.,t) denote the absolute difference (i.e., the numerator only) and uppercase letters (e.g.,T) de-note the normalized difference (Equation 1) throughout this work. Interestingly, the variance in the denominator is a function of bothuandu2. Becauseuis unknown, the
denominator cannot be computed as such. In practice, unbiased estimators ofu andu2must be used instead.
Because the variance of ˆuS vanishes asymptotically in a very large sample (limn/‘Var½uˆS ¼0),uandu2are, in practice, substituted by estimators based onS(Tajima
1989), which changes the mean and the variance ofTto E[T]0 and Var[T]1.
Tajima’s D(Tajima1989) is defined byd ¼ˆupuˆS;
the statistics proposed by Fu and Li (1993b) are f ¼
ˆ
upuˆj1,f*¼uˆpˆuh1,d2 ¼ˆuSˆuj1, andd2*¼uˆSuˆh1.
Another classical statistic ish ¼uˆpˆuH (Fay and Wu 2000), even though its variance was not given by the authors. Finally, two other related neutrality tests that are, a priori, immune to sequencing errors were pro-posed: y¼uˆpj1
ˆ
uSj1 and y*¼ ˆ
uph1 ˆ
uSh1 (A
chaz
2008). Other tests based on uj and uh (which are
optimized for a givenu-value) as well as the difference between the observed and the expected values of the frequency spectrum were also proposed (Fu1996).
Here, I show that when using a general weighted linear combination of ˆui¼iji(or ˆu* when no outgroupi is available), any estimators of u [i.e., uˆv¼ ð1=PviÞPiviiji] and consequently any neutrality tests can be derived. Nawaand Tajima(2008) recently
advocated the use of the ˆu* spectrum, which is expectedi to be uniform under the standard model, as a visual test for neutrality instead of the classical frequency spec-trum. This last proposal is in complete agreement with the current work. Importantly, it has been previously reported that some u-estimators and neutrality tests could be expressed as specific linear combinations of
ji or hi (Tajima 1997; Wakeley 2009). Furthermore,
Fu (1997) shows that several u-estimators can be
ex-pressed as specific linear combinations of ˆui (ˆuLðxÞ¼
ð1=PixÞP ii
xij
i) or in a related framework that uses ˆ
u* instead of ˆi ui. ˆuH was subsequently designed as ˆuLð1Þ (Fayand Wu2000). However, some estimators (like ˆup,
ˆ
upj1, or ˆuSj1) cannot be expressed using the F
u(1997)
framework. To the best of my knowledge, no previous study has explicitly derived the framework presented here. No work has yet highlighted the striking simplicity ofu-estimators and related tests, when expressed in this
framework. I further show how the use of such a simple framework greatly facilitates the study of previous
u-estimators and their related neutrality tests and how it opens the door for constructing yet undiscovered interesting u-estimators and neutrality tests with en-hanced power.
MODEL
With an outgroup:According to Fu(1995), we know
that
E½ji ¼u=i ð2Þ
Var½ji ¼u=i1siiu2 ð3Þ
Cov½ji;jj ¼siju2; ð4Þ
where sii and sij depend only on n and are given in Equation 2 of Fu(1995). This shows thatE[iji]¼uand
therefore that any ji can be used to construct an un-biased estimator ofu:
ˆ
ui¼iji: ð5Þ
Consequently, a linear combination ˆuvof the ˆui’s (in
which the weights sum to 1) is also an unbiased estimator ofu. Mathematically, it is expressed as
ˆ
uv¼ 1 P
ivi
Xn1
i¼1
viiji; ð6Þ
where vi is the weight of each ˆui in the combined estimator. Therefore, any estimator based on the frequency spectrum can be solely described by an v-vector. Importantly, it should be mentioned that Fu
(1997) also proposed a linear combination ofiji, but in which only a subset of the weight vectors was used. Namely, the proposed weight vectors were restricted to
vi¼ix.
Using Equations 3 and 4 the variance of ˆuv can be
shown to be
Var½uˆv
¼ X
i
vi2 X n1
i¼1 v2
ii2Var½ji12 X
i X
j.i
ijvivjCov½ji;jj
!
¼ X
i vi
2
3 u X
i v2
ii !
1u2 X
i v2
ii2sii12 X
i X
j.i
ijvivjsij !!
:
ð7Þ
Following Tajima(1989), using Equation 1, one can
TV¼ ˆ
uv1uˆv2
Var1=2½uˆv1uˆv2
; ð8Þ
which can be expressed as a function of anV-vector,
TV¼ P
iViiji
ffiffiffiffiffiffiffiffiffiffiffiffiffiffiffiffiffiffiffiffiffiffiffi
anu1bnu2
p ð9Þ
with
Vi ¼Pv1i
jv1j
Pv2i
jv2j an¼
X
i
iV2i
bn¼X
i
i2V2isii12
X
i
X
j.i
ijViVjsij:
TheV-vector results from the difference between two weight vectors normalized to 1. As a consequence, (1) all elements of theV-vector sum to 0 and (2) the sum of all positive values cannot be.1 and the sum of all negative values cannot be, 1. Any vector that fits these two constraints can be considered, along with Equation 9, as a neutrality test.
Without an outgroup: If no adequate outgroup is available, the unfolded frequency spectrum and conse-quently the ˆui spectrum, cannot be computed. This implies that one has to use the h folded frequency spectrum. Following Fu (1995), we define h
i¼
ðji1jniÞ=ð11di;niÞand therefore we have
E½hi ¼fiu ð10Þ
Var½hi ¼fiu1riiu2 ð11Þ Cov½hi;hj ¼riju2; ð12Þ
where di,ni is a Kronecker delta (1 if i ¼ j, and 0 otherwise) and where
fi ¼ n
ð11di;niÞiðniÞ
rii¼sii1sðniÞðniÞ12siðniÞ ð11di;niÞ2
rij ¼sij1siðnjÞ1sðniÞj1sðniÞðnjÞ ð11di;niÞð11dj;njÞ
:
Although, we cannot compute the ˆui¼iji spectrum (as defined above), we can compute a folded ˆu*i spectrum defined as
ˆ
u*i ¼fi1hi: ð13Þ
This folded ˆu* spectrum is the visual neutrality testi proposed by Nawaand Tajima(2008). Using a similar
reasoning to that above, a linear combination of ˆu* leadsi to a generic unbiased estimator ofudefined as
ˆ
u*v¼P1
iv
*
i
Xn=2
i¼1
v*
if 1
i hi; ð14Þ
whose variance is given by
Var½ˆu*v ¼ X
i
v*i
2
u X
i
v*2i fi1 !
1u2 X
i
v*2 i f
2 i rii12
X
i X
j.i
f1 i f
1 j v*iv*jrij !!
:
ð15Þ
Consequently, the corresponding neutrality testTV* is
TV* ¼ P
iV
*
if 1
i hi
ffiffiffiffiffiffiffiffiffiffiffiffiffiffiffiffiffiffiffiffiffiffiffi
a*nu1b*nu2
q ð16Þ
with
V*i ¼ v
* 1i P jv * 1j v * 2i P jv * 2j a*n ¼X
i
fi1V*2i
b*n¼X i
fi2V*2i rii12X
i
X
j.i f1
i f 1
j V*iV*jrij:
It is important to mention that Tajima (1997)
pre-viously showed thatD,F*, andD2* could be expressed as
a linear combination ofhi. More precisely, the vectors used then correspond in the present framework to P
iV*if 1
i =
ffiffiffiffiffiffiffiffiffiffiffiffiffiffiffiffiffiffiffiffiffiffiffiffiffiffi
an*ˆuS1bn*ˆu
2
S q
. This vector definition em-phasizes the weight on eachhirather than on each ˆui*.
With or without an outgroup:Using both definitions of ˆui (Equation 5) and ˆui* (Equation 13), it is easy to show that we have
ˆ
u*i ¼1
n ðniÞˆui1iuˆni
: ð17Þ
As a consequence, the use of anv*-vector along with thehfolded frequency spectrum is equivalent to the use of anv-vector with thejunfolded frequency spectrum only when we have
1
n ðniÞv *
iuˆi1iv*iuˆni
¼ 1
ð11di;niÞ
ðviuˆi1vniuˆniÞ
v*i ¼ n
ðniÞð11di;niÞ vi
¼ n
ið11di;niÞ
vni: ð18Þ
ivi¼ ðniÞvni: ð19Þ
To fold the frequency spectrum, the weight ivi as-sociated withji(and not with ˆui) has to be the same as the weight (ni)vniassociated withjni. This trans-lates into anivi vector that is symmetric aroundn/2. Furthermore, when the constraint (expressed in Equa-tion 19) is fulfilled, we can write, for any 0#f#1,
v*
i ¼
n
ð11di;niÞ
f vi
ðniÞ1ð1fÞ vni
i
;
which leads interestingly forf¼(ni)/nto
v*
i ¼ ðvi1vniÞ
1
ð11di;niÞ
: ð20Þ
The weights on ˆu* simply result from the sums of thei weights on ˆui and on ˆuni that are pooled when the spectrum is folded. In that respect, any v-vector complying to Equation 19 can be used without the help of an outgroup. Thev*-vectors are then a subset of all possible values of the v-vectors. The former can be computed from the latter by using Equation 18 or 20.
BecauseVis the difference between two normalized v-vectors, all relationships betweenvandv* expressed above also hold forVandV*.
RESULTS
The model described above shows that all estimators of
ubased on the frequency spectrum are linear combina-tions of ˆui¼iji, weighted by a specific vectorv. When no outgroup is available, one can use a linear combination of ˆu*i ¼f
1
1 hi, weighted by a vectorv*. Consequently,
neutrality tests can be expressed as a linear combination of ˆui(or ˆu*) weighted by a vectori V(orV*), for which a variance can be computed easily. Three applications of
the model are developed below. First, I reinvestigate the previous estimators of u and their corresponding neu-trality tests and frame their intrinsic properties in terms of the ˆui(ˆui*) spectrum. Then, since previous tests are only specific instances of the framework, I show how the model can be used to build new tests that are more powerful than previous ones. Finally, I exemplify the benefit of the framework on real data that are known to be subject to an ascertainment bias.
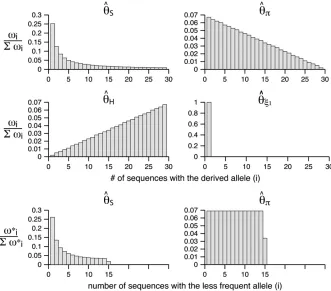
Previous u-estimators and neutrality tests: Using Equation 6, all previously reported u-estimators are given by an v-vector (Table 1). When defined, the correspondingv*-vectors are also provided (Table 1). A graphical representation of four estimators ofuis shown in Figure 1. Figure 1 highlights that both ˆuS and ˆup
emphasize the low-frequency polymorphic sites in their estimation ofu(although not as much as ˆuj1, which is solely based on derived singletons) and that, on the contrary, ˆuH gives more weight to ancestral polymor-phisms. Framed in the folded spectrum, ˆuS still weights more low plus high frequencies whereas ˆup has a
uniform weight. Potentially, using other weight vectors, one could express any undiscovered estimator of u
based on the frequency spectrum.
The numerical variances of the previous estimators of
uare reported in Table 1 (forn¼30 andu¼1, 10, 100). They can be computed either by their original deriva-tions or by Equation 7. This clearly shows that, among previous estimators ofu, the variance of ˆuSis the smallest and that of ˆuH is the largest. This can be explained by the fact that the variance of ˆui increases with i. As a consequence ˆuH, which puts more weight on ancestral alleles, shows a larger variance. Interestingly, estimators without singletons have relatively small variances.
Previous neutrality tests are given in Table 2. A graphical representation of the V-vectors (and V* when defined) used in four previous tests is reported
TABLE 1
Basic characteristics of previous estimators ofu
v* Variance (n¼30)
Estimators v (when defined) u¼1 u¼10 u¼100
ˆ
uS vi¼i1 v*i ¼iðniÞð1n1di;niÞ 0.36 12.8 1052
ˆ
up vi¼ni v*i ¼ð11ndi;niÞ 0.59 27.4 2419
ˆ
uh1 v1¼ ðn1Þ;vn1¼1;v1,i,n1¼0 v*1¼n;v*i.1¼0 1.22 35.1 2839
ˆ
uSh1 v1¼vn1¼0;v1,i,n1¼i
1 v
1
*¼0;v*i.1¼iðniÞð1n1di;niÞ 0.52 21.4 1833
ˆ
uph1 v1¼vn1¼0;v1,i,n1¼ ðniÞ v*1¼0;v*i.1¼ n
ð11di;niÞ 0.68 31.9 2825
ˆ
uj1 v1¼1;vi.1¼0 — 1.15 25.0 1599
ˆ
uH vi¼i — 1.55 65.0 5597
ˆ
uSj1 v1¼0;vi.1¼i
1 — 0.51 20.3 1730
ˆ
in Figure 2. Figure 2 shows that the sensitivity of the different tests differs although they share some com-mon features. For example, Dand F* both are nega-tively sensitive to both low and high frequencies (although more sensitive to low frequencies).Dshows opposite sensitivity between medium frequencies and low/high frequency, whereasF* shows poor sensitivity to medium-frequency polymorphisms.FandF* have oppo-site effects on doubletons and singletons. Thus, devia-tions that enhance both will have opposite effects. Finally, His oppositely skewed by low and high frequencies.
One crucial aspect of neutrality tests is their impor-tant variance under the neutral model. This variance induces a large confidence interval and therefore
decreases their power to detect a deviation. It has been argued that this variance is a consequence of the tree shape variance and that neutrality tests based on the frequency spectrum are doomed to exhibit low power
(Felsenstein1992b).
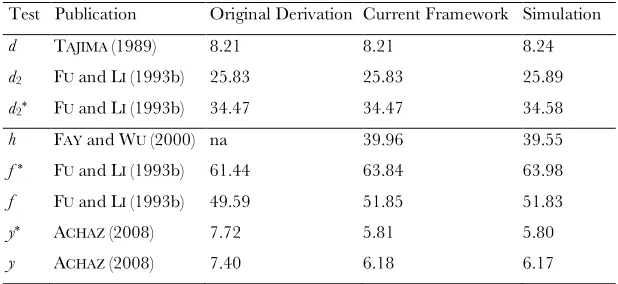
As a consequence, an ideal neutrality test should minimize its variance under the standard model. The variances of the denominator of previous neutrality tests are given in Table 2 (forn¼30 andu¼1, 10, 100). It is also important to mention that previous derivations off, f*,y, andy* variances give different values. Simulations show that the new derivations are the correct ones (supporting information,Table S1). First, it should be noted that the original D test has a very low variance Figure1.—Estimators ofu. A
graph-ical view of the weight vectors of four typical estimators of u (for n ¼ 30). All values of the normalized vector sum to 1. In the top four panels, the
v-vectors that are defined for the un-folded frequency spectrum (j) are given, whereas the two bottom ones are the
v*-vectors that are defined for the folded frequency spectrum (h). For es-timators that can be defined in terms of bothvandv* (here ˆupand ˆuS), the lat-ter can be computed from the former with v*i ¼vi1vni (when i 6¼ n i) orvi*¼vi (wheni¼ni).
TABLE 2
Basic characteristics of neutrality tests
Variance (n¼30)
Test ˆu1 uˆ2
Mandatory
outgroup u¼1 u¼10 u¼100
d uˆp ˆuS 0.18 8.2 728
f uˆp uˆj1 No 1.62 51.9 4,084
d2 uSˆ uˆj1 0.93 25.8 1,910
y uˆpj1
ˆ
upj1 0.12 6.2 558
h uˆp uˆH 0.98 40.0 3,417
f* ˆup uˆh1 Yes 1.71 63.8 5,314
d2* uSˆ uˆh1 0.99 34.5 2,805
y* uˆph1 uˆSh1 0.12 5.8 524
TV v1i¼e0.9i v2i¼1 1.19 37.1 2,895
v1i¼ 30i 0:5
30 v
when compared to all other tests. This is connected to the low variance of both ˆuS and ˆup. Second, YandY*
tests have also a small variance, although they ignore an important fraction of the data (i.e., singletons). All other tests have a similar variance.
This predicts that Dtypically will be sensitive to low, medium, and high frequencies and should be more powerful because it has a relatively low variance under neutrality. Therefore, it has the potential to be an excellent neutrality test and it appears that it is often one of the most powerful tests (Simonsenet al.1995; Fu
1997). H is sensitive either low or high frequencies; however, its larger variance predicts that it will be useful only when the distortion in the u-spectrum is very strong. In practice, it is powerful only when there is a large excess of high-frequency polymorphisms. The singleton tests appear to be good candidates to capture an excess of singletons, although they neglect other deviations in the spectrum. TheYandY* tests have low variance, although ignoring singletons can lead to low power especially when they are in excess (Achaz2008).
Building new tests: To design new neutrality tests using this framework I started by analyzing the deviation of the average ˆui spectrum, which is expected to be uniform under the standard models. Furthermore, because Fu(1995) showed that the covariance between ji’s is weak when compared to their variance, visual inspection of the variance of ˆuiprovides a first approx-imation to the expected variance of ˆuvand therefore of
their relatedTvtests. I studied two deviations from the
standard model: a severe bottleneck and isolated popu-lations with migration.
The severe bottleneck was simulated as a sudden change of size fromNchromosomes toN/100 that lasts for a timeTl¼0.1 (inNgenerations). Accordingly, the
coalescent rates within the bottleneck are accelerated by 0.01 and the simulations were performed as in Simonsen
et al.(1995). Sampling was performed after a timeTbhas
elapsed after the bottleneck. The mean and the stan-dard deviation of ˆuiare given in Figure 3a for two times, Tb¼0.03 andTb¼0.3. Figure 3 shows that most of the
deviation comes from the sites with low frequency. Therefore, I designed a new test that captures the deviations within low frequencies. In this test, I used a first vector of v1i ¼ eai, with a ¼ 0.9 and a second uniform vectorv2i¼1. This results in an exponentially decreasing weight for low-frequency mutations (Figure 3) that is positive for frequencyi/n#0.13. The choice of
a¼0.9 was mostly empirical, although usinga¼0.8 or
a ¼ 1 leads to similar results (data not shown). As stressed in thediscussion, this study aims at
illustrat-ing how easy it is to create new tests with enhanced power; power optimization deserves an entire new study. A graphical view of theV-vector associated with this newTVtest is given in Figure 3 and its variance is
reported in Table 2. Most of the weight of this test is given to low frequencies and its variance is comparable to those of other neutrality tests. The power of this new test and ofD,F, andHis reported in Figure 3. Results show that the new test outperforms the previous tests Figure2.—Neutrality tests. A
graphi-cal view of the weight vectors of four typ-ical neutrality tests (forn¼30). Because theV-vectors used for neutrality tests are computed as a difference between two normalized vectors, all values ofVsum to 0. In the top four panels, theV-vectors that are defined for the unfolded fre-quency spectrum (j) are given, whereas the two bottom ones are theV*-vectors that are defined for the folded fre-quency spectrum (h). For estimators that can be defined in terms of bothV
by 20% and is able to detect the deviation for a longer time.
The 95% confidence intervals were built using coales-cent simulations under the standard model, using a fixed number of segregating sites (Hudson 1993; Depaulis
and Veuille1998). Although there has been much debate
on how confidence intervals should be set (Depauliset al.
2001; Markovtsovaet al.2001; Walland Hudson2001),
it has been clearly shown that the choice of a particular method does not alter the results in standard models
(Ramos-Onsinset al.2007) and therefore is not discussed
here.
In the second scenario, I compared the power of neutrality tests in detecting a case of isolation with migration (e.g., Nielsen and Wakeley 2001). In the
simulations, the isolation event happened at timeTi¼3 and both populations were sampled equally (na¼nb¼
15). The migration rate between the two populations is variable. Similar to the analysis of the bottleneck, I first report the mean and the standard deviation of the ˆui spectrum. Figure 4 shows that most of the deviation comes from the sites at frequency 15/30. Additionally, for a small enough migration rate (M¼0.1), there are almost no polymorphisms with frequency .0.5. Al-though the standard deviations are large, the coeffi-cients of variations (variance/mean) are relatively small. To design a new test, I used for the first v-vector the probabilities given by a binomial law,v1i ¼
i n
pið1
pÞni
withp¼0.5 andn¼30 and a uniform vectorv2i¼ 1 as a second vector.
This was motivated by the idea of designing a test that specifically captures an excess of medium-frequency polymorphisms. A graphical view of the resulting V-vector is given in Figure 4 and its variance is given in Table 2. Almost all the weight of this test is given to the 13,i,17 sites. The variance of this new test is large, and this is related to the large variance of ˆun=2 in the
sample with evenn. Despite this large variance, the test clearly outperforms all previous tests (Figure 4).
Overcoming the ascertainment bias: As an example of the power of designing new neutrality tests, I analyzed SNP data (from HapMap) around the Lactase gene (LCT), which has been shown to exhibit a footprint of a recent strong selective sweep in European populations
(Bersaglieri et al. 2004) as well in eastern African
populations (Tishkoff et al. 2007). This pattern of
recent selection is one of the strongest in the human genome (Nielsen et al. 2005). Indeed, it has been
advanced that the lactase-persistence phenotype (the ability to digest milk as an adult) has been advantageous in European populations of farmers (especially in Northern European ones). The SNPs that are tightly associated with the selective sweep in Europeans are located at 13–22 kb upstream of the gene start
(Bersaglieriet al.2004). From HapMap (release 27,
February 2009) I gathered all SNPs in a window of Figure3.—Example of a severe
bot-tleneck. (a) The mean and the standard deviation of the ˆui spectrum that is ob-served in simulations (n¼30, 104
repli-cates) of a standard model or of a recent severe bottleneck (reduction of f¼1/100 for a timeTl¼0.1). In both
times after the bottleneck (Tb ¼ 0.03
and Tb ¼ 0.3), the observed trend is
similar: an excess in low frequency of ˆ
ui, though stronger forTb¼ 0.03. (b)
Left, the weight vector of a new neutral-ity test (hereTV) is reported. It focuses
its sensitivity on low frequencies: Vi¼e0:9i=P
je
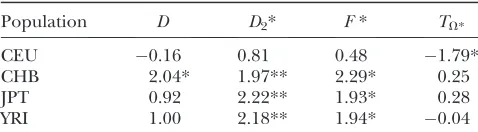
100 kb centered at the start of the lactase gene. This includes 50 kb upstream and the entire gene. I con-sidered only SNPs whose sample size was at least 85 chromosomes. Because the sample size of all SNPs was not identical, I used the observed frequencies to generate a folded frequency spectrum of 85 chromo-somes for the following populations: Utah residents with northern and western European ancestry from the CEPH collection (CEU); Han Chinese in Beijing, China (CHB); Japanese in Tokyo, Japan ( JPT); and Yoruban in Ibadan, Nigeria (YRI).
According to the literature, one expects to find a trace of an ongoing selective event in the CEU population only. Without the help of an outgroup, this would translate into an excess of low-frequency polymorphism in the folded frequency spectrum (typically, negativeD, F*, and D2*). Computation of the standard neutrality
tests shows a deficit of low-frequency polymorphism rather than an excess. This deficit is even often significant (Table 3). This is clearly caused by the ascertainment bias in the data set. Because the poly-morphisms were first screened in a small group and further genotyped in larger groups, rare variants are underrepresented (e.g., Kuhneret al.2000; Clarket al.
2005). This ascertainment bias has been subject to various corrections (e.g., Wakeleyet al.2001; Nielsen
et al.2004). To avoid any correction, I computed aTV*
test where the weights of bothv1* andv2* vectors were
set to 0 for i , 8. The remaining two vectors were computed using ˆupand ˆuS. As a consequence, this test is D-like in that it considers only polymorphisms with frequencies in the range [0.09, 0.91]. This is reminis-cent of ignoring the singletons data set where sequenc-ing errors are suspected (Achaz2008). Results (Table
3) show that this test significantly deviates from the standard model for the CEU population. Ignoring fewer polymorphisms (e.g., only the 5% that are of low fre-quency) or changing the minimum sample size leads to similar results (data not shown).
DISCUSSION
Here I developed a unifying framework foru-estimators on the basis of the frequency spectrum. Namely, all known estimators of u are linear combinations of ˆui ¼iji (or ˆ
u*i ¼fi1hi). Because neutrality tests based on the frequency spectrum are simple functions of theseu -esti-mators, the framework can be used to derive them. All tests (of this family) proposed so far are embedded in the framework. Using the model, I have shown that esti-mators ofu based on a folded spectrum always have an unfolded equivalent. The reciprocal, however, is not true. Besides its unifying appeal, the model developed here can be used in several ways. First, I showed how it can be used to compute the variance of all estimators ofuand consequently of statistics such ast ¼uˆ1uˆ2. All variances Figure4.—Isolation with migration.
(a) The mean and the standard devia-tion of the ˆuispectrum that is observed in simulations (n¼30, 104replicates) of
a standard model or of an isolation with migration model (two populations equally sampled,na¼nb¼15 that were
a single ancestral panmictic population at timeTi¼3). In both sampling migra-tion rates between the two populamigra-tions (M ¼ 0.1 and M ¼ 1), the observed trend is similar: an excess of ˆu15, though
much stronger forM ¼ 0.1. (b) Left, the weight vector of a new neutrality test (Tv) that focuses its sensitivity on
i¼ 15. The weight vector used here is
Vi¼ 30
i
0:530=P
j 30
j
0:5301=30,
where30i 0:530is obtained using a
of all estimators can be computed either using this framework or from their previous derived analytical formula. The same should be true for allt. Importantly, the computation off,f*,y, andy* revealed differences between both methods. Simulations demonstrate that the previous formulas were not correct while the new ones are. Besides a minor error in thefandf* variance (corrected in Simonsenet al.1995), it appears that the
Cov[p, j1] that was derived by Fu and Li (1993b) is
inexact. Therefore the variances offandf* (Fuand Li
1993b) as well as the variances ofyandy* (Achaz2008)
that were using this covariance carried along the error. Framed within the model presented here, all variances are correct. Finally, it can be used to compute the variance ofhthat was not given by the authors (Fayand
Wu2000).
One potentially interesting development is to find an
v-vector that minimizes variance of the associated estimator ofu. This problem was previously addressed thoroughly (Felsenstein1992a,b; Fuand Li1993a; Fu
1994a,b). Indeed, it was shown that phylogenetic esti-mates have lower variance than estimators based on sum-mary statistics (Felsenstein1992b; Fuand Li1993a; Fu
1994b). Moreover, Fu (1994a,b) proposed a general
method to find weight vectors that minimize the var-iance of the estimators and showed that the best vector actually depends on the value ofuitself. Nonetheless, it remains true that some estimators have less variance than others (i.e., ˆuS vs.uˆp), whatever is the value ofu.
This latter observation suggests that re-exploring this question of minimizing the variance may be of interest. Nawa and Tajima (2008) recently proposed to use
the ˆu* spectrum instead of the classical frequencyi spectrum as a visual test for neutrality. This can be extended to the unfolded ˆui spectrum if an outgoup is available. The study presented here fully supports this idea. The visual inspection of the ˆui spectrum indicates why some tests will reject neutrality. Contrary to what intuition may suggest, when one is interested inu -esti-mation, the appropriate representation for weight vectors is the v-vector as defined above rather than weights on thejithemselves (or on thehias in Tajima 1997).
When an outgroup is used to unfold the spectrum, the choice of the appropriate outgoup is of critical importance. If the outgroup is not adequate (too distant
or too close), misoriented sites will have a disastrous effect on u-estimations and therefore on related neu-trality tests (Baudryand Depaulis2003). This adds to
the difficulty of using tests based on the fullj-spectrum. However, when low and high frequencies can be sorted apart, much power is gained in terms of choosing the adequate evolutionary scenario. For example, no high frequencies are overrepresented under recent growth or severe bottlenecks.
Specific problems that concern only some area of the spectrum can be handled easily by setting to 0 all weights in the suspicious area. For example, the sequencing errors can be avoided when the singletons are ignored (Achaz2008). With the current framework, by ignoring
the low-frequency polymorphisms, the ascertainment bias can be overcome and the pattern expected from selection at the lactase gene appears. This strategy has endless extensions as long as we have some prior knowledge of the suspicious area.
Finally, I think that this framework opens the door for new estimations of u and the related neutrality tests. Using simple examples, I show how the power of neutrality tests can easily be improved to detect devia-tions from the standard model. To optimize the power of the future new tests, one could (1) minimize their variance under the standard model, (2) select their area of sensitivity on the basis of prior knowledge of the impact of specific deviations, and (3) use recombina-tion estimates to compute smaller confidence intervals (Wall 1999) (because recombination results in
quasi-independent replicates that lower the variance of the
u-estimators). By building specific tests that will be sensitive to specific deviations, one could envision how several selected tests will be able to help the population geneticist to choose between different possible scenar-ios for a given data set. Another interesting alternative would be to use the differentu-estimators as summary statistics to infer the best parameters for a given evolutionary scenario (e.g., using ABC analysis).
The source code for this study was designed as a C11 library for the simulations and a C library for sequence analysis and is available upon request. A dedicated web version of the tests is available at http://wwwabi.snv.
jussieu.fr/achaz/neutralitytest.html. Furthermore, the
tests will be incorporated in a future release of DNAsp.
I thank F. Tajima, E. P. C. Rocha, J. Wakeley, P. Nicolas, and D. Higuet for their interesting comments on the manuscript and T. Treangen for English language improvement. I also thank two anonymous reviewers for their constructive comments. This work was supported by grant 07-GMGE-004-04 from the Agence Nationale de la Recherche.
LITERATURE CITED
Achaz, G., 2008 Testing for neutrality in samples with sequencing
errors. Genetics179:1409–1424.
Baudry, E., and F. Depaulis, 2003 Effect of misoriented sites on
neutrality tests with outgroup. Genetics165:1619–1622. Bersaglieri, T., P. C. Sabeti, N. Patterson, T. Vanderploeg, S. F.
Schaffneret al., 2004 Genetic signatures of strong recent
pos-TABLE 3
Neutrality tests in the lactase region
Population D D2* F* TV*
CEU 0.16 0.81 0.48 1.79*
CHB 2.04* 1.97** 2.29* 0.25
JPT 0.92 2.22** 1.93* 0.28
YRI 1.00 2.18** 1.94* 0.04
itive selection at the lactase gene. Am. J. Hum. Genet.74:1111– 1120.
Clark, A. G., M. J. Hubisz, C. D. Bustamante, S. H. Williamsonand
R. Nielsen, 2005 Ascertainment bias in studies of human
genome-wide polymorphism. Genome Res.15:1496–1502. Depaulis, F., and M. Veuille, 1998 Neutrality tests based on the
dis-tribution of haplotypes under an infinite-site model. Mol. Biol. Evol.15:1788–1790.
Depaulis, F., S. Moussetand M. Veuille, 2001 Haplotype tests
us-ing coalescent simulations conditional on the number of segre-gating sites. Mol. Biol. Evol.18:1136–1138.
Fay, J. C., and C. I. Wu, 2000 Hitchhiking under positive Darwinian
selection. Genetics155:1405–1413.
Felsenstein, J., 1992a Estimating effective population size from
samples of sequences: a bootstrap Monte Carlo integration method. Genet. Res.60:209–220.
Felsenstein, J., 1992b Estimating effective population size from
samples of sequences: inefficiency of pairwise and segregating sites as compared to phylogenetic estimates. Genet. Res. 59:
139–147.
Fu, Y. X., 1994a Estimating effective population size or mutation
rate using the frequencies of mutations of various classes in a sample of DNA sequences. Genetics138:1375–1386.
Fu, Y. X., 1994b A phylogenetic estimator of effective population
size or mutation rate. Genetics136:685–692.
Fu, Y. X., 1995 Statistical properties of segregating sites. Theor.
Pop-ul. Biol.48:172–197.
Fu, Y. X., 1996 New statistical tests of neutrality for DNA samples
from a population. Genetics143:557–570.
Fu, Y. X., 1997 Statistical tests of neutrality of mutations against
pop-ulation growth, hitchhiking and background selection. Genetics
147:915–925.
Fu, Y. X., and W. H. Li, 1993a Maximum likelihood estimation of
population parameters. Genetics134:1261–1270.
Fu, Y. X., and W. H. Li, 1993b Statistical tests of neutrality of
muta-tions. Genetics133:693–709.
Hudson, R. R., 1993 The how and why of generating gene
geneal-ogies, pp. 23–36 inMechanism of Molecular Evolution.Sinauer As-sociates, Sunderland, MA.
Kuhner, M. K., P. Beerli, J. Yamato and J. Felsenstein,
2000 Usefulness of single nucleotide polymorphism data for es-timating population parameters. Genetics156:439–447. Markovtsova, L., P. Marjoramand S. Tavare´, 2001 On a test of
Depaulis and Veuille. Mol. Biol. Evol.18:1132–1133.
Nawa, N., and F. Tajima, 2008 Simple method for analyzing the
pat-tern of DNA polymorphism and its application to SNP data of human. Genes Genet. Syst.83:353–360.
Nielsen, R., and J. Wakeley, 2001 Distinguishing migration from
isolation: a Markov chain Monte Carlo approach. Genetics
158:885–896.
Nielsen, R., M. J. Hubiszand A. G. Clark, 2004 Reconstituting the
frequency spectrum of ascertained single-nucleotide polymor-phism data. Genetics168:2373–2382.
Nielsen, R., S. Williamson, Y. Kim, M. J. Hubisz, A. G. Clarket al.,
2005 Genomic scans for selective sweeps using SNP data. Genome Res.15:1566–1575.
Ramos-Onsins, S. E., and J. Rozas, 2002 Statistical properties of
new neutrality tests against population growth. Mol. Biol. Evol.
19:2092–2100.
Ramos-Onsins, S. E., S. Mousset, T. Mitchell-Oldsand W. Stephan,
2007 Population genetic inference using a fixed number of seg-regating sites: a reassessment. Genet. Res.89:231–244.
Simonsen, K. L., G. A. Churchill and C. F. Aquadro,
1995 Properties of statistical tests of neutrality for DNA poly-morphism data. Genetics141:413–429.
Tajima, F., 1983 Evolutionary relationship of DNA sequences in
fi-nite populations. Genetics105:437–460.
Tajima, F., 1989 Statistical method for testing the neutral mutation
hypothesis by DNA polymorphism. Genetics123:585–595. Tajima, F., 1997 Estimation of the amount of DNA polymorphism
and statistical tests of the neutral mutation hypothesis based on DNA polymorphism, pp. 149–164 inProgess in Population Ge-netics and Human Evolution.Springer-Verlag, Berlin/Heidelberg, Germany/New York.
Tishkoff, S. A., F. A. Reed, A. Ranciaro, B. F. Voight, C. C. Babbitt
et al., 2007 Convergent adaptation of human lactase persistence in Africa and Europe. Nat. Genet.39:31–40.
Wakeley, J., 2009 Coalescent Theory, an Introduction. Roberts and
Company. Greenwood Village, Colorado.
Wakeley, J., R. Nielsen, S. N. Liu-Cordero and K. Ardlie,
2001 The discovery of single-nucleotide polymorphisms–and inferences about human demographic history. Am. J. Hum. Genet.69:1332–1347.
Wall, J. D., 1999 Recombination and the power of statistical tests of
neutrality. Genet. Res.74:65–79.
Wall, J. D., and R. R. Hudson, 2001 Coalescent simulations and
sta-tistical tests of neutrality. Mol. Biol. Evol.18:1134–1135. Watterson, G. A., 1975 On the number of segregating sites in
ge-netical models without recombination. Theor. Popul. Biol. 7:
256–276.
Supporting Information
http://www.genetics.org/cgi/content/full/genetics.109.104042/DC1
Frequency Spectrum Neutrality Tests: One for All and All for One
Guillaume Achaz
G. Achaz 2 SI
TABLE S1
Variance of neutrality tests (θ= 10, n = 30, 105 replicates)
Test Publication Original Derivation Current Framework Simulation
d TAJIMA (1989) 8.21 8.21 8.24
d2 FU and LI (1993b) 25.83 25.83 25.89 d2* FU and LI (1993b) 34.47 34.47 34.58
h FAY and WU (2000) na 39.96 39.55
f * FU and LI (1993b) 61.44 63.84 63.98
f FU and LI (1993b) 49.59 51.85 51.83
y* ACHAZ (2008) 7.72 5.81 5.80
y ACHAZ (2008) 7.40 6.18 6.17
Please note that for F *, the typo FU and LI (1993b) equation was corrected, as it is