Theory of Time-Resolved Somatic Complementation and Its Use to Explore
the Sporulation Control Network in
Physarum polycephalum
Wolfgang Marwan
1Institut fu¨r Biologie III, Albert-Ludwigs-Universita¨t, 79104 Freiburg im Breisgau, Germany Manuscript received August 20, 2002
Accepted for publication January 9, 2003
ABSTRACT
Mutants of Physarum polycephalum can be complemented by fusion of plasmodial cells followed by cytoplasmic mixing. Complementation between strains carrying different mutational defects in the sporula-tion control network may depend on the signaling state of the network components. We have previously suggested that time-resolved somatic complementation (TRSC) analysis with such mutants may be used to probe network architecture and dynamics. By computer simulation it is now shown how and under which conditions the regulatory hierarchy of genes can be determined experimentally. A kinetic model of the sporulation control network is developed, which is then used to demonstrate how the mechanisms of TRSC can be understood and simulated at the kinetic level. On the basis of theoretical considerations, experimental parameters that determine whether functional complementation of two mutations will occur are identified. It is also shown how gene dosage-effect relationships can be employed for network analysis. The theoretical framework provided may be used to systematically analyze network structure and dynamics through time-resolved somatic complementation studies. The conclusions drawn are of general relevance in that they do not depend on the validity of the model from which they were derived.
C
OMPLEMENTATION is the production of a wild- (Burlandet al.1993). The plasmodial nuclear popula-type phenopopula-type when two recessive mutant alleles tion is perfectly synchronous regarding cell cycle and are united in the same cell (Griffiths et al. 1999). differentiation (Gutteset al.1961;Ruschet al.1966). Genetic complementation tests can be performed either Since plasmodia of identical fusion type spontaneously by crossing of two homozygous mutant strains of an fuse upon physical contact (Poulter andDee 1968), experimental organism or by fusion of cells of two mu- heterokaryons from cells of otherwise different geno-tants through heterokaryon formation as it occurs,e.g., type can be easily obtained and used to analyze signaling in fungi. In such heterokaryons, two nuclear popula- events by time-resolved somatic complementation (TRSC; tions mix and although the individual nuclei originating Starostzikand Marwan1998). Since plasmodia of al-from the two parent strains do not fuse, their gene most any relative size may be fused with each other, products certainly mix, providing the biochemical basis network components can be easily titrated and the rela-for the complementation effect. Using the photosensory tive dosages of the corresponding genes can be fine control of sporulation in Physarum polycephalum as an tuned. In an earlier study, complementation of plasmo-example, we have shown that production of a wild-type dial strains by fusion was successfully performed with phenotype by heterokaryon formation may depend on temperature-sensitive mutants impaired in growth, via-the time-dependent physiological state adopted after bility, and nuclear replication (Laffleret al.1979). pathway activation in one of the mutant fusion partners Its life cycle makesP. polycephaluma genetic organism and suggested that such effects can be used to systemati- (Burlandet al.1993). Under natural conditions, mat-cally analyze the architecture and dynamics of molecular ing of two haploid uninuclear myxamoebae results in and genetic networks (StarostzikandMarwan1998; the formation of a diploid zygote that develops into a MarwanandStarostzik2002). In the present work Idiploid plasmodium. In contrast, amoebae that carry the provide a theoretical framework for the evaluation and
gadAh mutation can develop apogamically into a
hap-design of time-resolved somatic complementation
ex-loid multinuclear plasmodium (Wheals1970; Ander-periments.
son and Truitt 1983; Figure 1A). After mutagenesis
P. polycephalum is a protist that in the course of its
of gadAh amoebae, haploid mutant plasmodia can be
life cycle forms multinuclear giant single cells, so-called
obtained and screened for both dominant and recessive plasmodia that can be grown to almost any desired size
mutations without the need to generate homozygous diploids (CookeandDee1975).
Plasmodia have an unlimited replicative potential and
1Address for correspondence:Institut fu¨ r Biologie III,
Albert-Ludwigs-grow as long as nutrition is available. Starving plasmodia
Universita¨t, Scha¨nzlestrasse 1, 79104 Freiburg im Breisgau, Germany.
E-mail: [email protected] become competent for the induction of sporulation by
Figure 1.—Plasmodial development and sen-sory control of sporulation inPhysarum polycepha-lum.(A) Scheme of the life cycle ofP. polycephalum during apogamic development. Spores (1) germi-nate to give a haploid, mononuclear amoeba (2), which propagates by mitotic cell division. At high population density, amoebal cells may develop into a haploid, multinuclear plasmodium (3). Fol-lowing growth and starvation, the plasmodium can be induced to sporulation by visible light. Several hours after commitment the plasmodial protoplasmic mass splits and develops into many individual fruiting bodies. Mature fruiting bodies (4) finally release ripe, haploid spores (1). Note that the life cycle of the wild type usually is diploid and mating of two haploid amoebae then is a prerequisite for plasmodial development and allows genetic analyses. However, to a low extent, viable spores can also be recovered from a very small population of homozygous diploid nuclei in an otherwise haploid plasmodium (Laffler andDove1977). (B) Sensory control of sporula-tion by starvasporula-tion and far-red light. Sporulasporula-tion of starved, competent plasmodia is triggered by a short pulse of far-red light (FR) through photo-conversion of the phytochrome photoreceptor (Pfr) into its active state (Pr). IfPris reconverted toPfr by red light before a sufficient amount of theX-signal is formed, the plasmodium will not sporulate. IfPrand the starvation signal together are present at least for some hours, the plasmo-dium is committed to sporulation by accumulation of a sufficient amount of morphogenetic signal (S). The morphogenetic signal can be assayed through its ability to cause sporulation of incompetent plasmodia. Note that only the phytochrome-dependent pathway is shown. This scheme was adapted fromStarostzikandMarwan(1995a). (C) Plasmodia pass through several physiological stages prior to sporulation. When the nutrient source is exhausted, plasmodia stop growing and develop sporulation competence during several days of starvation. Competent plasmodia are induced if exposed to visible light. After induction it takes several hours (⌬t) until a plasmodium loses its unlimited replicative potential (symbolized by the oval arrows) and is irreversibly committed to sporulation. Growing, competent, or induced plasmodia (or small explanted pieces of them) resume growth if supplied with nutrients like glucose. Beyond the point of no return (PNR) committed plasmodia do not resume growth upon transfer to glucose-containing medium; instead the visible developmental program of sporulation is initiated several hours later. (D) After induction of sporulation there is a premorphogenetic phase without any visible changes in the plasmodial morphology. Morphogenesis starts atⵑ10 hr after induction when the plasmodial strands break up into small nodular structures (nodulation stage). Each nodule culminates and differentiates into a melanized fruiting body that is made up of different cell types. Finally, haploid single nuclear spores are formed in the sporangium by meiotic cleavage of the multinuclear protoplasmic mass. Plasmodial commitment (PNR) occurs in the middle of the premorphogenetic phase. This scheme was adapted from StarostzikandMarwan(1998).
visible or UV light, heat shock, or other stimuli (Sauer come irreversibly committed to sporulation (Figure 1C). Until that so-called point of no return, quenching the
et al.1969). Light stimuli are perceived independently
by a blue light photoreceptor or by phytochrome, which starvation signal by feeding glucose can still prevent irreversible commitment and no visible response to the is the photoreceptor for far-red light (Starostzikand
Marwan1995b;LamparterandMarwan2001). Star- otherwise inductive light stimulus occurs (Chapman andCoote1982; Figure 1, B and C). In committed cells vation and photoreceptor activation or heat shock are
integrated in parallel pathways (Figure 1B; only the far- a cascade of differentially regulated genes that contrib-ute to the many new proteins required for fruiting body red-dependent pathway is shown). Gain of sporulation
competence by starvation involves sporulation-promot- formation is expressed (Putzer et al.1984;Martelet al. 1988). About 4 hr after passing the point of no ing factors like Ca2⫹ and malate that confer autocrine
signaling (Renzelet al. 2000), the induction of nitric return, visible morphogenesis starts by cleavage of the plasmodial strands into nodular structures that culmi-oxide synthase (NOS), and the activation of a guanylate
cyclase through a nitric oxide (NO)-dependent pathway nate and finally form the fruiting body that contains the ripe, haploid spores (Figure 1D;Gutteset al.1961; (Goldereret al.2001).
When induced by a short light pulse (dependent on Nishibayashiet al. 1987). After being released, these spores can germinate under suitable conditions to give the photon exposure; several minutes can be sufficient)
it takes on average 4–6 hr until competent plasmodial amoebae that again can develop into a plasmodium (Figure 1A).
be-Figure 2.—Time-resolved somatic comple-mentation by fusion of two mutant plasmodia. (A) Experimental procedure. The ␣-plasmo-dium is exposed to a short pulse of far-red light (flash symbol) and is further incubated in the dark for a certain delay time⌬t. The exposed plasmodium is then fused to a second (-)plas-modium that has not been exposed to any light. After fusion, the heterokaryon is main-tained in the dark until the developmental de-cision is visible. (B) Scheme of the time course of signaling processes occurring before and after fusion of two plasmodial mutant cells. Dots indicate the activation of successive sig-naling intermediates in the␣-plasmodium be-fore fusion and in the resulting heterokaryon. Blocks due to dominant negative mutations (⫻) persist in the presence of the correspond-ing wild-type gene product contributed by the fusion partner, while recessive blocks (/) dis-appear. Signaling ends successfully only if the dominant block is upstream of the recessive (right) and if signaling in the ␣-plasmodium carrying the recessive mutation has bypassed the dominant block in the-plasmodium be-fore fusion (open arrow) occurs. There is no sporulation of the heterokaryon if the domi-nant negative mutant is irradiated (left).
We have shown experimentally that TRSC may occur that prevents the light-induced plasmodium from sporu-lation on its own is removed by contributing the wild-by fusion of induced with noninduced plasmodia that
type gene product from the dominant negative mutant. carry different mutational defects in the sporulation
In the heterokaryon, the dominant negative block still control network (Figure 2A). When a mutant strain that
persists, but does not block the ongoing downstream carries a dominant negative block in the
light-depen-events. Since complementation will work only if the dent sporulation control (pho-1) is irradiated (夝) and
dominant negative block is upstream of the recessive subsequently fused to a plasmodium (vac-1) carrying a
one, this type of experiment indicates the regulatory block through recessive mutation at another step of the
hierarchy of genes and their products within the net-same pathway, the heterokaryonpho-1夝 ⫹ vac-1 does
work. not sporulate because of the dominant negative effect
To provide a theoretical framework for the interpreta-of thepho-1mutation (Figure 2, left).When in contrast
tion of complementation effects and for the experimen-the plasmodium carrying experimen-the recessive mutation is
irra-tal design in network analysis, we consider the kinetics diated and after a delay time⌬tfused with the
nonirradi-of mutant complementation as it occurs when the cyto-ated dominant negative mutant (vac-1夝 ⫹pho-1), the
plasms of two cells mix. We first develop a kinetic mini-probablilty that the heterokaryon will sporulate
continu-mal model of the sporulation control network that ac-ously increases with⌬telapsed between light stimulation
counts for the experimental results obtained through of the recessive mutant and the fusion event (Marwan
physiological characterization of wild-type plasmodia. andStarostzik2002). It was concluded that the
time-In turn, the properties ofin silicomutants of this model dependent loss of the dominant negative effect ofpho-1
network and their behavior during TRSC experiments is caused by bypassing the dominant negative mutation
are analyzed. By computer simulation we show how the by the signaling processes that occur in the fusion
part-regulatory hierarchy between genes can be determined ner carrying the recessive mutation (Figure 2B, right).
and how the experiments are designed that allow for this How can a dominant negative mutation be bypassed?
conclusion. Although the simulations were performed If fusion occurs at an early stage the heterokaryon does
using the kinetic model for sporulation control, these not sporulate because no signaling intermediate
down-conclusions do not depend on the validity of the model stream of the dominant negative block has been
acti-from which they were derived. vated and signaling hence cannot proceed along the
pathway. However, if plasmodia fuse after signaling in the light-induced recessive mutant has already
pro-RESULTS ceeded beyond the step that correspondingly is blocked
ble only until the point of no return has been passed and the plasmodium has lost its unlimited replicative potential and is irreversibly committed to sporulation (Figure 1C and see below).
In committed plasmodia, the entire cytoplasmic mass synchronously and completely develops into fruiting bodies. This synchronous all-or-none behavior holds un-der experimental conditions where the induction to sporulation occurs stochastically. If starved plasmodia are exposed to a nonsaturating inductive light pulse that causes sporulation of only a certain percentage of a plasmodial population, the developmental decision is all or none. The same holds for far-red light-induced Figure3.—Kinetic model for the sensory control of
sporula-tion inPhysarum polycephalum. Two inputs, far-red light and plasmodia that are exposed to red light or feeding with glucose, control the developmental switch circuit through for- glucose at time points where part of the population is mation of the sporulation signalS. Functional elements are already committed to sporulation. This behavior indi-indicated to make the structure of the network more easily
cates the existence of a developmental switch that is comprehensible. Photoreceptor- and glucose
sensor-depen-active throughout the entire plasmodium and that has dent pathways are integrated by a mechanism behaving like
a logic AND gate (StarostzikandMarwan1994). The out- to be considered as an essential component of any ki-put of this type of boolean logic element is true only if two netic model of sporulation control.
input signals are present. The behavior of the toggle switch The experimental results described above can be sim-has been described byGardneret al. (2000). Transcription
ulated by the following kinetic model of the sporulation of geneSis repressed by the product of geneVin a cooperative
control network (Figure 3). Far-red light converts the manner while the product of geneSrepresses the transcription
of V. According to Gardner et al. (2000), the changes in physiologically inactive Pfr form of phytochrome into concentrations ofSandVwithin the toggle switch circuit are the activePr form.Prdecays thermally into an inactive d[S]/dt⫽ ␣1/(1⫹[V])⫺Sandd[V]/dt⫽ ␣2/(1⫹[S]␥)⫺ form (LamparterandMarwan2001). Alternatively,P
r V, where␣1and␣2are the synthesis rates ofSandV,
respec-catalyzes the formation of the activeX-signal (Xa) from tively, in the absence of any repressor and and ␥are the
its inactive precursor (Xi).Xais reconverted to its inactive Hill coefficients for the repression of the synthesis rates byV
possi-TABLE 1
Differential equations describing the kinetic model for the sensory control of sporulation inPhysarum
polycephalumshown in Figure 3
d[Pfr]
dt ⫽ ⫺Ifrφfr[Pfr]⫹Irφr[Pr] d[Pr]
dt ⫽Ifrφfr[Pfr]⫺Irφr[Pr]⫺kd[Pr] d[Xi]
dt ⫽ ⫺kia[Pr][Xi]⫹kai[Xa] d[Xa]
dt ⫽kia[Pr][Xi]⫺kai[Xa] d[prepreS]
dt ⫽ ⫺kx[Xa][prepreS] Figure 4.—Suppression of sporulation of far-red light- d[preS]
dt ⫽kx[Xa][prepreS]⫺ky[Ya][preS] exposed plasmodia by a subsequent red light pulse (䉲,ⵜ) or
feeding of glucose (䊉,䊊) at different delay time⌬tafter the
far-red pulse. Experimental data are taken fromStarostzik d[S]
dt ⫽ky[Ya][preS]⫹ ␣1
1⫹[V]3⫺[S] and Marwan(1995a; open symbols) and simulated results
(solid symbols) are shown. A total of 600 plasmodia were d[V] dt ⫽
␣2
1⫹[S]3⫺[V] simulated for each data point.
d[Ya]
dt ⫽ ⫺kG[Glucose][Ya]
of sufficient intensity, formation ofSfrom preS inhibits Kinetic simulations were performed by numerical integra-the transcription of geneV. Inhibition either is transient tion of the differential equations using the Runge-Kutta algo-or triggers the toggle switch. In the latter case, the switch rithm implemented by the ModelMaker 4.0 software (Cherwell
Scientific, Oxford). assumes a state whereS is high and the transcription
of gene V is continuously repressed. Switching from highV, low Sto low V, highSresults in the transition
thus gives the simulated percentage of sporulated plas-from the vegetative stage to sporulation, respectively.
modia in response to a given treatment. As shown in Figure 4, the kinetic model qualitatively
The experimental result that in those far-red light and quantitatively simulates the threshold-like response
(FR)-induced plasmodia, where the signaling processes of plasmodia to far-red light. The model also accounts for
have proceeded so far that sporulation cannot be pre-the response of far-red-induced plasmodia to red light
vented by red light (R) any more (at 2 hr after the far-red and to glucose (Figure 4; for details see below). The set
pulse), feeding with glucose still completely prevents of differential equations describing the model is given
sporulation (Figure 4; Starostzik and Marwan in Table 1 and the parameter values used for simulation
1995a), puts a strong constraint on the minimum num-of the experimental results are listed in Table 2.
ber of steps betweenXaandS. To simulate the kinetics In experiments where the effectiveness of light or
of the FR→⌬t→glucose experiment, while also meet-other factors in causing sporulation is titrated, the
read-ing the FR→⌬t→Rkinetics, at least one step (preS) out is the percentage of plasmodia that sporulate in
betweenSand itsXa-controlled precursor (prepreS) had response to the treatment. The above-mentioned all- to be incorporated into the model.
or-none behavior of the plasmodia is due to a stochastic The bistable behavior of the toggle switch in response phenomenon. To generate a stochastic readout in the to far-red light is shown in Figure 5A. After induction model, the concentration of at least of one of the com- by far-red light, the level ofSincreases by formation of ponents had to be taken from a probability distribution. extraSfrom preS. Whether or not addition of glucose Exponential distribution ofYain individual plasmodia will prevent sporulation depends on whether a suffi-gave the best result in Monte Carlo simulations. Whether ciently high amount ofShas been formed to suppress
Sor Vfinally wins after a pulse of light or addition of the transcription of V to an extent that the switch is glucose then depends on which particular value ofYa triggered (and S wins over V). If this is not the case, is randomly taken for the individual plasmodium from the rise inS is only transient andSdecays to its lower the probability distribution, while all other parameters steady-state level (above zero). If glucose is delivered so are kept constant. To simulate the response of a plasmo- late that a certain threshold level ofShas been passed dial population, the model is run many times (once for (Figure 5B, inset), although formation ofSfrom preS each individual plasmodium) for a given parameter set (phase a in Figure 5B) drops (phase b), the switch is and the percentage of runs whereSfinally wins (sporula- nevertheless triggered and continuous formation ofS
TABLE 2
Model parameters used for simulation
Parameter Value Parameter Value
[Pfr] 10 kd 0.1
[Pr] 0 kia 0.1
[Xi] 6 kai 0.8
[Xa] 0 kx 0.2
[prepreS] 200 ky 1
[preS] 0 kG 0.1
[S] 0 ␣1 30
[V] 50 ␣2 50
[Ya] 0.9
Ifrfrφfr 0.1 Irrφr 0
The initial values at time zero are given. In each simulation, the toggle switch was preequilibrated for 5 hr before stimula-tion of the plasmodia. Pulses of far-red light were 0.25 hr and those of red light 0.33 hr in length. Glucose concentration was either 0 or 1.
bistable state of the switch. As shown in Figure 4, model calculations mimic qualitatively and quantitatively the experimental data obtained on far-red light-exposed plasmodia that were subsequently exposed to red light or glucose.
Gene dosage-effect curves:We have developed a ki-netic minimal model that explains the plasmodial
re-sponse to far-red light, the time-dependent loss of pho- Figure5.—Kinetics of sporulation signal formation in re-sponse to network activation. (A) Time course of the sporula-torevertability of the induction by red light, and the
tion signal in a starved, competent plasmodium in response time-dependent loss of the potential of glucose to
sup-to a far-red pulse of various intensities (phosup-ton exposure). press the developmental decision to sporulate. Experi- Numbers indicate the relative pulse intensity (⫻10⫺2). Far-mentally we have recently shown that by fusing a plasmo- red pulses below threshold (2, 4) cause a small and transient dium carrying a recessive mutation with a plasmodium increase in the concentration ofS, which is due to the decay of preS before it returns to the dark level (0). Above threshold that exhibits a dominant negative effect in a
heterokar-(6–10), additionalSis formed through the toggle switch circuit yon (see Introduction for details), the sequence of
regu-and a new bistable steady state (highS, lowV) is assumed, latory events controlled by the two genes can be deter- which is now independent of either far-red light or glucose. mined if the complementation testing is performed in (B) Quenching of the sporulation signal in far-red light-a time-dependent mlight-anner (Marwanand Starostzik exposed plasmodia by glucose. The time course of the sporula-tion signal in response to a saturating far-red pulse (relative 2002). Now we investigate whether our model can be
photon exposureIfrfrφfr⫽0.4) was calculated and the addition used to simulate such an experiment,i.e., the fusion of
of glucose at different time points (1–10 hr) after the far-red a dominant negative and a recessive mutant plasmo- pulse was simulated. Until 2 hr after far-red exposure the dium. As a prerequisite we need to generate anin silico sporulation signal is completely quenched by glucose. At later
mutant that exhibits a dominant negative effect. A muta- times (3–10 hr) quenching of preS decay by glucose still occurs but not to an extent required to suppress switching. The time tion may behave dominant negative for different
rea-course ofSfor the addition of glucose at 3 hr after the far-sons (see discussionfor details). The mechanistically
red pulse is shown in the inset [numbers on the abscissa simplest way is that a loss-of-function mutation (and indicate the time elapsed after the FR pulse (hours)]. Before those are most frequently obtained in the lab) displays glucose is added (a) S is formed by light-induced decay of a phenomenon called “haplo-insufficiency,” which char- preS and to a small extent also through the toggle switch circuit. After addition of glucose (b) decay of preS is sup-acterizes the fact that half of the wild-type level of a
pressed andSdecays more quickly than it is formed, untilS gene product is not sufficient to maintain a wild-type
finally wins (c) and the toggle is switched. phenotype. In silico mutation of which of our model
components could cause a haplo-insufficient
After the two cytoplasms have mixed, the developmental decision,i.e., whether sporulation of the heterokaryon occurs or not, is evaluated. Experimentally, we have shown that complementation of the mutational defects of two plasmodia affecting different elements of the sporulation control network depends on (1) to what degree the mutations are dominant or recessive, (2) which of the two plasmodia is irradiated, and (3) the time interval⌬telapsed between irradiation and fusion (MarwanandStarostzik 2002).
What happens kinetically in terms of signaling if two mutant plasmodia, one light induced and one not irradi-ated, fuse? How do the signaling processes proceed while the cellular content of the light-activated plasmo-dium mixes with the noninduced plasmoplasmo-dium and how do the different mutations in the signaling pathways of the two plasmodia interfere with these processes? For simplicity let us first consider a situation where two plasmodia that have not been stimulated by light fuse. When the contents of the two plasmodia are identical, the concentration of each individual compound does not change upon cytoplasmic mixing. Now assume that one plasmodium expresses green fluorescent protein (taken for a wild-type gene product) and the other red fluorescent protein (taken for a mutant gene product); then the green fluorescent protein (GFP) evenly spreads over the fused plasmodium as does red fluorescent pro-tein (RFP) and once mixing is complete, both propro-teins are equally distributed in both plasmodial halves and Figure6.—Simulated response of starved, competent plas- are only half as concentrated as before fusion occurred modia with different cellular concentrations ofXi(A) orYa (provided the two plasmodia have been of equal size). (B) before application of a saturating far-red pulse.
In a first approximation to this, the two plasmodia are formally treated as two compartments, the contents of which mix with a first-order kinetics, which means that the probability of one molecule traveling from one plas-cording to those curves, the reduction of the dosage of
modial half to the other depends on the number of geneX and hence its product from wild-type level to
molecules present in this half. The flow rate of any 50% of wild type could reduce the percentage of
sporu-componentXjfrom one plasmodial compartment (␣) to lating plasmodia from close to 100% to zero, while re- the other () is thend[X
j␣]/dt⫽ ⫺kmix[Xj␣]⫹kmix[Xj], duction of the dosage of the Y protein would either where [X
j␣] is the concentration of the compontent cause no effect on the phenotype or reduce the number X
j in the plasmodial compartment␣, from which it is of sporulating plasmodia at maximum by 50%. Notably, transported into the compartment, and [X
j] is the the simulation demonstrates that a protein that acts concentration of the componentX
jthat has been trans-downstream of a protein that has a highly nonlinear ported into the plasmodiumand that now equilibrates and threshold-type dosage effectiveness (Xa) and at the with the ␣-plasmodium, until the two cytoplasms are same time upstream of a highly nonlinear element (the completely mixed (andd[X
j␣]/dt⫽ 0; Figure 7). The toggle) can still reflect its mechanism of action by pro- rate constantk
mixaccounts for the active and vigorous ducing a hyperbolic (Michaelis-Menten type) dosage- cytoplasmic streaming that drives mixing.
effect curve at the final output (i.e., sporulation). We In such a system, there are two types of flows between now use loss-of-function mutations in these two genes the pools of each individual compound. One type of (XandY) for simulation of the TRSC experiment. flow is due to physical mixing of the two cytoplasms Modeling TRSC by fusion of two plasmodia: The (Figure 7, solid arrows), and the other (open arrows) basic scheme of a TRSC experiment is shown in Figure is due to the ongoing biochemical interactions during 2A. One plasmodium is exposed to a stimulus light signaling. During a TRSC experiment the two types of pulse. A certain delay time⌬tafter the pulse, the light- flows are superimposed. How realistic the simulation is exposed plasmodium (termed as the␣-plasmodium) is depends on how precisely the mixing kinetics of the
Figure7.—Scheme illustrating the change in concentration of signaling intermediates during a time-resolved somatic com-plementation experiment. Open arrows indicate biochemical reactions, solid arrows indicate the physical flow of compo-nents between the two fused plasmodia due to cytoplasmic
mixing. Empty open rectangles indicate signaling components Figure8.—Simulation of a time-resolved somatic comple-deleted by mutation, which are resupplied through fusion of mentation experiment by fusion of two plasmodia, one car-␣- and -plasmodia, thus allowing the signaling pathway to rying a dominant (X⫺) and the other a recessive (Y⫺)in silico
end successfully. null mutation of the genes encoding the componentsXand
Yof the model shown in Figure 3. A total of 150 plasmodia were simulated for each data point. Dominance (D) and reces-siveness (R) of the mutations are indicated in parentheses for The sequence of regulatory events indicated by fusion each experimental regime. Dotted lines were drawn to guide of plasmodia carrying dominant and recessive muta- the eye.
tions:Dominant upstream recessive:As shown by the gene product dosage-effect curves (Figure 6),in silicodeletion
ofXis expected to exhibit a dominant negative effect prior to fusion to be converted toS. The resulting pulse in TRSC experiments while deletion of Ya should be inSconcentration triggers the toggle switch and causes recessive. For simulation of TRSC these two mutations sporulation. As shown in Figure 8, the dominant nega-were chosen. When X⫺ was irradiated and fused with tive effect of X⫺is gradually lost with increasing⌬t, as
Y⫺ (X⫺夝 ⫹ Y⫺), the heterokaryon did not sporulate, reflected by the increasing probability that the hetero-independent of the time elapsed between irradiation karyon will sporulate. The kinetics of the curves are and fusion (Figure 8). Before fusion, the activePrphoto- similar to the bypass of the dominant negative pho-1 receptor species is formed by the far-red pulse, but there mutation by the type gene product of either wild-is no activation of the downstream signaling steps be- type or sporulation-deficient vac-1 mutant plasmodia causeXis completely missing due to the loss-of-function (MarwanandStarostzik2002) and referred to in the mutation. After fusion of the two plasmodia has oc- Introduction.
curred, the concentration ofXis not sufficiently high Recessive upstream dominant:As expected from the pre-to allow the formation ofSwith a rate that could trigger vious results, there will be no sporulation if the domi-the toggle switch and hence domi-the plasmodium does not nant mutation is downstream of the recessive one. To
sporulate. simulate this situation, anin silicomutant deleted in the
If the recessive Y⫺ mutant is irradiated and subse- phytochrome photoreceptor (recessive according to the quently fused with the nonirradiated dominantX⫺mu- gene dosage-effect curve) was fused with the dominant tant (Y⫺夝 ⫹X⫺), whether the plasmodium sporulates X⫺ mutant. According to the model calculation, the depends on the delay time⌬telapsed between irradia- resulting heterokaryons did not sporulate irrespective tion and fusion. If fusion occurs at an early time, the of which of the two mutant plasmodia was irradiated wild-type gene productXis withdrawn by the nonirradi- before fusion and irrespective of the delay time⌬t be-atedX⫺mutant so that the formation of preS is reduced tween irradiation and fusion (result not shown). The and as a result,Scannot be produced at a sufficiently simulation accounts for the experimental result ob-high rate to allow switching. If plasmodia fuse later, tained by fusing a nonirradiated wild-type plasmodium then preS in the irradiated plasmodium has already (i.e., no Pr present) with a pho-1 plasmodium, which been formed to a certain extent although the subse- causes no sporulation, or an irradiated pho-1 plasmo-quent step, formation of S catalyzed by Ya (which is dium fused to wild type, which causes no sporulation deleted in the mutant), did not occur. When the irradi- as well (MarwanandStarostzik2002).
TABLE 3
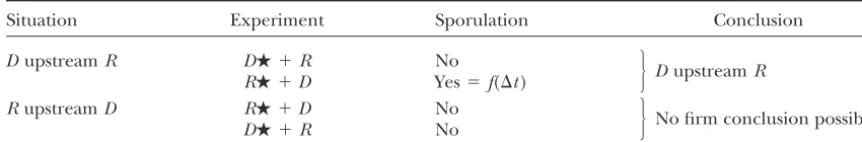
Predicted effect of the relative hierarchy of two steps blocked by dominant (D) or recessive (R) mutation in two mutant strains on somatic complementation capability
Situation Experiment Sporulation Conclusion
DupstreamR D夝⫹R No
冧
DupstreamRR夝⫹D Yes⫽f(⌬t)
RupstreamD R夝⫹D No
冧
No firm conclusion possibleD夝⫹R No
Light stimulation of a mutant plasmodium is indicated by a star.
no complementation is observed upon irradiation of a is an important point since, with ongoing experimental work, the elements of the model step by step will be plasmodium carrying a recessive mutation and
subse-quent fusion with a plasmodium that contributes a dom- replaced by the products of identified genes and the model structure certainly will get more and more com-inant block, the recessive block is either upstream of
the dominant block or downstream but the complemen- plex and must be corrected in an iterative way. This is obviously true for the toggle switch circuit. At present, tation experiment for some unknown reason might not
work. In this case no firm conclusion is possible, unless no information on the molecular mechanism of switch-ing the developmental program of plasmodia is avail-the dominant or recessive properties of avail-the two
muta-tions are changed experimentally (seediscussion). able, although mutants disturbed in the natural all-or-none behavior of the developmental decision have now been obtained (A. Sujathaand W.Marwan,
un-DISCUSSION published results). However, the all-or-none behavior
of sporulation control in wild-type plasmodia as well as We have provided a theory of TRSC and used it for
the fact that a small piece of a committed plasmodium computer simulation of complementation experiments.
can commit a large competent plasmodium when the The computer model was developed to facilitate both
two are fused (Hildebrandt1986; Starostzik1995) the interpretation of experimental results and the
de-clearly suggests the existence of a circuit involving an sign of experiments for molecular network analysis. The
autocatalytic or cooperative mechanism. This conclu-theoretical considerations demonstrate how TRSC opens
sion is supported by the fact that we were not able to a way for the systematic analysis of the architecture and
simulate the sensory control of sporulation just by the dynamics of molecular and genetic networks within a
formation of a sporulation signal in a linear sequence living cell. The corresponding experimental work is
of catalytic events without involving a cooperative and done with plasmodia ofP. polycephalumat the moment,
autocatalytic step. but the approach certainly could be taken in any system
Modeling of TRSC as a tool for network analysis:By where the activity of genes or their products can be
simulation we have demonstrated how the sequence of controlled in a time-resolved manner.
regulatory events tagged by a dominant and a recessive To simulate TRSC and to demonstrate how it can be
mutation can be determined through TRSC. Although employed for the systematic analysis of network
struc-the underlying concept, i.e., bypassing of a dominant ture and function, we first developed a kinetic model
negative block in a recessive plasmodium before cyto-for the photosensory control of sporulation. The model
plasmic mixing, seems as straightforward as classical is minimal in the sense that the number of elements
epistasis tests seem to be, establishing these simple rela-upstream of the toggle switch could not be further
re-tionships and putting them together is presumably not duced without destroying its capability to simulate the
sufficient to reconstruct the architecture of a network experimental data. The model is composed of
func-and may even lead to wrong conclusions, since the ki-tional elements that have been detected experimentally
netic effects of deleting a component in a complex and that were interconnected to simulate the
experi-network can be complicated and are not always accessi-mental results qualitatively and quantitatively. The
ble through linear logic or intuition. Therefore conclu-model can now be used as a seed for the interpretation
sions drawn from TRSC experiments should always be of experimental results on mutants altered in the
sporu-checked for consistency with previous conclusions by lation control network through a reverse modeling
ap-computer simulation. Vice versa, TRSC experiments proach. Although the kinetic model was used for
simula-providing valuable information on the structure and tion of TRSC experiments, the general conclusions
dynamics of the network should be identified by model-drawn regarding the application of TRSC for network
of mutants or define screening conditions for finding them.
To be an efficient tool the simulation should meet the kinetics of cytoplasmic mixing as closely as possible. In this work we have used first-order kinetics as a first approximation, which was sufficient to demonstrate ba-sic effects in TRSC and to simulate experimental results that have been obtained by complementation ofpho-1
with vac-1 (Marwan and Starostzik 2002) and with
other mutants (C.Starostzikand W.Marwan, unpub-lished results). Although two fused plasmodia exchange their content driven by vigorous active cytoplasmic streaming through rhythmic contraction of actomyosin filaments embedded in the cortical plasm, these plasmo-dia are certainly not two stirred compartments that are linked by a permeable diaphragm. Instead there is a concentration gradient over each plasmodium while
Figure 9.—Scheme explaining dominance, semidomi-mixing takes place and the kinetics depend on the rela- nance, or recessiveness of a mutant allele in a diploid heterozy-tive and absolute size of both plasmodia, on whether gote on the basis of gene dosage-effect relationships. When the degree of wild-type phenotype expression is plotted against they are fused side by side or sandwich-wise, and on
the gene dosage (wild-type level corresponds to 100%), a gene other factors like cytoplasmic streaming rate. Therefore
dosage-effect curve results, the shape of which may differ from it is desirable to measure the mixing kinetics during
gene to gene. Examples for two hypothetical genesAandB each experiment by using transgenic lines expressing are shown, the null mutations of which are recessive (A⫺) or
fluorescent proteins of different color and to feed these dominant (B⫺) in the heterozygous situation. To which degree
a given null mutation is dominant or recessive depends on data back into the model. Mixing can then be modeled
the degree of phenotype expression at 50% wild-type gene by replacing the two compartments (Figure 7) by a
two-dosage as determined by the gene two-dosage-effect curve. dimensional array of compartments, if side-by-side
fu-sion is modeled. Side-by-side fufu-sion could possibly pro-vide even more information than sandwich-wise fusion
mutated gene products with altered properties, have if simultaneous with mixing the expression of luciferase
been discussed recently (Veitia2002). Whether or not under the control of the promoter of one of the early
a mutation behaves dominant or recessive in a TRSC differentially regulated genes is measured.
Concentra-experiment depends on the Concentra-experimental conditions tion dependencies obtained from such experiments
and is not necessarily identical to the behavior of a could put additional constraints on a kinetic model of
diploid obtained by crossing. the sporulation control network.
If TRSC is to be used to establish the regulatory hierar-Gene dosage-effect curves:The possibility of fusing
chy between two dominant mutations, one of the muta-plasmodia of any relative size with each other provides
tions should be made recessive (see Table 3). In con-an easy way for fine-tuning the gene dosage of con-any
muta-trast, if the hierarchy between two recessive mutations tion. When the output, sporulation or gene expression,
is of interest, a situation should be created where haplo-is measured, gene dosage-effect curves may provide
in-insufficiency results. teresting mechanistic information through their shape
Two dominant mutations: On the basis of the gene
(see below) and in addition they may be used as tools to
dosage-effect curve, the mutant plasmodium is fused perform TRSC experiments to establish the regulatory
with wild type. The relative size of the two plasmodia is hierarchy between two dominant or two recessive
muta-then adjusted in a way that sufficient wild-type gene tions. The meaning of the terms dominant and recessive
product is supplied so that the resulting heterokaryon in the context of TRSC is somewhat different from their
still shows its phenotype on one hand, but behaves like meaning in classical genetics. Whether a mutation is
a recessive mutant in the TRSC experiment. recessive or dominant or somewhere in between in the
Two recessive mutations:Again on the basis of the gene
classical sense depends on the phenotype that results
dosage-effect curve (to be determined experimentally in a heterozygous diploid, where the gene dosage of
by titrating mutant with wild-type plasmodia), the gene the wild type is 50%. The degree of dominance or
reces-product deleted in one of the recessive mutants is re-siveness in the heterozygous situation in fact depends
duced in the plasmodium to be used for TRSC and on the dosage-effect curve of the mutated or the
wild-carrying a recessive second site mutation to an extent type gene (Figure 9). Biochemical mechanisms showing
that the first mutation behaves dominant or semidomi-how loss of gene function can lead to a dominant
pheno-nant in the experiment. In other words, TRSC is carried type, a frequent phenomenon called haplo-insufficiency
vations on growth and differentiation of Physarum polycephalum
recessive together with a double mutant that carries a
grown in pure culture. Dev. Biol.3:588–614.
loss of function of geneBbut at the same time a reduced Hildebrandt, A., 1986 A morphogen for the sporulation of
Phy-sarum polycephalum detected by cell fusion experiments. Exp.
level of gene product A as compared to the wild type.
Cell Res.167:453–457.
As a consequence, the deletion of geneAthen should
Laffler, T. G., andW. F. Dove, 1977 Viability ofPhysarum
polycepha-behave dominant or semidominant in the TRSC experi- lum spores and ploidy of plasmodial nuclei. J. Bacteriol. 131: 473–476.
ment. Experimentally, such a strain would be
con-Laffler, T. G., A. Wilkins, S. Selvig, N. Warren, A. Kleinschmidt structed as follows: A mutant deleted in geneAis crossed et al., 1979 Temperature-sensitive mutants ofPhysarum polycepha-with a mutant deleted in gene B to give a strain with lum: viability, growth, and nuclear replication. J. Bacteriol.138:
499–504.
double deletionA⫺B⫺. Next, a plasmodium of the
dou-Lamparter, T., andW. Marwan, 2001 Spectroscopic detection of
ble mutant is fused with a plasmodium that is deleted a phytochrome-like photoreceptor in the MyxomycetePhysarum only in geneBbut wild type in geneA. The relative size polycephalumand the kinetic mechanism for the photocontrol of
sporulation by Pfr. Photochem. Photobiol.73:697–702.
of the two plasmodia is adjusted in a way that the level
Martel, R., A. Tessier, D. PallottaandG. Lemieux, 1988
Selec-of the gene product A is at the value required for the tive gene expression during sporulation ofPhysarum polycephalum.
J. Bacteriol.170:4784–4790.
experiment.
Marwan, W., andC. Starostzik, 2002 The sequence of regulatory
How do the entities gene dosage and gene product
events in the sporulation control network ofPhysarum
polycepha-concentration relate to each other? Certainly, the cellu- lumanalysed by time-resolved somatic complementation of mu-tants. Protist153:391–400.
lar concentration of a gene product due to potential
Nishibayashi, S., S. Kawanaand T. Kuroiwa, 1987 Light and
regulatory effects at the transcriptional, translational, electron microscopic observations of mitochondrial fusion in or post-translational level in some cases may not be plasmodia induced sporulation inPhysarum polycephalum.
Cyto-logia52:599–614.
proportional to the dosage of the gene encoding it (the
Poulter, R. T. M., andJ. Dee, 1968 Segregation of factors
control-toggle switch is an example). Nevertheless, by reducing ling fusion between plasmodia of the true slime mouldPhysarum
polycephalum.Genet. Res.12:71–79.
the gene dosage gradually to zero, the effectiveness of
Putzer, H., C. Verfuerth, M. Claviezand T. Schreckenbach,
potentially compensating regulatory mechanisms will be
1984 Photomorphogenesis inPhysarum: induction of tubulins
exhausted, thereby allowing the desired gradual change and sporulation-specific proteins and of their mRNAs. Proc. Natl. Acad. Sci. USA81:7117–7121.
in gene product concentration from a wild-type level
Renzel, S., S. Esselborn, H. W. SauerandA. Hildebrandt, 2000
down to zero. Calcium and malate are sporulation-promoting factors of
Phy-sarum polycephalum.J. Bacteriol.182:6900–6905. This work was supported by the Deutsche Forschungsgemeinschaft
Rusch, H. P., W. Sachsenmaier, K. BehrensandV. Gruter, 1966 and by the Fonds der Chemischen Industrie.
Synchronization of mitosis by the fusion of the plasmodia of Physarum polycephalum.J. Cell Biol.31:204–209.
Sauer, H. W., K. L. BabcockandH. P. Rusch, 1969 Sporulation inPhysarum polycephalum. A model system for studies on differenti-ation. Exp. Cell Res.57:319–327.
LITERATURE CITED
Starostzik, C., 1995 Die sporulation in Physarum polycephalum: physiologische charakterisierung einer verzweigten signalkette.
Anderson, R. W., andC. L. Truitt, 1983 A new type of plasmodium
Dissertation der Fakulta¨t fu¨r Biologie, Ludwig-Maximilians-Uni-formation in Physarum polycephalum. Genet. Res.42:285–296.
versita¨t, Munich.
Burland, T. G., L. Solnica-Krezel, J. Bailey, D. B. Cunningham
Starostzik, C., andW. Marwan, 1994 Time-resolved detection of and W. F. Dove, 1993 Patterns of inheritance, development
three intracellular signals controlling photomorphogenesis in and the mitotic cycle in the protistPhysarum polycephalum.Adv.
Physarum polycephalum.J. Bacteriol.176:5541–5543. Microb. Physiol.35:1–69.
Starostzik, C., andW. Marwan, 1995a Functional mapping of the
Chapman, A., andJ. G. Coote, 1982 Sporulation competence in
branched signal transduction pathway that controls sporulation Physarum polycephalumCL and the requirement for DNA
replica-inPhysarum polycephalum.Photochem. Photobiol.62:930–933. tion and mitosis. J. Gen. Microbiol.128:1489–1501.
Starostzik, C., andW. Marwan, 1995b A photoreceptor with
char-Cooke, D. J., andJ. Dee, 1975 Methods for the isolation and analysis
acteristics of phytochrome triggers sporulation in the true slime of plasmodial mutants in Physarum polycephalum. Genet. Res. mould
Physarum polycephalum.FEBS Lett.370:146–148. 24:175–187.
Starostzik, C., andW. Marwan, 1998 Kinetic analysis of a signal
Gardner, T. S., C. R. CantorandJ. J. Collins, 2000 Construction transduction pathway by time-resolved somatic complementation of a genetic toggle switch inEscherichia coli.Nature403:339–342. of mutants. J. Exp. Biol.201:1991–1999.
Golderer, G., E. R. Werner, S. Leitner, P. Gro¨ bnerandG. Werner- Veitia, R. A., 2002 Exploring the etiology of haploinsufficiency.
Felmayer, 2001 Nitric oxide synthase is induced in sporulation BioEssays24:175–184.
ofPhysarum polycephalum.Genes Dev.15:1299–1309. Wheals, A. G., 1970 A homothallic strain of the myxomycete
Phy-Griffiths, A. J. F., W. M. Gelbart, J. H. MillerandR. C. Lewontin, sarum polycephalum.Genetics66:623–633. 1999 Modern Genetic Analysis. Freeman, New York.