ABSTRACT
WANG, XI. Optimize the Programming and Design of Assisted Living Facilities (Under the Direction of Dr. Jianxin Hu).
The changing demographics of the increasingly older U.S. population present both challenges and opportunities for urban planners, designers, architects and policy makers. In response to the increasing number of seniors who are no longer able to live on their own independently but do not require high levels of healthcare provided in a nursing home, the assisted living (AL) industry is expanding its market size in the past three decades. The overarching goal of this dissertation project is to develop programming and design strategies for promoting the success of AL businesses and enhancing the well-being of AL residents.
Study 1 focuses on conducting market demand analysis and facility scope estimation based on bed count. By applying multiple linear regression, age-specific population variables and percent of some college are in the final model developed in this study. The research findings support the hypothesis that demographic and socioeconomic factors jointly determine AL demands at the county-level and should be incorporated for senior living market prediction.
Study 2 & 3 aims to develop programming and design strategies for indoor public spaces of regular AL and special care units (SCUs), with the focus on space organization and circulation system. Four facilities in North Carolina are involved in this project as the case study sites. The researcher first conducts quantitative survey and observation by applying behavior mapping as the tool on each site. Then, built on the results of the quantitative methods and results,
© Copyright 2019 by Xi Wang
Optimize the Programming and Design of Assisted Living Facilities
by Xi Wang
A dissertation submitted to the Graduate Faculty of North Carolina State University
in partial fulfillment of the requirements for the degree of
Doctor of Philosophy
Design
Raleigh, North Carolina 2019
APPROVED BY:
_______________________________ _______________________________ Jianxin Hu Art Rice
Committee Chair
ii DEDICATION
iii BIOGRAPHY
iv
ACKNOWLEDGMENTS
I would like to extend my heartfelt appreciation to my advisor, Dr. Jianxin Hu, for his
inspirations and encouragement during my Ph.D. study at NC State. I would like to thank Dr. Traci Rider, who taught me two important courses on research methods and introduced me to the field of health and wellness. I am grateful to Prof. Art Rice, who offered me invaluable input on my research scope and approach. I would like to thank Dr. Emily Griffith, who helped with my data collection and statistical analysis. I like to thank Sepide, Jianli, Chunmiao, Teresa, Heather, Michelle, Cortney, Milena, and all of my research participants for helping me complete this study.
v TABLE OF CONTENTS
LIST OF TABLES ... viii
LIST OF FIGURES ... x
CHAPTER 1. INTRODUCTION ... 1
1. Aging at Home ... 2
2. Aging in Planned Senior Communities ... 3
3. Problem Statement ... 5
4. Research Goals and Objectives ... 7
5. Significance of Study ... 7
6. Research Theoretical Perspective ... 7
6.1. Ecological Theories ... 8
6.2. Social-Ecological Theories in Human Health Promotion ... 8
6.3. Social-Ecological Theory Approaches and Applications in Design ... 10
6.4. Employing Social-Ecological Theories in Senior Community Development ... 10
6.5. Assessing the Physical Environment with Environment Behavior (E-B) Model .... 11
7. Introduction to Research Methodologies ... 12
7.1. Research Design Overview ... 12
7.1.1. Study 1 - Correlational Research ... 12
7.1.2. Study 2 and 3 - Case Study ... 12
7.2. Study Site and Sample Selection ... 13
8. Definition of Terms ... 15
CHAPTER 2. STUDY 1 - Planning for the Future: Proposed Model for Market Analysis and Scope Estimation in Assisted Living Facilities ... 20
1. Introduction ... 20
2. Problem Statement ... 21
3. Research Goal and Objectives ... 22
4. Research Methodology ... 23
4.1. Research Design ... 23
4.2. Research Method, Data Collection and Results ... 23
4.2.1. Phase 1 - Market Demand Analysis (Objective 1) ... 23
4.2.2. Phase 2 - Project Scope Estimation based on Bed Counts (Objective 2) ... 34
CHAPTER 3: STUDY 2 - Programming Indoor Public Spaces of Regular Assisted Living Facilities ... 38
1. Introduction ... 38
2. Literature Review ... 37
3. Problem Statement ... 42
4. Research Objectives and Research Questions ... 43
5. Research Methodology ... 42
5.1. Research Framework ... 44
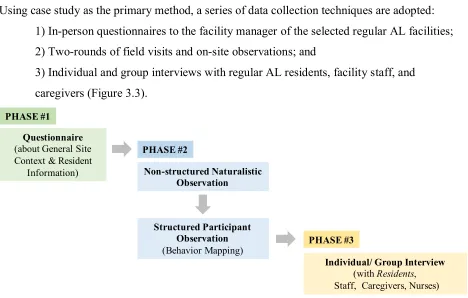
5.2. Data Collection Methods ... 45
6. Results and Discussions ... 49
vi
6.1.1. Facility A ... 49
6.1.2. Facility B ... 53
6.1.3. Facility C ... 60
6.1.4. Facility D ... 63
6.1.5. Summary ... 66
6.2. Findings of Phase 2 and Phase 3 - Observations and Interviews ... 69
6.2.1. Dining Room/ Space ... 69
6.2.2. Living Space ... 82
6.2.3. Activity Room/ Space ... 92
6.2.4. Lobby ... 102
6.2.5. Library ... 108
6.2.6. Beauty Salon ... 111
6.2.7. Sun Porch ... 114
6.2.8. Private Dining Room ... 117
6.2.9. Spaces to Add to the Existing Facility ... 122
6.2.10. Spatial Adjacencies of Public Spaces ... 123
6.2.11. Circulation, Walking and Wayfinding ... 125
CHAPTER 4: STUDY 3 - Programming Indoor Public Spaces of Special Care Units in Assisted Living Facilities ... 134
1. Introduction ... 135
2. Literature Review ... 134
3. Problem Statement ... 139
4. Research Objectives and Research Questions ... 140
5. Research Methodology ... 140
5.1. Research Framework ... 141
5.2. Data Collection Methods ... 140
6. Results and Discussions ... 144
6.1. Findings of Phase 1 - Survey of Basic Facility Information ... 144
6.1.1. Facility A ... 144
6.1.2. Facility B ... 146
6.1.3. Facility C ... 149
6.1.4. Facility D ... 152
6.1.5. Summary ... 160
6.2. Findings of Phase 2 and Phase 3 - Observations and Interviews ... 162
6.2.1. Dining Room/ Space ... 162
6.2.2. Living Space ... 172
6.2.3. TV Room ... 183
6.2.4. Activity Room/ Space ... 186
6.2.5. Den ... 189
6.2.6. Beauty Salon ... 196
6.2.7. Great Space ... 197
6.2.8. Reflection Space ... 198
6.2.9. Spatial Adjacency of Hierarchy of Public Spaces ... 200
vii
CHAPTER 5: CONCLUSIONS, IMPLICATIONS & LIMITATIONS ... 210
1. Conclusions & Implications ... 210
2. Research Limitations ... 219
3. Future Studies ... 220
viii LIST OF TABLES
Table 1.1 Environment-Behavior (E-B) Model ... 12
Table 2.1 Predictors in the Full Model and their Variance Inflation Factors (VIFs) ... 26
Table 2.2 Predictors in the Full Model after Ratio Conversion and their Variance Inflation Factors ... 28
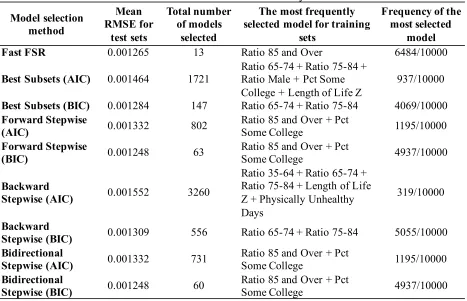
Table 2.3 Performance of Model Selection Methods in 1000 Cycles of 10-fold Cross Validation ... 29
Table 2.4 Coefficient Estimates for Proposed Model for Predicting Bed Needs in Assisted Living in NC ... 30
Table 2.5 Bed Count and BGSF of the Selected Facilities ... 35
Table 2.6 Bed Count, Unit Count, and Areas of Indoor Functional Components ... 36
Table 3.1 Design Consideration Regarding of Indoor Common Space ... 40
Table 3.2 Project Context Data Collection Contents ... 45
Table 3.3 Building Information of Four Facilities ... 67
Table 3.4 Population of Four Facilities ... 67
Table 3.5 Unit Types and Numbers of Four Facilities ... 67
Table 3.6 Magnitude of the Facility and Different Indoor Spaces of Four Facilities ... 68
Table 3.7 Twelve Identified Residential Indoor Public Spaces from Four Facilities ... 68
Table 3.8 Three Meal Times in Dining Room (Facility A, B, C, D) ... 72
Table 3.9 Observed Peak Usage Rate and Actual Seat Number to Bed Count Ratios ... 74
Table 3.10 Area / Seat in all Four Facilities ... 77
Table 3.11 Tables and Seats in Dining Rooms ... 82
Table 3.12 Scheduled Activities in Living Space (Facility A, B, C) ... 86
Table 3.13 Living Space SF/ Resident in Facility A, B, and C ... 92
viii
Table 3.15 Activity Room SF/ Resident in Facility A, B, C, and D ... 101
Table 3.16 Lobby SF/ Resident in Facility A, B, and D ... 108
Table 3.17 Resident Number to Private Dining Room Ratio ... 122
Table 4.1 Project Context Data Collection Contents ... 143
Table 4.2 Building Information of Four Facilities ... 160
Table 4.3 Population of Four SCUs ... 160
Table 4.4 Unit Types and Numbers of Four Facilities ... 160
Table 4.5 Areas of the Facility and Indoor Spaces ... 161
Table 4.6 Ten Identified Residential Indoor Public Spaces ... 161
Table 4.7 Meal Times in Dining Room/ Space (Facility A, B, C, D) ... 166
Table 4.8 Dining Square Footage and Bed Counts (Facility A, B, C, D) ... 170
Table 4.9 Scheduled Activities in Living Space (Facility A, B, C, D) ... 176
Table 4.10 Living Space SF/ Resident in Facility A, B, and C ... 183
Table 4.11 Scheduled Activities in TV Room (Facility D) ... 181
Table 4.12 TV Room SF/ Resident in Facility D (North side) ... 185
Table 4.13 Scheduled Activities in Activity Room (Facility B, D) ... 188
Table 4.14 Activity Room SF/ Resident in Facility B and D ... 188
x LIST OF FIGURES
Figure 1.1 Percent of U.S. Population in Selected Age Groups, 1960 - 2060 ... 1
Figure 1.2 Aging Transition Processes ... 3
Figure 1.3 Research Problem Statement ... 6
Figure 2.1 Research Conceptual Framework ... 23
Figure 2.2 Correlations between Response Variable (Occupied) and Predictor Variables .... 27
Figure 2.3 Standardized Residuals vs Fitted Values of the Response ... 31
Figure 2.4 Normal Q-Q Plot of Standardized Residuals ... 31
Figure 2.5 Histogram of Residuals with Normal Curve ... 32
Figure 2.6 Partial Residual Plot of Ratio 85 and Over ... 32
Figure 2.7 Partial Residual Plot of Percent Some College ... 32
Figure 2.8 Partial Regression Plot of Ratio 85 and Over ... 33
Figure 2.9 Partial Regression Plot of Percent Some College ... 33
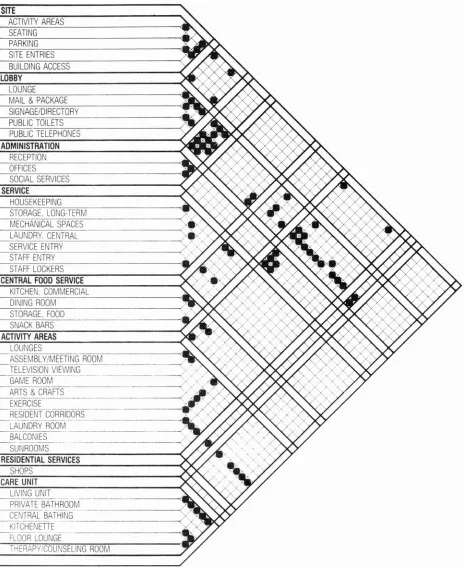
Figure 3.1 AL Facilities Adjacency Matrix ... 41
Figure 3.2 Research Conceptual Framework (Study 2) ... 44
Figure 3.3 Data Collection Process and Methods (Study 2) ... 45
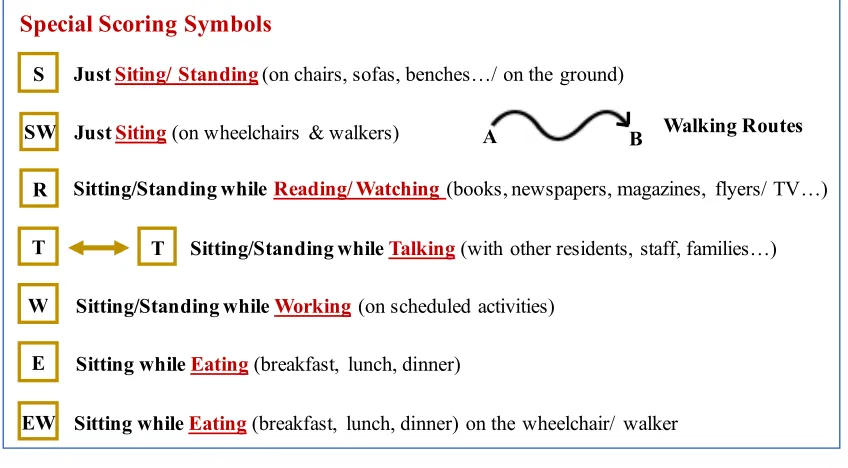
Figure 3.4 Designed Scoring Symbols for Participant Observation ... 48
Figure 3.5 General Information of Facility A ... 50
Figure 3.6 Floor Plan of Facility A ... 51
Figure 3.7 Checklist of All Types of Indoor Public Spaces of Facility A ... 52
Figure 3.8 Indoor Public Spaces of Facility A ... 52
Figure 3.9 Floor Plan of Facility B (First Floor) ... 53
xi
Figure 3.11 Floor Plan of Facility B (Third Floor) ... 55
Figure 3.12 General Information of the Facility B ... 56
Figure 3.13 Checklist of All Types of Indoor Public Spaces of Facility B ... 57
Figure 3.14 Indoor Public Spaces of Facility B (First floor) ... 57
Figure 3.15 Indoor Public Spaces of Facility B (Second floor) ... 58
Figure 3.16 Indoor Public Spaces of Facility B (Third floor) ... 59
Figure 3.17 Floor Plan of Facility C ... 60
Figure 3.18 General Information of the Facility C ... 61
Figure 3.19 Checklist of All Types of Indoor Public Spaces of Facility C ... 61
Figure 3.20 Indoor Public Spaces of Facility C ... 62
Figure 3.21 Floor Plan of Facility D (First Floor) ... 63
Figure 3.22 Floor Plan of Facility D (Second Floor) ... 63
Figure 3.23 Floor Plan of Facility D (Third Floor) ... 64
Figure 3.24 General Information of the Facility D ... 64
Figure 3.25 Checklist of All Types of Indoor Public Spaces of Facility D ... 65
Figure 3.26 Indoor Public Spaces of Facility D (First floor) ... 65
Figure 3.27 Indoor Public Spaces of Facility D (Second floor) ... 66
Figure 3.28 Indoor Public Spaces of Facility D (Third floor) ... 66
Figure 3.29 Dining Room of Facility A ... 70
Figure 3.30 Dining Room of Facility B ... 70
Figure 3.31 Dining Room of Facility C ... 71
Figure 3.32 Dining Room of Facility D ... 71
xii
Figure 3.34 Dining Room Map and Furnishing of Facility D ... 81
Figure 3.35 Living Space of Facility A ... 84
Figure 3.36 Living Space of Facility B ... 84
Figure 3.37 Living Space of Facility C ... 85
Figure 3.38 Living Space Peak Usage Rate and Usage Time (Facility A) ... 87
Figure 3.39 Living Space Peak Usage Rate and Usage Time (Facility B) ... 88
Figure 3.40 Living Space Peak Usage Rate and Usage Time (Facility C) ... 90
Figure 3.41 Activity Space of Facility A ... 93
Figure 3.42 Activity Space of Facility B ... 93
Figure 3.43 Activity Space of Facility C (the “Gallery”) ... 94
Figure 3.44 Activity Space of Facility D ... 95
Figure 3.45 Activity Space Peak Usage Rate and Usage Time (Facility A) ... 96
Figure 3.46 Activity Room Peak Usage Rate and Usage Time (Facility B) ... 96
Figure 3.47 Activity Room Peak Usage Rate and Usage Time (Facility C) ... 97
Figure 3.48 Activity Room Peak Usage Rate and Usage Time (Facility D) ... 98
Figure 3.49 Lobby of Facility A ... 103
Figure 3.50 Lobby of Facility B ... 103
Figure 3.51 Lobby & Parlor & Bistro of Facility D ... 104
Figure 3.52 Library of Facility A ... 109
Figure 3.53 Library of Facility B ... 109
Figure 3.54 Beauty Salon of Facility B, C, D ... 113
Figure 3.55 Beauty Salon of Facility A ... 113
xiii
Figure 3.57 Private Dining Room of Facility A ... 118
Figure 3.58 Private Dining Room of Facility B ... 119
Figure 3.59 Private Dining Room of Facility D ... 121
Figure 3.60 Corridor Design of Facility A, B, C, and D ... 126
Figure 3.61 Hallway Peak Usage Rate and Time (Facility A, B, C, D) ... 127
Figure 4.1 Percentage of Available Features in SCUs of AL ... 136
Figure 4.2 Integrative Model of Place ... 137
Figure 4.3 Research Conceptual Framework (Study 3) ... 142
Figure 4.4 Data Collection Process and Methods (Study 3) ... 142
Figure 4.5 Floor Plan of Facility A ... 144
Figure 4.6 General Information of the Facility A ... 145
Figure 4.7 Checklist of All Types of Indoor Public Spaces of Facility A ... 145
Figure 4.8 Indoor Public Spaces of Facility A ... 146
Figure 4.9 Floor Plan of Facility B ... 145
Figure 4.10 General Information of Facility B ... 147
Figure 4.11 Checklist of All Types of Indoor Public Spaces of Facility B ... 148
Figure 4.12 Indoor Public Spaces of Facility B ... 149
Figure 4.13 Floor Plan of Facility C ... 150
Figure 4.14 General Information of the Facility C ... 151
Figure 4.15 Checklist of All Types of Indoor Public Spaces of Facility C ... 151
Figure 4.16 Indoor Public Spaces of Facility C ... 152
Figure 4.17 Floor Plan of Facility D ... 153
xiv
Figure 4.19 General Information of the Facility D - North Side ... 155
Figure 4.20 Checklist of All Types of Indoor Public Spaces of Facility D - North Side ... 155
Figure 4.21 Indoor Public Spaces of Facility D - North Side ... 156
Figure 4.22 Floor Plan of South Side Neighborhood of Facility D ... 157
Figure 4.23 General Information of the Facility D - South Side ... 158
Figure 4.24 Checklist of All Types of Indoor Public Spaces of Facility D - South Side ... 158
Figure 4.25 Indoor Public Spaces of Facility D - South Side ... 159
Figure 4.26 Average Peak Usage Rate of Each Public Spaces in Four Facilities ... 162
Figure 4.27 Dining Space of Facility A (Household B) ... 163
Figure 4.28 Dining Space of Facility B ... 163
Figure 4.29 Dining Space of Facility C ... 164
Figure 4.30 Dining Space of Facility D (North-side) ... 164
Figure 4.31 Dining Space of Facility D (South-side) ... 165
Figure 4.32 Average hours in Use of Each Indoor Public Space ... 165
Figure 4.33 Dining Room Peak Usage Rate and Usage Time (Facility A, B, C, D) ... 167
Figure 4.34 Dining Space Table and Chair Setting of Facility B ... 171
Figure 4.35 Dining Space Table and Chair Setting and Aisle Space of Facility C ... 171
Figure 4.36 Activity Schedule and its Venue in Facility A, B, C, D ... 172
Figure 4.37 Living Space of Facility A - (Household A) ... 173
Figure 4.38 Living Space of Facility B ... 174
Figure 4.39 Living Space of Facility C ... 174
Figure 4.40 Main Living Space of Facility D - (North Side) ... 175
xv
Figure 4.42 Living Space of Facility D - (South Side) ... 176
Figure 4.43 Living Space Peak Usage Rate and Usage Time (Facility A) ... 177
Figure 4.44 Living Space Peak Usage Rate and Usage Time (Facility B) ... 179
Figure 4.45 Living Space Peak Usage Rate and Usage Time (Facility C) ... 180
Figure 4.46 Living Space Peak Usage Rate and Usage Time (Facility D - North Side) ... 181
Figure 4.47 Living Space Peak Usage Rate and Usage Time (Facility D - South Side) ... 182
Figure 4.48 TV Room of Facility D - (North Side) ... 184
Figure 4.49 TV Room Peak Usage Rate and Usage Time (Facility D - North Side) ... 184
Figure 4.50 Activity Room of Facility B ... 187
Figure 4.51 Activity Space of Facility D ... 187
Figure 4.52 Den Peak Usage Rate and Usage Time (Facility A, B, C, D) ... 191
Figure 4.53 Great Space of Facility A ... 197
Figure 4.54 Spatial Hierarchy of SCU Facilities ... 201
Figure 4.55 Living Space and Main Entrance Adjacency of Facility C ... 202
Figure 4.56 Hallway Peak Usage Rate and Time (Facility A, B, C, D) ... 206
Figure 4.57 Corridor Design of Facility A, B, C, and D ... 200
Figure 5.1 Process of Market Analysis and Scope Estimation in AL ... 211
Figure 5.2 Hierarchy and Adjacencies of the Public Spaces in Regular AL ... 215
1 CHAPTER 1. INTRODUCTION
According to the recent projection from the U.S. Census Bureau, the oldest baby boomers - Americans born between 1946 and 1964 - will reshape America's population. Today, the number of Americans aged 65 and older is projected to more than double from 46 million to over 98 million by 2060, and this age group’s share of the total population will rise to nearly 24 percent from 15 percent (Figure 1.1) (Population Reference Bureau, 2016). The changing demographics of the increasingly older U.S. population present both challenges and opportunities for urban planners, designers, architects and policy makers.
Figure 1.1 Percent of U.S. Population in Selected Age Groups, 1960 - 2060.
Aging is taking place alongside decreasing health conditions that will affect the life experiences and living conditions of older people. A recent survey from National Council on Aging (2016) showed that 80 percent of senior population had at least one chronic disease, 68.4 percent of them had two or more, and 36.4 percent had four or more chronic conditions (Lochner & Cox 2013), such as hypertension (58%), arthritis (31%), depression (14%), and Alzheimer’s disease and dementia (11%). All of these health-related drawbacks can affect a person’s ability to perform their important daily living activities, restricting their engagement in life independently, and their enjoyment in their social lives.
2 children and grandchildren where they can not only stay in a home environment, experiencing family atmosphere, but also get assistances for their daily living. There is also an up trending of senior adults who choose relocating to planned multi-level retirement communities, congregate houses, or nursing homes based on their changing health conditions and needs.
1. Aging at Home
The aging U.S. population is fostering increased interest in community efforts to promote aging in place. Greenfield (2012) stated that “aging in place” refers to being able to remain in one’s current residence even when faced with increasing need for support because of life changes, such as declining health, widowhood, or loss of income. The home environment is acknowledged as being the primary context for growing old (Scheidt & Windley, 2006; Wahl & Gitlin, 2007), because older people prefer to age in place with familiar locations, people and surroundings (Frank, 2002). According to an AARP survey, nearly 90 percent of those over age 65 wanted to stay in their residence for as long as possible, and 80 percent believed their current residence was where they will always live (AARP, 2010). Yeo and Heshmati also argued that the preferred residential environment should be a place where seniors can feel stabilized and reside for a long period of time (2014).
3 2. Aging in Planned Senior Communities
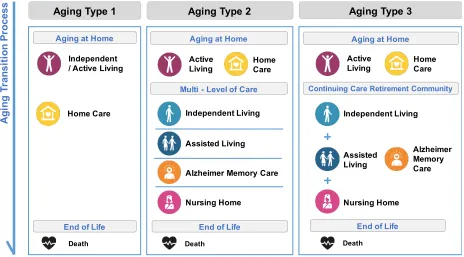
People always choose their own aging transition process, living arrangements, and long-term care services based on their physical abilities, wealth, leisure, and preferences. Aging in home settings with home care services was once the only option available in the U.S. other than institutionalization for almost 50 years in 19th century (AARP, 1993). Although the elderly prefer to age in place, many alternative senior living residences and facilities with multi-level services have become available. In the past three decades, the senior living industry has expanded and diversified in order to address the demographic changes. A series of new and matured models of senior living communities have emerged, ranging from independent living (IL) for independent and active older adults, assisted living (AL) for individuals needing assistance with two or more activities of daily living (some facilities involve special units for Alzheimer’s memory care and dementia), and skilled nursing home (NH) for individuals who need a higher degree of medical and round-the-clock personal care (Campbell, 2015). In addition, seniors can sign a long-term contract with a continuing care retirement community (CCRC), which offers at least three levels of care (IL, AL, NH), allowing them to age on the same campus (Figure 1.2).
Figure 1.2 Aging Transition Processes.
Aging Type 1 Aging Type 2 Aging Type 3
A g in g T ra n si ti o n P ro ce ss Independent / Active Living
Home Care Aging at Home
Death
Aging at Home
Active
Living HomeCare
Multi - Level of Care
Assisted Living
Alzheimer Memory Care Independent Living
Nursing Home
End of Life
Death
End of Life
Active
Living HomeCare
Continuing Care Retirement Community
Assisted Living Alzheimer Memory Care Independent Living Nursing Home Death
4 As one of the fastest-growing options for long-term care in the United States, AL has become increasingly appealing to investors, consumers, care providers, and advocates. Residents often enter an AL facility because their home has accessible obstacles, and provides little physical support for disabilities (Brummett, 1997). In response to the increasing number of seniors who are no longer able to live on their own independently but do not require high levels of healthcare provided in a nursing home, the AL industry is expanding its market size in the past three
decades. Throughout the 1990s, AL was the most rapidly growing form of senior housing in the industry (Hawes, Phillips, Rose, Holan, & Sherman, 2003). There were an estimated 11,459 AL facilities nationwide, with approximately 611,300 beds and 521,500 residents, as of the
beginning of 1998 (Hawes, Philips & Rose, 2000). Mollica (2002) estimated that there were about 33,000 facilities containing about 795,000 beds by the year 2000, which doubled the size of AL facilities in only two years in the industry. AL is not only a common alternative to
tradition nursing homes, but also a more affordable setting that can provide non-institutional and home-like living environments to the frail elderly.
AL means different things to different people across the nation and world. One of the most accepted definitions of AL according to Assisted-Living Quality Coalition (1998) is:
“A congregate residential setting that provides or coordinates personal services, 24-hour supervision and assistance (scheduled and unscheduled), activities, and health related services; designed to minimize the need to move; designed to accommodate individual residents’changing needs and preferences; designed to maximize residents’ dignity, autonomy, privacy, independence, and safety; and designed to encourage family and community involvement”.
The key characteristics of AL facilities include: 1) assistance and supervision available 24-hours a day; 2) services to meet scheduled and unscheduled needs; 3) care and services provided or arranged to promote independence; 4) an emphasis on consumer dignity, autonomy and choice; 5) an emphasis on privacy and a homelike environment (Hawes, Philips & Rose, 2000).
5 cognitive impairments, such as Alzheimer’s disease and related dementia. Surveys showed that the percentage of residents in AL facilities with mental and cognitive impairments was about 40-50 percent (Regnier, 2002) and about one-third of the residents (34%) had moderate to severe cognitive impairments (Hawes, Philips & Rose, 2000). This population requires extensive special daily cares and treatments. They are typically located in a designated wing, floor or building of an AL facility, separating from the residents who are physical disable but mentally intact.
In this study, the facilities that include physically and/or mentally (such as Alzheimer’s disease or other dementia) impaired elderly are called AL in a general term. The part of the AL facilities designed for the physically frail elderly only will be categorized as regular AL. The part of the AL facilities designed for those who need special Alzheimer’s disease or other dementia cares will be categorized as SCU (special-care Unit).
3. Problem Statement
The aging population and the expansion of the AL market are fueling the need for developing better programming and designing strategies for the AL facilities. Several studies had
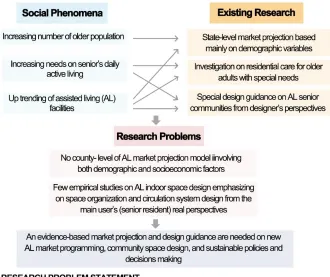
discussions on the AL industry expansion (Bowblis, 2014) and future market projection methods (Stevenson & Grabowski, 2010). These studies have identified much variation in AL supply across the states in the United States. However, the efforts to assess AL market data have primarily been at the state level (Mollica, Sims-Kastelein, O’Keefe, 2008; Mollica, Johnson -Lamarche, and O’Keefe, 2005). Few studies have examined the market variations and correlations between the AL market demand and socioeconomic characteristics beyond demographic factors, such as population and age, especially at the county level. It is thus important to establish a more comprehensive market projection model to inform the
policymakers and private developers, so that they can better assess the market demand and react accordingly (Figure 1.3).
6 foundations, architecture programming and design considerations, as well as design guidance in details from designers, architects and planners’ points of view (Hoglund, 1985; Brummett, 1997; Perkins Eastman, 2013; Regnier, Hoglund, & Klaassen, 1993; Regnier, 1994 & 2002; Moore, 1999). However, many existing design criteria and guidelines are prescriptive, and often contained in codes in terms of minimum square-footage requirements and other governmental standards (Perkins Eastman, 2013). There is a lack of empirical research that assesses the indoor space design in terms of spatial hierarchy, organization and circulation.
An unclear organization of indoor space hierarchy limits a person’s ability to independently navigate a facility and reach desired destinations and activities (Brummett, 1997). Moreover, the users - the senior residents (the actual “experts”) - are often excluded from the design process. Very limited studies that made design recommendations are informed by studying the senior residents of the AL facilities - their real experiences and perspectives towards the environment. It is thus crucial to work directly with users of the physical environment in order to identify their needs and perspectives, and generate effective design and programming strategies (Figure 1.3).
7 4. Research Goals and Objectives
The overarching goal of this project is to develop programming and design strategies for promoting the success of AL businesses and enhancing the well-being of AL residents.
Specifically, the Research Objectives are:
(1) Conduct market demand analysis and facility scope estimation based on bed counts. This objective will be achieved in Study 1 (Chapter 2). The Research Questions are:
a. How to use both demographic and socioeconomic factors to predict future AL market demand in terms of bed count?
b. How to estimate project scope (in terms of square footage and budget) based on bed count?
(2) Develop programming and design strategies for indoor public spaces of regular AL (Study 2 in Chapter 3) and of SCUs (Study 3 in Chapter 4), with the focus on space organization and circulation system. The Research Questions are:
a. How do indoor public spaces (type, quantity, variability and size) impact the residents’ daily activities in regular AL and SCU facilities?
b. What type of circulation pattern better supports way-finding and promotes walking or physical exercises in public spaces?
5. Significance of Study
On a community scale, this study is intended to inform urban planners, policymakers, designers, and developers to better assess the market demand and estimate project scope of AL
communities; On a facility scale, this study is intended to improve the quality and effectiveness of AL programming and design to meet the needs of the elderly. The results will provide evidences and research-based design reviews and guidelines on AL market analysis, space programming and design.
6. Research Theoretical Perspective
8 6.1. Ecological Theories
In a scientific world, the “ecology” can be viewed as a study of the relationships and interactions among organisms, and between the living things and its environment. The living organisms, the communities they build up, and other non-living components as well as their environment have dynamic interactions with each other in the system of ecology. During the past three decades, the concept and study of the social-ecological system have become more and more central to an increasingly widespread discourse on the interactions between human and its environment interactions.
In Bronfenbrenner’s ecological system theory for human development, he discussed that, as an “individual”, every person has his or her unique identifiable or combined identities and
characteristics, such as sex, age, health condition and personal preference, etc. Human development is a process of change that occurs in the midst of a vibrant and complex
environment and over the entire life span. Human beings are not only the partial products, but also the partial producers of their environment (Bronfenbrenner, 1979).
The fundamental concern of the ecological theories is the reciprocal relationship and mutual reciprocity between individuals and their environment. In the 1950s, Gibson’s ecological theories studied the affordance and visual perception that had very important stresses on ecological perspective within physical environments. The perception can be defined as a
relationship between a living organism and its environment, and the development being changed in this relationship over the organism’s life course (Tudge, Gray & Hogan, 1997). Gibson assumed that the perceiver and the environment were inseparable, and perception of any object was simultaneously perception of the self (Jonathan, Jacquelyn & Diane 1997). His theory and approach provided an appropriate analysis of the actors in physical environment, which was very effective in explaining perceptually guided behaviors.
6.2. Social-Ecological Theories in Human Health Promotion
social-9 ecological paradigm (Stokols, 1992). It is a theory-based framework, and a set of theoretical principles, for a further understanding of the dynamic interplay, interrelationships and multilevel effects among people, groups, and their socio-physical milieus (Stokols, 1996). Stokols (1996) highlighted this theory on system processes and environmental interventions in health and illness where environmental resources and contexts may facilitate or hinder the effectiveness of targeted human health behavior changes and promotions.
The social-ecological model also encompasses a series of core underlying assumptions about the dynamics of human health and the development of effective strategies to promote personal and collective well-being (Stokols, 1992). First, the healthfulness of a situation and the well-being of its participants are assumed to be influenced by multiple facets of both the physical environment, such as geography, architecture, and technology, and the social environment such as culture, economics, and politics. Second, analyses of health and health promotion should address the multi-dimensional and complex nature of human environments. Third, as environments can be described in terms of their relative scale and complexity, the participants in those environments can be studied at varying levels ranging from individuals, small groups, and organizations to larger communities and populations etc. Fourth, the social-ecological perspective incorporates a variety of concepts derived from the systems theory to understand the dynamic interrelations between people and their environments. Finally, owing to the complexity of human
environments and an explicit emphasis on multilevel and multi-method analyses of behavior, the social-ecological perspective is inherently interdisciplinary in its approach to health research and the development of health promotion programs (Stokols, 1996).
10 6.3. Social-Ecological Theory Approaches and Applications in Design
Design is a purposeful creative action. It is the building of relations between us and our world (Banathy, 1996). The manifestation of design knowledge, thoughts, beliefs, and desires formation is gained and developed in the pursuit of the practical sciences and the humanities issues and challenges. A good design can make a difference in the quality of a person’s life and the individual’s ability to master the environment (Hoglund & Ledewitz, 1999). As designers, one of the important our jobs is to help people realize their goals and objectives, thereby meeting their needs and perspectives. By applying the social-ecology perspective in design, designers can explore the empirical evidences from multiple dimensions - physical environment, social and cultural environment, personal attributes; and multiple levels - individuals, groups, organizations. This perspective encourages us to consider the complexity of different human situations in urban planning, community design, community health promotion, neighborhood safety design, and policies making, etc.
6.4. Employing Social-Ecological Theories in Senior Community Development
In social-ecological systems, both physical and social environments are essential contexts that can function as an enabler of senior’s healthy behaviors, and also operate as a stressor in seniors’ everyday life, stopping them from pursuing better quality of life. Many AL residents may have different level of mobility, cognitive, or other frailties or impairments that make it difficult for them to travel outside of the facility (Brummett, 1997). Within the built senior community building, the resident units and rooms can provide seniors with basic living accommodations and a private space to enjoy their autonomy and privacy. Out of their unit doors, the public common spaces can be seen as the principal venues for them to have daily social interactions, interrelated relationships with others and interdependent contacts with the built environment. A senior adult, who spends the majority of time in his/ her isolated unit due to the lack of well-designed public spaces and social activities, will feel much more lonely and depressed, and have greater stresses on his/ her everyday life. As many psychologists constructed, the stress is fundamentally a relational concept signifying an imbalance between environmental opportunities and individual’s goals, and capabilities to cope with that imbalance (Stokols, 1979). Also, the lack of some
11 participation in daily social activities or events since the difficulties or impedes in their living physical environment, an increasing loss of independence, choice and quality of life may result.
As a human develops, his/ her changing needs and perceptions determine how the individual experiences and interacts within and between different environment settings. If properly
designed, a senior living community can contribute positively to an older person’s independence, dignity, health, and enjoyment of life. If poorly planned and detailed, it can imprison, confuse and depress (Perkins Eastman, 2013). Environments designed for older adults should match the individual’s level of functioning with environmental demands in order to facilitate positive adaptive behavior changes, health promotions and favorable outcomes (Lawton & Nehemow, 1989). Although the focus of this study is primarily on the physical environment, the social environment is also considered as a part of the holistic approach.
6.5. Assessing the Physical Environment with Environment Behavior (E-B) Model
Comparing to the institutional look of the nursing homes, the AL design features more privacy, multi-choices in accommodations, and a home-like environment to maximize residents’ dignity, autonomy, independence and their quality of life (Schwarz & Brent, 1999). With the
proliferation of AL facilities, there is an increasing interest in the methods of assessing the quality of the environment. Built on the works of previous researchers (Calkins, 1998; Cohen & Weisman, 1991; Hiatt, 1991; Lawton, 1990), Zeisel, Hyde and Levkoff developed the
environment-behavior (E-B) model to identify the proximal physical environment factors hypothesized to influence behavioral and other health characteristic of residents in AL,
especially of those who have Alzheimer’s disease (Zeisel, et. al, 2003). This model is designed to evaluate the effects of senior living environments on residents and caregivers by making explicit the relationship between environmental influences and behavioral effects (Zeisel, Hyde, and Levkoff, 1994). In the E-B model, eight primary environment characteristics and sixteen
12 Table 1.1. Environment-Behavior (E-B) Factor Model.
7. Introduction to Research Methodologies 7.1. Research Design Overview
7.1.1. Study 1 - Correlational Research
The first study adopted a correlational research method. Correlational Research is a quantitative research method designed to investigate the extent to which variations in one factor correspond with variations in other factors based on the correlation coefficients (Stephen & Michael, 1995). This research method allows researchers to conduct statistical analyses, such as multiple
regressions and correlations. It can describe the relationships among two or more variables; be used where variables are very complex and/or do not lend themselves to the experimental method and controlled manipulation; permit the measurement of several variables and their interrelationships simultaneously and in a realistic setting; examine the degrees of relationship rather than the all-or-nothing questions posed by experimental design (Stephen & Michael, 1995); and provide overall predictive strength of the identified variables and individual variables (Groat & Wang, 2013). By applying correlational research in the first study, the correlation between dependent variables (county-level occupied bed counts) and independent variables (e.g. demographic and socioeconomic factors) can be quantified, and a statistic model can be
developed.
7.1.2. Study 2 and 3 - Case Study
The second and third studies were conducted by case study. Case Study is an approach by which an investigator explores a real-life, contemporary bounded system or multiple bounded systems over time, through detailed, in-depth data collection involving multiple sources of information
Table 1.1. Environment-Behavior (E-B) Factor Model. E-B
System Concepts Definition or Examples Dimensions
Spatial Features
Common Space Structure
Sizes, relationships, & qualities of spaces used by all residents.
• Quantity • Variability Walking Paths Circulation space residents use for
wandering & moving around.
• Continuousness • Wayfinding
Ambient
Quality Residential Scale
Degree to which the size of the AL reflects a large family space and the degree to which the AL uses and homelike characteristics.
13 and reports a case description and case themes (Creswell, 2013). According to Yin (2014), a case study allows investigators to focus on a “case” and retain a holistic and real-world perspective. It can use "any mix of qualitative and quantitative evidence" (Yin, 2003) and be embedded into a larger mixed method research study. As Yin (2014) discussed, when comparing to other
evaluation methods such as surveys, experiments and quasi-experiments, case study can capture the complexity of a case, including relevant changes over time, and attend fully to contextual conditions, including those that potentially interact with the case. Therefore, by applying case study in Study 2 and 3, the author can effectively investigate the bounded concrete entity - the planned AL senior community; collect in-depth and multi-sources of data to enhance the validity of the results; and study the AL settings or phenomena in relation to the complex dynamics in its real-life context (Groat & Wang, 2002).
7.2. Study Site and Sample Selection
In contrast to nursing homes, no federal quality standards and guidelines exist for AL facilities. AL facilities are typically regulated at the state level. The states in the U.S. vary significantly in its definitions, licensing requirements, regulations, quality standards, and monitoring and
enforcement activities for AL (AARP Public Policy Institute, 2004). In some states, there are no limits on the types of facilities that may call themselves “AL” or advertise that they provide AL, regardless of the kind of services and accommodations they provide (Hawes, Philips, & Rose, 2000). Further, some states do not have a licensure category known as “AL” or include all types of residential care facilities in the category called “AL” (Mollica & Snow, 1996; Mollica, 1998; Hawes, et al., 2000). Places known as AL facilities differ widely in ownership, auspice, size, services, staffing, accommodations, and price as well (Hawes, Philips, & Rose, 2000). Any attempt to understand AL and its role in providing long-term care to the elderly is hindered by the lack of a unified definition (Hawes, Philips, & Rose, 2000). In this case, the ambiguity on the definition and lack of standardization may lead to differentiations in AL settings and may cause a bias if cases are selected from multiple states in the U.S.
14 rural and totally rural areas in one state, and about the average number of older population and AL facilities nationwide, making it geographically representative of the United States.
According to NC Division of Health Service Regulation, AL facilities are referred to as “Adult Care Homes (ACHs)”. Senate Bill 502, ratified by the 1995 General assembly, established new terminology and definitions for what were formerly called "domiciliary homes" in North Carolina. ACHs are now defined in G.S. 131D-2.1 as follows:
"Adult Care Home" is an AL residence in which the housing management provides 24-hour scheduled and unscheduled personal care services to two or more residents, either directly or, for scheduled needs, through formal written agreement with licensed home care or hospice agencies. Some licensed ACHs provide supervision to people with
cognitive impairments whose decisions, if made independently, may jeopardize the safety or well-being of themselves or others and therefore require supervision. Medication in an ACH may be administered by designated, trained staff. ACHs that provide care to two to six unrelated residents are commonly called family care homes (FCHs). ACHs and FCHs are subject to licensure by the Division of Health Service Regulation.
Study 1
The NC Department of Health and Human Services provided the necessary data (such as occupancy rate, bed counts, etc.) for 92 (out of 100) counties in NC in 2006. Other quantitative data (such as population, income and education-level, etc.) were collected from three main sources - North Carolina Office of State Budget and Management, County Health Rankings, and US Census data.
Study 2 & 3
15 beds: 1) ACHs with two to six residents (also known as FCHs); 2) ACHs with seven to twelve residents; and 3) ACHs with more than twelve residents (NC Division of Health Service Regulation, 2015). The case study sites and samples of Study 2 and 3 aimed to the ACHs with more than twelve residents (typically located within mostly urban counties in NC).
According to the dataset from DHSR (2016), there were 155 facilities and 10810 beds of ACHs serving the population aged 55 and over, compared to the 582 total adult care facilities and 36171 total adult care bed counts in NC in 2016. For Study 2 and 3, four AL facilities have been chosen from the registered ACHs in North Carolina for the data collection and comparison. The case study sites meet the following eligibility criteria 1) serve a resident population aged 55 and over; 2) have more than twelve licensed beds in adult care facilities (not in nursing homes or hospitals, see 2016 State Medical Facility Plan for more information); 3) have distinct and comparable building plan layouts (e.g. vary in public space organization, hierarchy of spaces, and circulation system design; 4) provide room and board with three meals a day, on-site supervision, social activities and help with senior’s ADLs; 5) are located within mostly urban counties (County Rurality Level, 2010) in NC in order to reduce contextual effects and differentiations to minimum.
8. Definition of Terms
Activities of Daily Livings (ADLs) - Basic ADLs refer to capacities required for personal care, including walking, dressing, bathing, using the toilet, transferring from the bed to a chair,
grooming, and eating. Instrumental ADLs such as shopping, housework, transportation, using the telephone, managing finances, and managing medications, are necessary for living independently in the community (Brie, Chang, Ahalt, Chen, Conant, Landefeld, Ritchie, Yukawa, 2014). ADLs are used to measure a person’s level of independence (Perkin Eastman, 2013).
16 age from relative independence (e.g., needing or wanting only meal preparation, housekeeping, and staff that can respond to emergencies) to a stage at which the resident needed help with ADLs and IADLs, and managing medications and used a wheelchair to get around on the same community campus (Hawes, Phillips, Rose, Holan, Sherman, 2003).
Alzheimer’s Disease - A neurological disease which is marked by the development of dense deposits of neurotic plaques around the nerve cells in the brain, as well as twisted strands of fiber called neurofibrillary tangles within the nerve cells. This degeneration of brain cells produces a progressive, irreversible decline in memory (especially in the ability to store new memories), the performance of routine tasks, time and space orientation, language and communication skills, abstract thinking, and the ability to learn and carry out mathematical calculations. other
symptoms include personality changes and impaired judgment. Alzheimer’s is the most common cause of dementia among older people. It is incurable, although numerous treatments have been used with varying success (Perkin Eastman, 2013).
Assisted LivingResidences (ALR) - The term assisted living residences (ALR) in North Carolina includes adult care homes (ACH) and multi-unit assisted housing with services (MAHS) facilities ACHs are licensed and MAHS register with the state. ALRs provides group housing with at least one meal per day and housekeeping services and provide personal care services directly or through a formal written agreement with a licensed home care or hospice agency. The department may allow nursing service exceptions on a case-by-case basis (NC Division of Health Service Regulation, 2015).
Built Environment -The buildings, roads, utilities, homes, fixtures, parks and all other man-made entities that form the physical characteristics of a community (WHO, 2004).
17 Chronic Disease - A disease which has one or more of the following characteristics: is
permanent; leaves residual disability; is caused by nonreversible pathological alternation; requires special training of the patient for rehabilitation; or may be expected to require a long period of supervision, observation or care (WHO, 2004).
Cognitive Impairment - Damage or loss of intellectual or mental functioning. This can include impairment of short- or long-term memory; orientation as to person, place, or time; and
deductive or abstract reasoning skills. Alzheimer’s disease if the most common cause of cognitive impairment in older adults (Perkin Eastman, 2013).
Community - A specific group of people, often living in a defined geographical area, who share a common culture, values and norms, are arranged in a social structure according to relationships which the community has developed over a period of time. Members of a community gain their personal and social identity by sharing common beliefs, values and norms which have been developed by the community in the past and may be modified in the future. They exhibit some awareness of their identity as a group, and share common needs and a commitment to meeting them (WHO, 1998).
Dementia - An organic mental disorder characterized by a decline in cognitive functioning severe enough to interfere with a person’s normal daily activities and social relationships. It includes loss of memory, impaired judgment and abstract thinking, and changes in personality (Perkin Eastman, 2013).
Elderly / Seniors/ Senior Adults -as used in this research paper, elderly / seniors/ senior adults mean (1) any person who has attained the age of 55 years or older and requires assistance with activities of daily living, housing, and services, or (2) any adult who has a primary diagnosis of Alzheimer’s disease or other form of dementia by a licensed Alzheimer’s and dementia care unit (NC Division of Health Service Regulation, 2005).
18 Frail Elderly/ Older Person - An older person in need of a substantial level of care and support (WHO, 2004).
Feasibility Study/ Analysis - An analysis of a project’s financial, market and/ or operational likelihood of success (Perkin Eastman, 2013).
Hierarchy - is the arrangement of spaces and forms to give importance or significance to things in an architectural composition. This requires establishing a compositional rule that is than broken to give a visible signal that something special has occurred; an anomaly in a normative pattern. The rule can be broken by spaces or forms that have different a size, shape or placement relative to the established rule.
Mental/ Mentally Impairment - A disorder characterized by the display of an intellectual defect, as manifested by diminished cognitive, interpersonal, social and vocational effectiveness and quantitatively evaluated by psychological examination and assessment (WHO, 2004).
Needs - This term has both a precise and an all but indefinable meaning in the context of public health. Needs are spoken of in precise numerical terms when referring to specific indicators of disease or premature death that require intervention because their level is above that generally accepted in the society or community in question. It must be explicitly stated that “needs” always reflect prevailing value judgements as well as the existing ability to control a particular public health problem (WHO, 2004).
Resident - A person living in an assisted living residence for the purpose of obtaining access to housing and services provided or made available by housing management (NC Division of Health Service Regulation, 2005).
19 Special-care Unit (SCU) - A long-term care facility with environmental features and/or
programs designed for people with dementia; these units may also provide care for persons with head injuries or serious illnesses. In this research study, SCU stands for a unit within a senior housing facility specially designed to meet the needs of residents suffering from Alzheimer’s disease or other dementias (Perkin Eastman, 2013).
Physical Therapy - therapy designed to restore or improve movement and strength in people whose mobility has been impaired by injury or disease. It can include exercise, massage, water therapy, and assistive devices (Perkin Eastman, 2013).
Programming - The architect and sponsor define the goals, needs, and functions of the project; design expectations; available budget; pertinent building codes; and zoning regulations. The architect prepares a written statement setting forth design objectives, constraint, and criteria for a project, including special requirements and systems as well as site requirements (Perkin
Eastman, 2013).
Quality of Life - The product of the interplay between social, health, economic and
environmental conditions which affect human and social development. It is a broad-ranging concept, incorporating a person’s physical health, psychological state, level of independence, social relationships, personal beliefs and relationship to salient features in the environment. As people age, their quality of life is largely determined by their ability to access needed resources and maintain autonomy and independence (WHO, 2004).
20 CHAPTER 2. STUDY 1 - PLANNING FOR THE FUTURE: PROPOSED MODEL FOR MARKET ANALYSIS AND SCOPE ESIMATION IN ASSISTED LIVING FACILITIES
1. Introduction
Nursing home (NH) used to be the most popular long-term care setting in the U.S. for older populations who were chronically ill and had difficulty functioning in daily activities because of their physical and cognitive disabilities (American Health Care Association, 2001; Hawes, 2001; Sahyoun, Pratt, Lentzner, Dey & Roinson, 2001; Zimmerman et al., 2003). However, in the recent three decades, assisted living (AL) has rapidly emerged as a long-term care alternative to the nursing homes. From 1999 to 2002, the number of AL facility beds in the U.S. increased from 519,905 to 1,026,397 beds, an almost one hundred percent increase (Harrington, et. al.,
2005). Now 32 states and the District of Columbia have an “AL” licensing category or statute
(Golant, 2004). Previous studies have attributed declining nursing home utilization to changing demographics among the elderly (Lakdawalla & Philipson, 2002) and to the growth of home and community-based care (Bishop, 1999). A general population survey found that people would prefer an AL facility to a nursing home, by a margin of six to one (Brodie & Blendon, 2001). In addition, state governments charged with planning long-term care alternatives have looked favorably on the AL facility alternative, because they view it as a more affordable long-term care solution for impaired low-income seniors, which can slow their Medicaid nursing home
expenditures (National Governors’ Association, 2000; Polvka, 1997).
21 2. Problem Statement
From a public policy perspective, the development of the AL industry has occurred largely without the influence of government policies on market projection and financing. In addition, previous efforts to assess AL market data have primarily been at the state level (Mollica,
Sims-Kastelein & O’Keefe, 2008; Mollica, Johnson-Lamarche & O’Keefe, 2005). These studies have identified much variation in AL supply across states. However, very few studies have examined potential within-state (county level) variations or correlations between AL market demand and socioeconomic characteristics beyond demographic factors, such as population and age.
For example, in North Carolina, where the AL inventory included 42,981 licensed beds in 100 counties in the fall of 2016, the principal determinant adopted by the state Health Services Regulation Division for assessing AL market demand in a county is the age of the population - the higher the age, the higher the use (DHSR, 2016). Specifically, a bed-to-population ratio is established for each age group. For instance, for age group between 65 and 74, a
bed-to-population of 5.53 beds per 1000 bed-to-population is adopted for all 100 counties in the state. For age group between 75 and 84, the ratio is 19.22 (DHSR, 2016). By multiplying these adopted
age-specific ratios by each county’s corresponding projected age-specific population (in thousands)
and adding all the products, the county’s future bed demand is projected. The demand is then subtracted from the inventory (supply). The result is the county’s surplus or deficit. Certificates
of Need (CONs) are justified in the counties with deficit.
However, a study by Stevenson and Grabowski (2009) has concluded that counties with higher AL penetration tend to relate to a greater socioeconomic level, which suggests that additional factors besides age and population be considered in determining the projected market size and appropriate regulations. As they concluded, counties with higher AL penetration tend to have greater educational attainment, higher median household income and median home values, lower proportion of minorities, and within more urbanized areas. Although this study does not quantify the impact of these factors by statistical models, it implies that the projected AL market cannot be accurately assessed only based on age and population. This implication can also be
22 State. For example, in Graham County, the number of current licensed beds as of 2017 is 23 and the projected number in three years is 47. However, the actual occupancy rate of the current beds in 2017 is only 35% (DHSR, 2016).
Moreover, these previous studies used “property” or “facility” as their data collection unit rather than using number of “beds”. This is important because AL facilities may differ greatly by their
bed counts (Golant, 2004). For example, a larger facility of 80 beds is having the same statistical
‘‘weight’’ as a smaller facility of 40 beds. Therefore, the present study aims to apply county-level bed capacities and occupied bed counts instead of using the total number of facilities as a whole.
3. Research Goal and Objectives
The goal of this study is to promote the success of the AL businesses, which largely rely on private recourses, by informing the policymakers (e.g. North Carolina Department of Health and Human Services) and private developers to better assess the market demand and react
accordingly. With the outcomes of this study, policymakers will be in a better proposition to understand the factors resulting in the disproportionate distribution of the AL facilities across the counties and to address these issues by public policies (e.g. public financing, access to service and care, etc.) to minimize the disparity.
Specifically, the Research Objectives are:
1) Objective 1: Assess the impacts of socioeconomic factors (e.g. urbanization level, education level, median household income, etc.), access to services (e.g. health care) and health
outcomes (e.g. length and quality of life) on AL market demand (bed-to-population ratio); and establish a statistical model to quantify the effects of the above factors to better predict the market demand. The hypothesis is AL facilities are located disproportionately in more urbanized areas with higher social-economic status and higher level of access to services. 2) Objective 2: Develop a relation between number of beds and the total AL project scope in
23 4. Research Methodology
4.1. Research Design
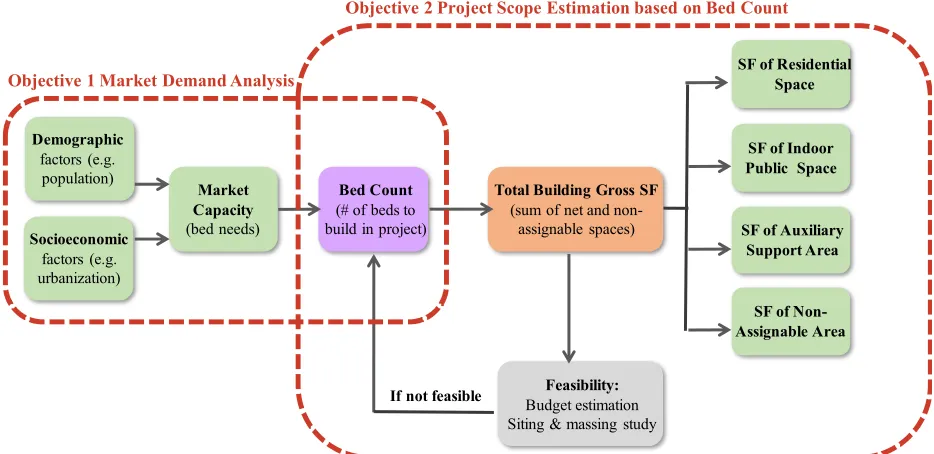
As shown in Figure 2.1, this study will include two phases. Phase 1 aims to quantify the dependent and independent variables to analyze the future market demand as well as develop a statistical model to better quantify the correlational factors (Objective 1). Phase 2 intends to estimate the new AL project scope in square footage based on the projected bed counts (Objective 2).
Figure 2.1 Research Conceptual Framework.
4.2. Research Method, Data Collection and Results 4.2.1. Phase 1 - Market Demand Analysis (Objective 1)
No national source of longitudinal data on the supply of AL facilities is currently available (Grabowski, Stevenson & Cornell, 2012). AL facilities are typically regulated at the state level. Applicable data sources of AL, such as state licensure registries, are available across different states. According to NC Division of Health Service Regulation, AL facilities are licensed as
“Adult Care Homes (ACHs)”. The North Carolina Department of Health and Human Services
provided the necessary data for the year of 2006, including ACHs name, location, county-level bed capacity, county-level annual occupancy rate, total number of residents etc. Since some of the occupancy rate data are missing (there are no licensed beds in adult care facilities in eight
Socioeconomic
factors (e.g. urbanization)
Demographic
factors (e.g. population)
Market Capacity
(bed needs)
Bed Count
(# of beds to build in project)
SF of Residential Space
SF of Indoor Public Space Total Building Gross SF
(sum of net and non-assignable spaces)
Feasibility:
Budget estimation Siting & massing study
If not feasible
SF of Non-Assignable Area
SF of Auxiliary Support Area Objective 1 Market Demand Analysis
24 counties, including Alleghany county, Graham county, Hyde county, Jones county, Tyrrell county, Swain county, Perquimans county, and Pamlico county), the following county-level data are collected for each of the 92 (out of 100) counties in North Carolina:
Variables and Data Sources: Dependent Variables
• North Carolina Department of Health and Human Services provided the AL facilities
data(6 variables), including Number of Occupied Beds and Occupancy Rate etc. The data was summarized on July 31, 2015 from 2016 license renewal applications. In North Carolina, AL facilities are licensed as “Adult Care Homes (ACHs)”.
Independent Variables
• Demographic data, such as population for selected age groups, gender, and race etc., were collected from North Carolina Office of State Budget and Management.
• Urbanization data, including Rural Population Percent and Urban Population Percent, were obtained from U.S. Census Bureau, Population Division.
• Socioeconomic and health data, including educational attainment, income, health outcomes (Length of Life and Quality of Life etc.) and health factors (Access to Exercise Opportunities, Number of Primary Care Physicians etc.), were adopted from the County Health Rankings & Roadmaps program, which is a collaboration between the Robert Wood Johnson Foundation and the University of Wisconsin Population Health Institute.
Multiple Linear Regression andStatistical Approaches:
The dataset has numerous explanatory variables and all of its variables are continuous.
25 not too highly correlated; and 4) the residuals are homoscedastic and approximately rectangular-shaped. MLR can be used to identify the strength of the effect that the independent variables have on a dependent variable and to forecast effects or impacts of changes. This aligns with the purpose of this study, which aims to identify the strength of the effect that the independent variables (e.g. population, urbanization, etc.) have on a dependent variable (e.g. occupied bed count) and to predict the effects of the independent variable changes on the dependent variable in the future.
Jianli Lu and Chunmiao Feng, graduate students of the NCSU Statistics Department, assisted in the statistical analysis under the guidance of their faculty advisors Dr. Dennis Boos and Dr. Emily Griffith. This effort also served as the final project required in their ST 542 course and a final report was prepared in fulfillment of the course. The following procedures and results are provided in this report.
Multicollinearity among Predictors
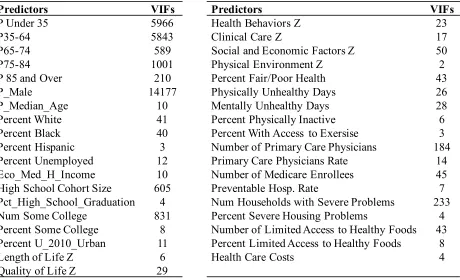
26 Table 2.1 Predictors in the Full Model and Their Variance Inflation Factors (VIFs).
Plotting of pairwise correlations among the predictor and response variables partially visualize the relationship between the response and predictors and the multicollinearity among the predictor variables (Figure 2.2).
Table 2.1 Predictors in the Full Model and Their Variance Inflation Factors (VIFs).
Predictors VIFs Predictors VIFs
P Under 35 5966 Health Behaviors Z 23
P35-64 5843 Clinical Care Z 17
P65-74 589 Social and Economic Factors Z 50
P75-84 1001 Physical Environment Z 2
P 85 and Over 210 Percent Fair/Poor Health 43
P_Male 14177 Physically Unhealthy Days 26
P_Median_Age 10 Mentally Unhealthy Days 28
Percent White 41 Percent Physically Inactive 6
Percent Black 40 Percent With Access to Exersise 3
Percent Hispanic 3 Number of Primary Care Physicians 184
Percent Unemployed 12 Primary Care Physicians Rate 14
Eco_Med_H_Income 10 Number of Medicare Enrollees 45
High School Cohort Size 605 Preventable Hosp. Rate 7
Pct_High_School_Graduation 4 Num Households with Severe Problems 233
Num Some College 831 Percent Severe Housing Problems 4
Percent Some College 8 Number of Limited Access to Healthy Foods 43 Percent U_2010_Urban 11 Percent Limited Access to Healthy Foods 8
Length of Life Z 6 Health Care Costs 4
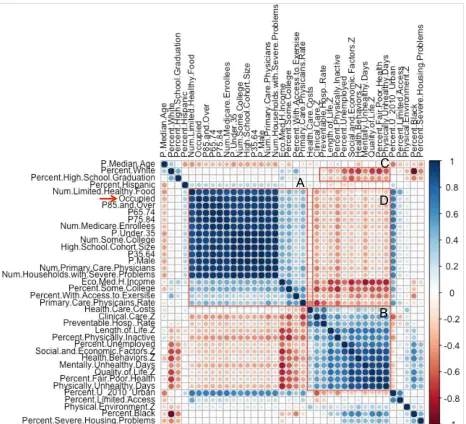
27 Figure 2.2 Correlations between Response Variable (Occupied) and Predictor Variables.
Blue to Red indicates high positive correlation to high negative correlation. Correlation matrix is ordered according to hierarchical clustering order. There are high positive correlations between Occupied (red arrow) and predictor variables related to age-specific populations (e.g. P85 an Over), educational levels (e.g. Number of Some College and Number of high school cohort size), Medicare level (e.g. Number of primary care physicians) and health-related factors (e.g.
28 For correlations among predictor variables, there are two positive correlation clusters: Box A, age-specific populations, Number of Some College, Number of High School Cohort Size and Number of Primary Care Physicians etc.; Box B, among five Z-scores, Percent physically inactive, Mentally/Physically Unhealthy days etc. There are two negative clusters: Box C, between Percent White and Percent physically inactive, Mentally/Physically Unhealthy days and Z-scores etc; Box D, between median household income and five Z-scores, Percent physically inactive, Mentally/Physically Unhealthy days, as well as between Percent of Some College and five Z-scores, Percent physically inactive, Mentally/Physically Unhealthy days.
To reduce the severe multicollinearity among the predictors, explanatory variables representing counts of specific groups of population are converted to ratios to the total population. The VIFs among the remaining predictor variables become considerably lower after the aforementioned conversions (Table 2.2).
Corresponding to the conversions with the predictors, the response variable Number of Occupied Beds is converted to Number of Occupied Beds per quota through dividing it by the total
population. Eventually, a data frame of 92 observations and 33 variables is used for the final model selection.
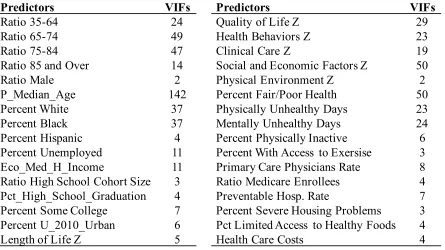
Table 2.2 Predictors in the Full Model after Ratio Conversion and Their Variance Inflation Factors.
Predictors VIFs Predictors VIFs
Ratio 35-64 24 Quality of Life Z 29
Ratio 65-74 49 Health Behaviors Z 23
Ratio 75-84 47 Clinical Care Z 19
Ratio 85 and Over 14 Social and Economic Factors Z 50
Ratio Male 2 Physical Environment Z 2
P_Median_Age 142 Percent Fair/Poor Health 50
Percent White 37 Physically Unhealthy Days 23
Percent Black 37 Mentally Unhealthy Days 24
Percent Hispanic 4 Percent Physically Inactive 6
Percent Unemployed 11 Percent With Access to Exersise 3
Eco_Med_H_Income 11 Primary Care Physicians Rate 8
Ratio High School Cohort Size 3 Ratio Medicare Enrollees 4
Pct_High_School_Graduation 4 Preventable Hosp. Rate 7
Percent Some College 7 Percent Severe Housing Problems 3
Percent U_2010_Urban 6 Pct Limited Access to Healthy Foods 4