An Experimental Study on Seismic Damage Indicator Considering CAV Concept
Lee, Jong-Rim l) and Lee, Sang-Hoon 2)
1) Civil/Architectural Eng. Group, Korea Electric Power Research Institute, KEPCO 2) Power Engineering Research Institute, Korea Power Engineering Co., Inc.
ABSTRACT
The nuclear power plant (NPP) should be shut down for inspection and tests prior to a return to power if the earthquake exceeds the operating basis earthquake (OBE). The OBE at the plant is considered to have been exceeded if the computed cumulative absolute velocity (CAV) from the earthquake record is greater than 0.16g-sec. However, the CAV criterion should be determined considering the seismic and structural characteristics of the plant. An experimental study using shaking table is conducted in this study to evaluate intensity of CAV criterion. Appropriate level of CAV is evaluated based on the test results using the developed seismic damage indicator (SDI) model. The model consists of stacked acrylic cylinders and is developed to behave consistently for each directional seismic load. The result of this study indicates that the CAV criterion of 0.16g.sec is conservative enough to be applied to Korean NPPs since the CAV value of the seismic input motion of the Korean standard NPPs ranges from 0.3 to 0.5 g-sec. The developed SDI is expected to be useful not only in easily determining OBE exceedance but also in evaluating earthquake damage quantitatively to provide guidelines for better post-shutdown inspection and test.
INTRODUCTION
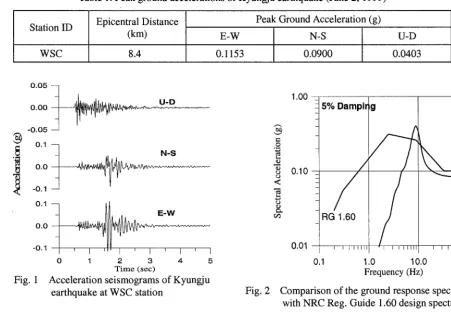
Since several earthquake observatory stations have been constructed at outskirts of the NPP in June 2, 1999, an earthquake event (See Table 1) was measured at WSC station located at one of electric substation, which exceeded OBE of 0.1g-sec at 10Hz (See Fig.1 and Fig. 2). However, no damage has been found in the facility. Generally, following an earthquake exceeding OBE, operator performs the first assessment of the plant's condition immediately, and shut down the plant. A return to power is possible after plant shows that no potential damage resulted from the earthquake[ 1]. In Korean peninsula, it is highly probable that small, such a nondamaging earthquakes, which have low energy with high frequency components, may occur often in the future. Similar situations happened in the U.S., and the plants should have shut down, and shown that no significant damage resulted to the plant through extensive analyses. Therefore, to avoid unnecessary plant shutdown due to small nondamaging earthquakes, it is required to set up an analytical criterion for determining when an OBE is exceeded. EPRI defined the OBE exceedance as the one causing potential damage to the well-designed structure as well as the exceedance of OBE design spectrum and concluded that CAV is the best single parameter for determining the damage threshold of earthquakes[2].
BACKGROUND OF CAV
The original CAV is defined as equation (1). This parameter is the area under the absolute acceleration and is primarily sensitive to potentially damaging low-frequency motions, but less sensitive to high-frequency motions which are nondamaging.
SMiRT 16, Washington DC, August 2001 Paper # 1776
Table 1. Peak ground accelerations of Kyungju earthquake (June 2, 1999)
Station ID Epicentral Distance (km)
Peak Ground Acceleration (g)
E-W N-S U-D
WSC 8.4 0.1153 0.0900 0.0403
i
0.05 1
0.00
-0.05
0.1 q
0.0 t
-0.1
0.1
0.0
-0.1
0
Fig. 1
U - D
N - S
E - W
' I
1
2
3
4
5
T i m e ( s e c )
Acceleration seismograms of Kyungju
earthquake at WSC station Fig. 2
e~o v
I= .o
i-q
o o
<
to tD
1.00
5% Dampir g
0.10 _
RG 1.60
0.01 , , l,,l,i
0.1 1.0 1 0 . 0
Frequency (Hz)
Comparison of the ground response spectrum with NRC Reg. Guide 1.60 design spectrum
I I I
100.0
r£ °x
C A V -
la(t)]dt
(1)where, a(t) = acceleration time history, t max = duration of record
The CAV was originally defined as equation (1). However, the calculation of CAV over the entire length of the time history can produce values that are significantly affected by low nondamaging acceleration(typically less than 0.025g). Then, CAV defined in equation (1) is revised to incrementally calculate CAV in one second intervals as follows[3]. .
ti
C A V T o a . A L - C A V i +
j']a(t)]dt
t i - i
(2)
where, a(t) = acceleration value in a one-second interval where at least one value exceeds 0.025g, and i = 1, n with n equal to the record length in seconds.
Using equation (2) CAV can be applied for determination of OBE exceedance criteria, and the procedure is illustrated as follows[4].
1) Response Spectrum Check
and 2 Hz. 2) CAV Check
The CAV check is exceeded if any CAV calculated according to equation (2) is greater than 0.16g-second The CAV value to the earthquake ground motion of the Fig. 1 indicates 0.04g-sec as shown in Fig. 3. Therefore, the earthquake motion did not exceed the OBE since the calculated CAV value is smaller than the criteria.
SEISMIC DAMAGE INDICATOR
Although EPRI has set up the CAV value of 0.16g-sec as
¢3
e~
> < r,.)
Fig. 3 0.06
0.04
0.02
0.00 I
0.00 0,01
\ E-W
N-S
U-D
' 1 ' I
0.02 0.03 0.04 0.05
Minimum Acceleration (g)
CAV for Kyungju earthquake at WSC station
the applicable level for NPP structures, CAV value may be affected by some factors, such as the seismological condition of the plant site and structural condition of the plant[5]. To check OBE exceedance for felt earthquakes, it is necessary in advance to acquire and analyze the earthquake using seismic instruments. Mostly, seismic monitoring system of the NPP is the only way that the operator can get a signal indicating seismic information for an earthquake. If a supplementary model responding at a critical earthquake level is available in the NPP, it will be helpful for operator to evaluate the earthquake damage easily. In the event that no damage is found in the safety-related equipment and structures during
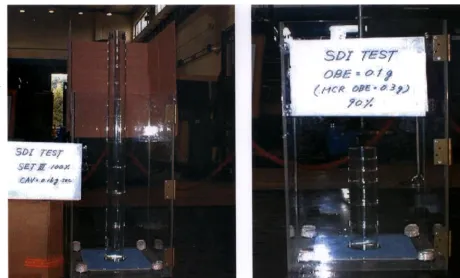
Transparency
Protection Case I~ D ~l
the focused post-shutdown inspections, but damage is found in the nonsafety-related earthquake damage indicators, then the following course of action is recommended by EPRI. That
Fig. 4 The developed model of Seismic Damage Indicator (SDI)
is, if the level of observed damage based on the post-
shutdown inspections corresponds to intensity 0 based on the EPRI damage scale for NPPs, then additional inspections of safety-related equipment and structures are not considered to be warranted. EPRI recommend several SDI such as switchyard equipment, suspended ceilings, unanchored cabinet and storage racks etc. for focused inspection.
Table 2. Requirements for the SDI test model
Item
H/D
Total Height
Material
Base plate
Spec. 0.5, 1.0, 1.5, 2.0
Acrylic
Acrylic
Comment Diameter (D) = 10 cm
Height (H) = 5, 10, 15, 20 cm
It needs the adequate height to respond to the design earthquake, but it was intended that the total height of SDI shall not higher than the one of operator Corrosion resistant, availability to reuse, the adequate unit weight for considering inertia force of earthquake, durability
Solidly made to support weight of SDI and fixed to shaking table (desirable weight is two times larger than that of SDI)
INPUT EXCITATION
Since it is so difficult to use the real earthquake ground motions satisfying this experimental condition, some artificial time histories were generated[5]. An artificial time history can be constructed on the basis that any periodic function can be expanded into a series of sinusoidal functions as equation (3).
n
2 ( 0
- ~ Aisin(0~ i t + (~i) i=l(3)
A i is the amplitude and ~i is the phase angle of the i times contributing sinusoid.
In order to modify artificial time history consistent with the required design response spectrum using equation (3), response error calculated at the given control frequency point as equation (4) is added sequentially to the artificial time history.
~'R max ((_oi, ~k ) -- fo n~ O~(r)hik
(tn~
- z ' ) d r (4)tmi is the time at which the maximum spectral response occurs, hik (t) is the unit impulse response function to the damping ~k and the frequency coi, and can be defined as equation (5).
1
h ( t ) -
- ~
exp(-coi~kt ) sin
(.Odit
(5)(-Odi
o.2o -~I
Fo.8o
g
8 0.00 0.40 ~
O
-0.20 0.00
0.00 5.00 10.00 15,00 20.00 25.00
Time(sec)
(a) North-South direction
0.20 0.80
. _
¥
o 0.00 0.40
o v
O
-0.20 0.00
0.00 5.00 10.00 15.00 20.00 25.00
T i m e ( s e c )
(b) East-West direction
o.2o -~
Fo.4o
a
d 0.00 0.20
O
-0.20 0.00
0,00 5.00 10,00 15.00 20.00 25.00
Time(sec)
(b) Vertical direction
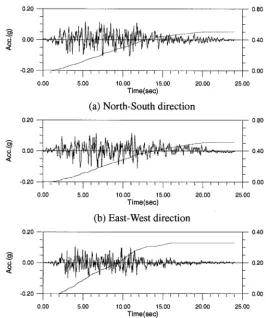
Fig. 5 CAV plots of seismic input motion for Korean standard NPP
0.40 j
o 0.00
(.)
-0.40
0.00 4.00 8.00 12.00 16.00 20,00
Time(sec) (a) NS direction
0.40
"--r'.
o 0.00
o <
-0.40
0,00 4.00 8.00 12,00 16.00 20.00
Time(sec) (b) EW direction
0.40
o 0.00 o . <
-0.40
0.00 4,00 8,00 12,00 16.00
Time(sec)
(c) VT direction
Fig.6 Input excitation corresponding to type A
20.00
The generated acceleration time
history and its response spectrum of 5%
damping for input excitation of type A
are plotted in Fig. 6 and Fig. 8
respectively. The duration of the time
history generated is 20 seconds, and
time increment is set up as 0.005
seconds. The maximum peak ground
acceleration for each component
reached 0.179g, 0.165g, and 0.120g.
The acceleration time history generated
and its response spectrum of 5%
damping for input excitation of type B
are shown in Fig. 7 and Fig 9
respectively. The duration of the time
history generated is 24 seconds, and
time increment are the same as type A.
The maximum peak ground
acceleration for each component
reached 0.316g, 0.329g, and 0.229g.
0.40
O.OO
- 0 . 4 0
O.OO 5.00 1 O.OO 15.00 20.00 25.00
Time(sec) (a) NS direction
0 . 4 0
0 . 0 0
- 0 . 4 0 ,.-., ,,..::
8
. <
I
0.00 5.00 10.00 15.00 20.00 25.00
Tirne(sec) (b) EW direction
0.40
o 0.00 o . <
-0.40
0.00 4,00 8,00 12.00 16,00 20,00
Time(sec) (c) VT direction
Fig.7 Input excitation corresponding to type B
1 O 0 - -
_
_
_
0.10 - -
_ _ _ _ _ 0.01 0.01
Artificial Seismic Input
... OBE Level
MCR Design Level
( - - - ~
c/_, / ' \
F " " . ~
y . / . - "
/ " .,."
f - / . , " / " ,,,,'"
' ' ' ' ' ' " I ' ' ' ' ' ' " I ' ' ' ' ' ' " I
0.10 1.00 10.00
F r e q u e n c y ( H z )
(a) NS direction
Fig. 8 1.00 - -
_
_
_
_
0.10 - -
_ _ _ _ _ 0.Ol 0.01
10.00 : _ _ _ _ _ 1.0o --~
_
Artificial Seismic Input
... OBE Level
MCR Design Level / - - ' ~
/ \
/, \ ,
. . - / \ / . ' 1 - " ~ . __. / - ,..- ... - - - . /~" /."
I3;" . . .
/..3/ ...
. / ' /
/
' ' ' ' ' '"1 ' ' ' ' ' '"1 ' ' ' ' ' ' " 1
O. 10 1.00 10.00
F r e q u e n c y ( H z )
(b) EW direction
0.10 --~
_
_ _
0.01 - : _ _ _ _ _ _ 0.00 0.01
I Artificial Seismic Input 1
... OBE Level
MCR Design Level
,-- - _~ / " ',,_. . / - ' \
/ " ,.-2..: .
/ . / . . . . . . _ .
5;3 ...
/ / ~ / /
' ' ' ' ' ' " 1 ' ' ' ' ' ' " 1 ' ' ' ' ' ' " 1 ' ' ' ' ' ' "
O. 10 1.00 10.00 100.00
F r e q u e n c y ( H z )
(c) VT direction
Comparison of response spectrum of type A motion (OBE Level: design ground response spectrum, MCR Design Level: floor response spectrum at MCR floor)
10.00 _ _ _ _ _ _ _ _ 1.oo
8 -
~ -
m ~ -
. 6 -
m
O3 0 . 1 0 - - _ _ _ _ _
0.01 - -
0.01
10.00 _ _
_ _ _ _ _ _ 1.oo - :
~ -
~ -
~ -
m
~ 0 . 1 0 - -
_ _ _ _
0.01 -
0.01
10.00 -
_ _
1.00 - = _ _ _ C:~
-~ O.lO -
~ =
~ -
m -
0 3 -
0.01 --= _ _ _ _ _ _ _ 0.00 0.01
Fig. 9
I Artificial S e i s m i c Input 1
. . . ~ t L;ov~lgn Level m _ ~
/ / ,,'
/
~ i i I~lf I ~ ~ ~ l~l I i ' ' " '"i
O. I 0 1 . 0 0 I 0 . 0 0 F r e q u e n c y ( H z )
(a) NS direction
i i i l
100.00
Artificial Seismic Input | /
°ac~';v 2'
/
/ , , "
/
' ' ''""I ' ' ''""I ' ' ''""I
0.10 1.00 10.00
F r e q u e n c y ( H z )
(b) EW direction
00.00
I . . .
Artificial S e s m i c Input |
i
O B E Level / M C R De "
/ /
I I I Illi I I I I I IIII I I I I I IIII I I I I I IIII
0.I0 1.00 I0.00 I00.00
F r e q u e n c y ( H z )
(c) VT direction
Fig. 10 The optimum combination for type A Fig. 11 The optimum combination for type B
TEST RESULTS
Fig. 10 and Fig. 11 show the SDI test models installed at 6-DOF shaking table of Korea Institute of Machinery & Materials. The shaking table can simulate 3 directional input motion simultaneously for the test. Two sets of SDI test model are prepared for the test.
First, the input excitation corresponding to type A is applied to the test models, and the overturning of the model is checked with stacked height. The amplitude of input motion is also increased step by step changing the stacked height of the models. Through the iterative experiments, the test model shows no collapse at 90% level of excitation and all collapse at 100% level of excitation all the time. And, the adequate height and optimum combination of block is also selected for the input excitation corresponding to type B.
The test result indicates that the selected optimum combination for type A consists of 20cm x2 + 15cm x2 + 10cm x 3 + 5cm x4 (The total height is 120cm from the bottom) as shown in Fig. 10. For type B, the combination consists of 10cm x3 + 5cm x3 (The total height is 45cm from the bottom) as shown in Fig. 11.
CONCLUSIONS
of the Korean standard NPPs ranges from 0.3 to 0.5 g-sec. By applying CAV criterion it is expected to avoid unnecessary plant shutdown due to small, nondamaging earthquake. The SDI models developed in this study are expected to be useful not only in easily determining OBE exceedance and but also in evaluating earthquake damage quantitatively for providing guidelines for better post-shutdown inspection and test..
REFERENCES
1. EPRI NP-6695, Guidelines for Nuclear Plant Response to an Earthquake, Palo Alto, California: Electric Power Research Institute, prepared by MPR Associates, Inc., December 1989.
2. EPRI NP-5930, A Criterion for Determining Exceedance of the Operating Basis Earthquake, Palo Alto, California: Electric Power Research Institute, prepared by Jack R. Benjamin and Associates, Inc., July 1988.
3. EPRI TR-100082, Standardization of the Cumulative Absolute Velocity, Palo Alto, California: Electric Power Research Institute, prepared by Yankee Atomic Electric Company, December 1991.
4. Technical Report, Development of Post-Earthquake Guidelines and Evaluation Methodology for Nuclear Power Plant,
Korea Electric Power Research Institute, 1999.
5. Technical Report, An Enhanced Approach to Generate Artificial Earthquake Time History for Multiple-Damping Design
Response Spectra, Korea Power Engineering Co. Inc., 1996.