Volume 2008, Article ID 547684,8pages doi:10.1155/2008/547684
Research Article
Application of Artificial Immune System Approach in
MRI Classification
Chuin-Mu Wang,1Chio-Tan Kuo,1Chi-Yuan Lin,1and Gia-Hao Chang2
1Department of Computer Science and Information Engineering, National Chin-Yi University of Technology, 41111 Taichung, Taiwan
2Institute of Information and Electrical Energy, National Chin-Yi University of Technology, 41111 Taichung, Taiwan
Correspondence should be addressed to Chuin-Mu Wang,[email protected]
Received 30 November 2007; Revised 3 March 2008; Accepted 16 April 2008
Recommended by P.-C. Chung
Numerous scholars have submitted the theory and research of artificial immune systems (AISs) in recent years. Although AIS has been used in various fields, applying the AIS to medical images is very rare. The purpose of this study is using the clonal selection algorithm (CSA) of artificial immune systems for classifying the brain MRI, and displaying a single organism image which can finally offer faster organism reference information to a doctor; hence reducing the time to ascertain large number of images, so that the doctor can diagnose the nidus more efficiently and accurately. In order to verify the feasibility and efficiency of this method, we adopt statistical theory for manifold assessment and compare with the perceptron network of double layers, FCM method. The result proves that the method of this study is both feasible and useful.
Copyright © 2008 Chuin-Mu Wang et al. This is an open access article distributed under the Creative Commons Attribution License, which permits unrestricted use, distribution, and reproduction in any medium, provided the original work is properly cited.
1. INTRODUCTION
The treatment of diseases is on the basis of diagnosis. Only according to a lot of pathologies and the doctor’s erudition which accumulated over a long time to determine the focus could diseases be treated. But many pathological changes are unobservable by the human eye. X-ray is a very important noninvasive medical instrument for diagnosis. From X-rays, the doctor can learn the status of internal organs without operating. But X-rays carry the dangers of radiation, so it is unsuitable to be used in observing patients for extended periods. Magnetic resonance imaging (MRI) was later developed and has made great progress in medical imaging. Given its high resolution, noninvasive nature, and having no need to use the developer under the normal situation, MRI has become the new favorite of the modern image modality. With better and better MRI instrument technology, it is becoming more and more popular in the medical field. From the detection of cardiovascular disease to tumors, MRI is being implemented. The medical circle even thinks MRI has the potential to gradually replace the present invasive examination method.
MRI has the characteristic of a great amount of image information and high sensitivity which may cause noise and artifacts. Therefore, at present, the most common way of tissue classifying is transferring it to professional medical personnel to judge, or judge by algorithm, such as artificial neural networks [1–3], Fuzzy C-Means, K-Means [4–6]. Many relevant methods have been proposed in recent years. Artificial immune systems (AISs) [7] have been researched and discussed by many scholars in recent years. We can see AIS applied in different fields, for instance: data analysis [8], and TSP problems [9]. Because AIS has these characteristics: uniqueness, self/nonself discrimination, learning, and mem-ory, it is very appropriate for the pattern recognition field. In this paper, we propose a suitable method of MRI brain image classification and use statistical theory to assess its accuracy of classification.
The following article is divided into six sections:
Section 2will introduce the concept of the natural immune
using CSA to classify the brain MRI tissue.Section 5shows experimental results. The final section is the conclusion.
2. THE NATURAL IMMUNE SYSTEM
The immune system has guaranteed the health of the human body. Through identifying self and nonself mechanisms, the immune system can get rid of foreign matter (antigens) to perform this basic defense.
Generally speaking, the immune system can be divided into the adaptive immune system and innate immune sys-tem, the greatest difference being the adaptive immune sys-tem has a function of memory, whereas the innate immune system does not. The memory function of the adaptive immune system is identifying specific invaders. If the system cannot find the pathogen immediately or take precautions, the pathogen may propagate and result in the host’s death.
The immune system has two main functions: (a) identifying invaders and (b) effectively dispelling outside pathogens or materials harmful to the host organism or cell. The structure and function of the immune system are very complicated, with many phenomena still left unexplained explicitly. So we will make some simple exposition about the terminology and concepts that are often involved in immunology in the following few paragraphs.
2.1. The concepts of the immune system
2.1.1. Antigens (Ag)
In the immune system, all foreign bodies are called anti-gens—molecules which will cause an immune response. When the antigen is found, antibodies will be produced by the immune system, and cell proliferation causes the immune response to resist the invaders. In organ transplants or blood transfusions, repulsion is a frequent problem because also human’s cell membrane contains the antigen molecule. Because people’s antigen molecules differ, when another person’s organs or blood are transplanted to another human body, it often causes an immune response.
2.1.2. Immune responses
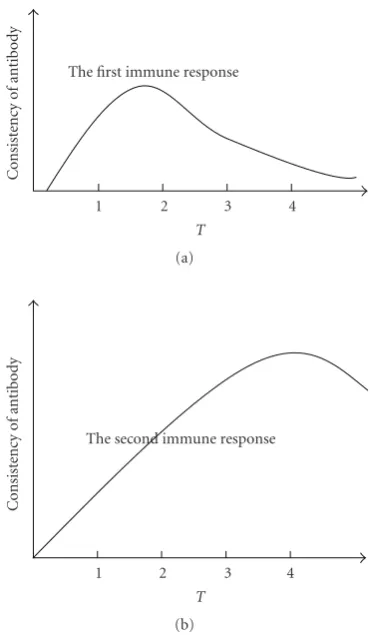
Generally, the immune response can be divided into pri-mary and secondary immune responses. The first immune response means the immune system first finds the antigen. The second immune response means the immune system acts against the antigen that has already been identified (see
Figure 1).
When the unknown antigen invades the body and is perceived by the immune system, through a series of mutation and clone selection, it will produce an antibody that has a close affinity to the antigen, so that it can eliminate the antigen rapidly. In other words, the immune systems can “remember” every kind of pathogen and if the same infection takes place again, the immune system will be able to deal with and react to it more efficiently.
C
o
nsist
ency
o
f
antibod
y
The first immune response
1 2 3 4
T
(a)
C
o
nsist
ency
o
f
antibod
y
The second immune response
1 2 3 4
T
(b)
Figure1: Immune response curve.
2.1.3. Antibodies (Ab)
The antibody is a kind of protein complex produced from plasma cells when the immune system is under the stimulus of the antigen material. The antibody is made up of four polypeptides. It contains two light chains and two heavy chains. This protein complex has the characteristics of identifying and restraining the invading substance. The immune system can create special antibodies matched to specific antigens. The binding site of the antibody and antigen is the notch between thelight chain and theheavy chain, called theantigenicdeterminate.
2.1.4. Affinity
Through the combination of the immune cell and antibody, it can make the lymphocyte recognize the antigen. The coordination of the immune cell’s receptor and antigen is the way to defend against the antigen. The intensity of this combination is calledaffinity.
2.1.5. B Cells
T cell
Helper T Excite
B cell B cell
Antibody
Progenitor cell Suppressor T
Suppress
Figure2: Relation of immune cell.
were less than a certain level, the B cells will no longer proliferate or differentiate.
2.1.6. T Cells
The T cell plays an important role in the immune response. It is differentiated in the thymus. The major function is ensuring that other cells operate normally and attack the pathogen directly. After a T cell is ripe, it will move to the lymphoid tissue. As regards to the regulating function, T cells can be divided into a Helper T cells and suppressor T cells. The function of the former is to excite B cells, achieving the purpose of a warning transmission. The latter is used to suppress B cells from proliferating because an over-abundance of B-cell duplication may cause overimmunity.
Figure 2illustrates the relationships between the cells and the
behavior of how they help and suppress the activation of B cells.
3. ARTIFICIAL IMMUNE SYSTEM
Originally, the Immune network theory was developed by Jerne in 1973. In 1986, Farmer brought up the artificial immune system model [10] that sparked a lot of theoretical research about the artificial immune network system and its relevant applications. In the theoretical research, most emphasis is put on the immunity algorithms, network model, and so forth. The applications are wide enough to involve data mining, trouble diagnostics, network security, pattern recognition, and adaptive control. A lot of papers about its application had been issued at the beginning of 1990. This study focuses on the use of the CSA of the immune system in MRI Classification.
Clonal selection algorithm (CSA)
De Castro and Von zuben developed the clonal selection algorithm [11] on the basis of the clonal selection theory.
A
ffi
nit
y A
A
B B C
C
Position that the antigen combines
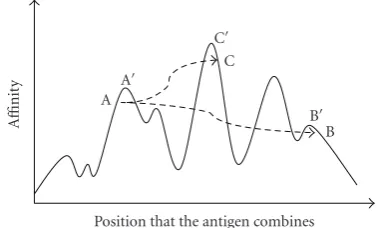
Figure3: Schematic representation of receptor editing.
The basic concept follows biological evolution theory, with “survival of the fittest” as its foundation. The immune system has the phenomenon of evolution. Burnet proposed the clonal selection theory in 1959: as the system is excited by an antigen, it will cause antibodies to increase to certain levels and combine with the antigen. Briefly, after the pathogen has invaded the body, it will start to proliferate, and destroy the internal cells. In order to maintain the balance of physiological function, one of the ways the immune system fights against the pathogen is to proliferate the immune cells, then recognize and eliminate the pathogen.
The diversity of clonal selection algorithm is one of the topics often discussed by researchers. George and Gray et al. presented a clear answer in discussion of 1999, and proposed that CSA has the ability to prevent the local convergent. Figure 3illustrates this idea by considering all possible antigen-binding sites depicted in thex-axis, with the most similar ones adjacent to each other. The Ag-Ab affinity is shown on the y-axis. In CSA mathematical calculation processes, the antibody (A) is selected during a primary response; the mutations allow the immune system to explore the antibodies with higher affinity in the local areas around the antigen and keep the antibody with higher affinity. This phenomenon may cause local convergence (A). However the explored antibody was calculated by its affinity and sifted again and again—this will stop it from changing to lower affinity. The result of sifting will only be better and better, and the global optimum solution will finally be found. This famous characteristic is named receptor editing.
The CSA can be described as follows.
(i) Available P repertoire that can be decomposed into several different subsets. Let M represent the set of memory cells and let Pr represent the set of remaining,P=Pr+ M.
(ii) According to the affinity, select n of the highest affinity elementsPn.
(iii) Clone then-selected elements, generating new clone set C and higher antigenic affinity, the higher the number of clones generated for each of thenselected.
(v) Select these mutated individuals from new antibody set C∗ and add them to the population M. The mutated individuals in set C∗ will instead be some individuals inP.
(vi) Use the new antibody to replace the older antibody of Dto fit with various. Antibodies with low affinity can easily be replaced.
4. CSA IN CLASSIFICATION OF BRAIN TISSUE
This experiment classifies the background and tissue such as gray matter (GM), white matter (WM), and cerebral spinal fluid (CSF) in an MRI. This chapter will introduce our CSA experiment procedure and method in MRI. This experiment procedure is shown inFigure 6. The experiment procedure can be described as follows.
4.1. Determine AIS configuration
This experiment is based on described clonal selection algo-rithm (CSA) to do the MRI classification.
4.2. Determine the initial antibody population
This experiment adopts 9 initial antibody populations—the number of initial antibody population should not be too large or small. If the quantity of antibodies is too small, it will cause the comparative sample to find the optimum solution with greater difficulty.
If the quantity of antibodies is too great, it will consume calculation time. This experiment adopts a method that can get adaptive numbers asFigure 4shows.
While selecting the antibody, we can expand the two-dimensional tissue in the X andY directions by two pixel units. This will form a 5∗5 neighborhood data matrix. We can consider this 5∗5 matrix as the source of the 9 antibody population sets.
After all antibodies of the spectrum tissue are selected, it must save the antibodies in a memory buffer for follow-up processing.
4.3. Calculate the initial affinity
The affinity of antibodies and antigens is a calculation of similarity. It can be represented by spatial distance. For the calculation of distance, we adopt the Euclidean distance formula. The affinity of the antibody can be expressed as
R=
z
p=1
minD1p,D2p,D3p,. . .,Dcp
. (1)
Dis the distances between the antigens (input data) and each population’s center (antibody). Using the Euclidean equation to calculate, whereZis the total number of pixels in the image,Pis the reading sequence number of the input data (pixel), and C is the quantity of antibodies in the antibody set.
224 250 228 176 230 191 221 219 254 249 254 211 208 254 240 225 194 207 210 196 220 201 191 221 229
208 Target
Figure4: Sketch of antibody population selected.
224 250 228 176 230 191 221 219 254 249 254 211 208 254 240 225 194 207 210 196 220 201 191 221 229
224 250 228 191 221 219 254 211 208 250 228 176 221 219 254 211 208 254 228 176 230 219 254 249 208 254 240
. . . 208 254 240 207 210 196 191 221 229 Ab 1
Ab 2
Ab 3
Ab 9
Figure5: Initializing of the antibody population.
4.4. Selection and differentiation
After initially calculating the affinity, then according to the affinity to screen. The screening samples of this experiment are 5, meaning that only the highest five antibody sets will be kept. The other 4 sets of antibodies will be knocked out and wait for the next selection and screening. After the screening is finished. It will assign the clone’s number according to the affinity as shown in
Nc= n
k=1
round
β•N
k
. (2)
is congenital, it is relatively easy to be eliminated or hard to survive.
4.5. Muturate
Muturate is equivalent to the mutation in genetic algorithms. It is a very important step in the artificial immune system. This step will promote some individuals’ affinity. It is an important procedure in solving for the local optimum solution. The principle of muturate is: the higher affinity, the lower muturate rate. The muturate method of this experiment is using randomize normal distribution for mat-uration. The principle of randomized normal distribution is as follows.
In order to present normal distribution, two parameters must be obeyed. These two parameters determine the range and position of distribution: expected valueμand standard deviationσ2. Expected valueμdetermines the center position
of distribution, and standard deviation σ2 determines the
range of distribution. Generally, it is presented in the shape of a bell, so we often call this figure the bell curve. The expected valueμof the normal distribution is always 0, and the standard deviationσ2is always 1. The distribution can be
written as (3). The probability density function (PDF) can be written as (4).
X∼Nμ,σ2, (3)
f(X)= 1 σ√2πe
−(X−μ)2/2σ2
. (4)
The reason we consider using randomized normal distribution is because the distribution of images’ gray level intensity is continuous. If using general random, it is unable to find the optimum solution that correlates with images’ characteristics. If we add a set of randomized normal distribution in individual muturate, it can gradually get rid of the optimum situation.
4.6. Calculate affinity again
After the muturate is finished, we should calculate affinity again immediately. Observing each group for any indi-vidual’s affinity being superior to the best individual in the previous generation, if the affinity is superior to the previous generation’s, sift this individual and place it in the memory cell zone. If this group has not produced a better individual, it means that during the muturate there is no better distribution location in the individual, no action to do.
4.7. Keep diversity
During recalculation of affinity, we can find the superior individual. We just need to replace the original individual with the new one that can achieve the goal of keeping the better individual. The individual with lower affinity during initial affinity calculation is not knocked out forever, but some mechanisms are used to investigate individuals again, such as produce at random, until the second time
Determine the initial antibody group
(tissue)
Replace the bad antibody
Nice antibody of C∗
Memory area of group of antibody
Calculate the affinity
Reselection
Selection
Calculate again Nice antibody
C∗
Muturate
Clone (C)
Differentiation
Figure6: Experiment flow chart.
calculation of affinity. If up to high-standard affinity, it has an opportunity to participate in the competition which guarantees the diversity of the antibodies.
5. EXPERIM ENTAL RESULTS
5.1. Brain simulation images
(a) (b)
(c) (d)
(e)
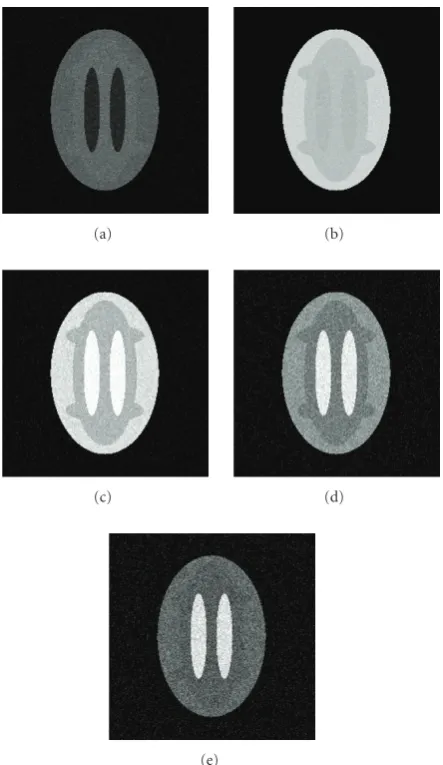
Figure7: Simulated brain MRIs with 5 dB noise: (a) Sequence 1; (b) Sequence 2; (c) Sequence 3; (d) Sequence 4; and (e) Sequence 5.
necessary to add Gaussian noise in the simulated brain MRIs. Simulated brain MRIs with 5 dB Gaussian noise are shown in
Figure 7.
5.2. Assessment method
This experiment assessment method uses statistical theory analytic to assess the classification results. First of all, we must get the classification result of the brain MRIs, and represent them in two-dimensional data form. Take this experiment for example; the tissue includes the background having four kinds of results (GM, WM, CSF, BKG). Then let d = 4. RD(d) and RF(d) are the detection rate and false alarm rate of classification, respectively.
Represented as in (5), N is the total number of single image; N(d) is the total number of pixels specified by the object signature;ND(d) is the total number of pixels that are specified by the object signature and actually detected by the
Table1: Assessment results of AIS-CSA (10 dB)
N ND(d) NF(d) RD(d) RF(d) RD RF BKG 44469 44469 0 1 0
0.99910 0.000139 GM 9040 8988 7 0.99425 0.00012
WM 8745 8738 52 0.9992 0.00091 CSF 3282 3282 0 1 0
classifier;NF(d) is the total number of false alarm pixels that are not specified by the object signature:
RD(d)=N D(d) N(d),
RF(d)= NF(d)
N−N(d).
(5)
In addition, it has to have a set of perfect known results for assessing. This means that the result of the experiment with the condition RD(d) is 100% and RF(d) is 0, for the comparison and statistics. Though RD(d) , RF(d) can already calculate the correct rates and false rates of each tissue, in order to get the total accuracy of algorithms, it must consider the proportion of each tissue in the image, so we can get the total correct rate and total false rate from (6) and (7). Among them, (8) calculates the proportion to all tissues (including background information):
RD= p
d=1
RD(d)p(d), (6)
RF= p
d=1
RF(d)p(d), (7)
p(d)= pN(d) d=1N(d)
. (8)
5.3. Experimental results
The experimental results are divided into two parts for discussion. First, we examine use of the simulate brain MRIs for classifying statistical theory assessing. Second, we explore use of the real brain MRIs for classifying. Here we use some well-known algorithms for the experiment’s purpose of comparison and assessment, such as FCM and perceptron network of double layers.Figure 8is the classification results under the environment with 10 dB Gaussian noise.Figure 9 is the classification results under the environment with 5 dB Gaussian noise.
(a) (b)
(c)
Figure8: Classification results of AIS-CSA of simulated image with 10 dB noise: (a) GM; (b) WM; and (c) CSF.
(a) (b)
(c)
Figure9: Classification results of AIS-CSA of simulated image with 5 dB noise: (a) GM; (b) WM; and (c) CSF.
R1/TE1 = 2500 milliseconds/20 milliseconds, TR2/TE2 = 1500 milliseconds/55 milliseconds, TR3/TE3 = 2500 mil-liseconds/75 milliseconds, TR4/TE4=2500 milliseconds/100 milliseconds, TR5/TE5=500 milliseconds/20 milliseconds. The data classification results by CSA are shown inFigure 11. Whether the classification result is good or not still needs to
(a) (b)
(c) (d)
(e)
Figure 10: Actual brain MRIs: (a) TR1/TE1 = 2500 ms/20 ms; (b) TR2/TE2=1500 ms/55 ms; (c) TR3/TE3=2500 ms/75 ms; (d) TR4/TE4=2500 ms/100 ms; and (e) TR5/TE5=500 ms/20 ms.
Table2: Assessment results of AIS-CSA (5 dB)
N ND(d) NF(d) RD(d) RF(d) RD RF BKG 44469 44469 0 1 0
0.98735 0.00197 GM 9040 8454 243 0.93517 0.0043
WM 8745 8502 586 0.97221 0.01031 CSF 3282 3282 0 1 0
Table3: Assessment results of perceptron network (10 dB)
N ND(d) NF(d) RD(d) RF(d) RD RF BKG 44469 44469 0 1 0
0.99487 0.00081 GM 9040 8950 246 0.99004 0.0043
WM 8745 8499 90 0.97187 0.0016 CSF 3282 3282 0 1 0
(a) (b)
(c)
Figure11: Classification results of CSA in actual brain MRIs: (a) GM; (b) WM; and (c) CSF.
Table4: Assessment results of perceptron network (5 dB)
N ND(d) NF(d) RD(d) RF(d) RD RF BKG 44469 43088 509 0.96894 0.02416
0.96273 0.02092 GM 9040 8611 130 0.95254 0.0023
WM 8745 8114 1785 0.92784 0.03143 CSF 3282 3281 18 0.9997 0.00028
Table5: Assessment results of FCM (10 dB)
N ND(d) NF(d) RD(d) RF(d) RD RF BKG 44469 44469 0 1 0
0.99949 0.00008 GM 9040 9017 10 0.99746 0.00017
WM 8745 8735 23 0.99886 0.0004 CSF 3282 3282 0 1 0
Table6: Assessment results of FCM (5 dB)
N ND(d) NF(d) RD(d) RF(d) RD RF BKG 44469 44469 0 1 0
0.98167 0.00288 GM 9040 8420 581 0.93142 0.01028
WM 8745 8166 620 0.93379 0.01092 CSF 3282 3280 0 0.99939 0
6. CONCLUSION
This study mainly researches the classification of spectral image of the brain with CSA of the artificial immune system. The main purpose is to propose a new method of classification and improve the classifying efficiency of the tradition algorithm at present. According to the experiment’s
procedures and results of the previous chapters, the conclu-sions are as shown below.
(i) The CSA of the artificial immune system can be applied to the spectral images of medical science. Even though the artificial immune system is used in various fields, spectral image classification of me-dical science is really rare. After verification by the experiment of the last chapter, CSA of the artificial immune system can really be applied in the image classifying field.
(ii) According to the experimental data, CSA is superior to clustering algorithms which are compared in this study.
REFERENCES
[1] J. Alirezaie, M. E. Jernigan, and C. Nahmias, “Automatic segmentation of cerebral MR images using artificial neural networks,”IEEE Transactions on Nuclear Science, vol. 45, no. 4, pp. 2174–2182, 1998.
[2] W. E. Reddick, J. O. Glass, E. N. Cook, T. D. Elkin, and R. J. Deaton, “Automated segmentation and classification of multispectral magnetic resonance images of brain using artificial neural networks,” IEEE Transactions on Medical Imaging, vol. 16, no. 6, pp. 911–918, 1997.
[3] M. T. Hagan, H. B. Demuth, and M. H. Beale, “Theory and examples,” inNeural Network Design, pp. 14–16, PWS, Boston, Mass, USA, 1995.
[4] M.-S. Yang, Y.-J. Hu, K. C.-R. Lin, and C. C.-L. Lin, “Segmentation techniques for tissue differentiation in MRI of ophthalmology using fuzzy clustering algorithms,”Magnetic Resonance Imaging, vol. 20, no. 2, pp. 173–179, 2002. [5] K.-L. Wu and M.-S. Yang, “Alternative c-means clustering
algorithms,”Pattern Recognition, vol. 35, no. 10, pp. 2267– 2278, 2002.
[6] C.-M. Wang, C. C.-C. Chen, Y.-N. Chung, et al., “Detection of spectral signatures in multispectral MR images for classifica-tion,”IEEE Transactions on Medical Imaging, vol. 22, no. 1, pp. 50–61, 2003.
[7] L. N. De Castro and J. Timmis,Artificial Immune Systems: A New Computational Intelligence Approach, Springer, London, UK, 2002.
[8] J. Timmis, M. Neal, and J. Hunt, “Artificial immune systems for data analysis,” Biosystem, vol. 55, no. 1–3, pp. 143–150, 2000.
[9] J. S. Luo, L. H. Lei, F. Liu, and L. Zhang, “Application in the function of artificial immunity algorithm,” Journal of Xi’an Jiaotong University, vol. 37, no. 8, 2003.
[10] J. D. Farmer and N. H. Packard, “The immune-system, adaptation, and machine learning,”Physica, vol. 22, no. 1, pp. 187–204, 1986.