IJEDR1503106
International Journal of Engineering Development and Research (www.ijedr.org)1
Outlier Detection on Incremental Data set Using
Cell-Based approach in Data Mining
1 Dhaval R. Chandarana, 2 Maulik V. Dhamecha 1 Student, 2
Assistance Professor
1 Computer Engineering, 1 R K. University, Rajkot-360020, India
________________________________________________________________________________________________________
Abstract - Exception identification on indeterminate static information is a testing examination issue in information mining. Additionally, the consistent entry of information makes it all the more difficult. Thus, in this paper, the issue of exception identification on Incremental information streams is concentrated on. Specifically, we propose a nonstop separation construct exception location approach with respect to an arrangement of questionable objects' expresses that are started synchronously from a gathering of information sources. An arrangement of objects' states at a timestamp is known as a state situated. For the most part, the span between two successive timestamps is short and the condition of the considerable number of articles may not change much in this term. In this manner, we propose an incremental methodology of exception location, which makes utilization of the outcomes acquired from the past state set to productively recognize exceptions in the current state set. What's more, a surmised incremental anomaly recognition methodology is proposed to further diminish the expense of incremental exception detection. Finally, the correlation diagram of static v/s Incremental information sets is found in last period of paper.
Index Terms - outlier detection; Incremental data, Static data.
________________________________________________________________________________________________________
I. INTRODUCTION
Exception recognition is a major issue in information mining .It has applications in numerous spaces including charge card misrepresentation recognition, system interruption identification, and environment checking, restorative sciences, and so on. A few meanings of exception have been given in past, yet there exists no generally concurred definition. Hawkins [1] characterized an exception as a perception that goes astray such a great amount from different perceptions as to stir suspicion that it was created by an alternate component.
Cricket is an extremely prominent amusement in the subcontinent. One Day Internationals (ODI)is a form of cricket that is finished in one day, as particular from Test cricket which can take up to five days to finish. Batting, playing and handling are the three primary components of cricket; contingent upon the player's level of commitment in these exercises they are distinguished as a batsman or a bowler or an all-adjusting player. However in cricket there is no resolute principle to relegate a player into one of the above classifications. Essentially it depends on the investigator's perspective subsequently we can consider it as a subjective estimation.
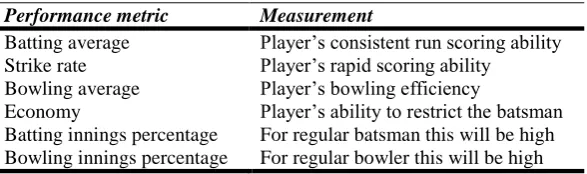
Table I portrays a percentage of the execution measurements that are utilized as a part of the grouping calculation and anomaly discovery process. These measurements are identified with the individual player exhibitions. For match winning player discovery, group's normal execution measurements like group's batting normal, run rate, rocking the bowling alley normal, contradicting group's run rate and so on are moreover considered.
This paper shows the use of unsupervised machine learning systems on cricket players' vocation Incremental dataset to locate the normal gathering of players and to distinguish extraordinary and match winning players.
TABLE I. INDIVIDUAL PLAYER PERFORMANCE METRICS Performance metric Measurement
Batting average Player’s consistent run scoring ability Strike rate Player’s rapid scoring ability
Bowling average Player’s bowling efficiency
Economy Player’s ability to restrict the batsman Batting innings percentage For regular batsman this will be high Bowling innings percentage For regular bowler this will be high
IJEDR1503106
International Journal of Engineering Development and Research (www.ijedr.org)2
Squad choice choices and honor selection are some imperative procedures which require much give a second thought and top to bottom examination. Universal Cricket Council (ICC) and related bodies every year hold recompense service for cricketers – ICC typically positions the players utilizing a point based framework which essentially relies on upon the individual execution of the player However this point framework does not look into the amount of that player emerges from the others from measurable perspective.Accordingly in this study separate Cell-based models are created for batsmen, bowlers and all-adjusting players utilizing suitable info highlights for every model. At that point the anomalies of every model are recognized independently and positioned taking into account their likelihood. Proper area learning construct separating is connected with respect to the anomalies to verify that the sifted exceptions are actually remarkable players. It is found that the acquired results generally agree to some master produced rank rundown. As this framework viably measures how remarkable a player is, this could be utilized as a part of recompense designation process.
Amid the squad determination process, administration needs to distinguish the key players of their group and when a group arranges its strategy against its adversary group in a match it needs to recognize the key players of the adversary group. Accordingly recognizing remarkable match winning players (batsman, bowler) of every group would be exceptionally valuable data. For this sort anomaly identification transform, the contrast between player's execution measurements and group's normal execution measurements are utilized as information elements. A legitimate squad choice with the right blend of batsmen, bowlers and all-adjusting player will incredibly focus the achievement of the group.
II. PREVIOUS WORK
Group investigation is the association of a gathering of designs into groups in light of comparability [1], in this manner the bunching calculations are utilized as a part of a few applications like picture division, news gathering and item acknowledgment and so forth. Cell based bunching calculation is one of the few grouping procedures that minimize the inside of bunch whole of squares [2].
For some applications like distinguishing proof of framework issues, system inconsistency location and remarkable human conduct discovery and so forth. The disclosure of exceptions prompts more fascinating and valuable results than the disclosure of inliers. Thickness based exception identification routines appraise the thickness conveyance of the information space and afterward distinguish anomalies as those lying in locales of low thickness [5]. There are studies that have been performed on cricket dataset to foresee result of a cricket match utilizing neural systems [6] what's more, Bayesian classifiers [7]. However these studies did not examine the cricket players' profession measurements dataset, in this way in this paper Cell-construct methods are connected with respect to the players' vocation insights dataset to concentrate some valuable data. The past work is not capable locate the ideal result when information sets is Incremental. They applies K-mean calculation for getting consequence of just current static information sets. So in Data mining the most confounded undertaking is to getting Result based on Current as well as previous information sets. This paper is characterizing deal with Incremental information sets which are real need of current Data mining methodology. The calculation is utilized as a part of this paper is work on Incremental information sets and its additionally effective contrast with past calculation.
III. METHODOLOGY
The dataset utilized for this task is gathered from ESPN Cricinfo site [9]. For Cell-based grouping and extraordinary batsmen, bowlers and all-adjusting players identification I have utilized vocation insights of every player, for example, batting normal, strike rate, rocking the bowling alley normal, economy and so on. For the match winning player location I have utilized player's insights and group's total measurements in the won matches in which the player likewise played.
I have connected Cell-construct grouping calculation in light of players 'profession insights dataset to gathering them into three groups. This calculation does not require any supervision to locate the regular bunching in the info information. Naturally the calculation tries to bunch players as the ones who have reasonable measure of commitment with bat just or with ball just or with both and Assignment-Update calculation with irregular restarts as depicted beneath.
Input:
player dataset = {player(1), player(2), … player(i), … , player(m)} where player(i) = (batting average, strike rate, bowling
average, economy, batting innings percentage, bowling innings percentage)
Algorithm:
for j = 1 to several random initializations
IJEDR1503106
International Journal of Engineering Development and Research (www.ijedr.org)3
centroid(3)}loop until cost function stop decreasing:
If (First condition) {
Stored in cluster: 1; }
If (Second condition) {
Stored in cluster: 2; }
If (Third condition) {
Stored in cluster: 3; }
cluster: 2=men(batting_avg); cluster: 3= men(bowlling_avg);
for each player(i):
If (Fourth condition) {
Stored in cluster: 4; }
If (Fifth condition) {
Stored in cluster: 5; }
Information components are standardized preceding grouping in request to remunerate the scale varieties in the data information. After standardization more weight is given to batting innings rate and rocking the bowling alley innings rate highlights – this would help in overcoming outstanding events like one who is not a normal bowler who bowled in not very many matches having great playing figures (and, the other way around for one who is not a normal batsman).
Subsequent to grouping the groups are named naturally taking into account the normal batting innings rate and normal rocking the bowling alley innings rate for all Cell-based groups as takes after,,
Cluster:-1 with both average batting innings percentage and bowling innings percentage greater than 70% is named as all-rounding cluster.
Cluster:-2 with only average batting innings percentage greater than 70% are named as batting cluster.
Cluster:-3 with only average bowling innings percentage greater than 70% is named as bowling cluster.
Cluster:-4 Filtering for Outstanding batsman for this cluster
batting average > mean(batting average) – lower limit
strike rate > mean(strike rate) – lower limit constant for strike rate Cluster:-5 Filtering for Outstanding bowler for this cluster
bowling average < mean(bowling average) + lower limit economy < mean(economy) + lower limit constant for economy
IJEDR1503106
International Journal of Engineering Development and Research (www.ijedr.org)4
At that point I have utilized the above grouped yield to create separate likelihood models for batsmen, bowlers and what not adjusting players utilizing suitable info highlights, keeping in mind the end goal to identify extraordinary batsmen, bowlers and all-adjusting players from the individual models. To build up a model for batsmen I have considered players from batting bunch and all-adjusting bunch, for bowlers I have considered players from knocking down some pins bunch and all-adjusting group, and for all adjusting players I have considered players just from all adjusting bunch. For the batsmen model I have utilized batting normal and strike rate as the information highlights, for the bowlers model I have utilized playing normal and economy, and for the every adjusting player demonstrate all these four measurements are utilized as data highlights.IV. CELL-BASED APPROACH
The cell-based methodology is gone for decreasing the number of exorbitant likelihood assessments. It maps a dataset items to a cell-network and recognize the cells containing just inliers or exceptions taking into account the limits on the #D-neighbors. This methodology will be used in seconds. V and VI for the proposed consistent anomaly location approaches.
Incremental Outlier Processing
Let SCj at timestamp tj signifies an arrangement of articles whose states change between timestamps tj−1 and tj. We call such objects SC-objects (state-change objects).Note that SCj ⊆ Sj .The fundamental thought of the incremental exception handling is to process just the articles which are either SC-protests or are influenced by the SC-objects. We will use the cell-based calculation talked about in Sec. IV to process just the SC-objects. The proposed incremental methodology focuses on all state sets but the introductory state set (S1). For the S1, no outcomes are accessible from the past state set, thus all the articles in the S1 should be prepared utilizing the cell-based methodology. To improve the issue, consider the case with one SC-object, operation. Let Cjx 1,x2 speaks to a cell Cx1,x2 at time tj . Subsequently of state change, operation ∈ G can move in one of the accompanying two.
[Case 1] op moved to a different cell:
op ∈ Cj−1x1,x2, op ∈ Cjx1,x2,Cj−1x1,x2≠ Cjx1,x2 .
[Case 2] op moved within a cell:
op ∈ Cj−1x1,x2, op ∈ Cjx1,x2,Cj−1x1,x2= Cjx1,x2
Review that in the cell-based methodology, for the calculation of cell limits on #D-neighbors, the cells inside locale RD+wσ are considered and for the upper bound, the cells outside the district RD+wσ are likewise considered. Henceforth, at the point when an item moves among cells (case 1) , it influences the cell limits of the considerable number of cells inside of locale RD+wσ of the Cj−1 x1,x2 furthermore, Cjx 1,x2 and the #D-neighbors of all the un-pruned items in the G. To be specific on the off chance that 1, operation influences cells Cj−1 x1,x2 , Cjx 1,x2 , their L1 and RD+wσ neighbors and all the items in unpruned cells in the G. This development does not influence the cell based pruned cells outside RD+wσ area, in light of the fact that the number of items outside the locale RD+wσ is not influenced by this development. Fig. 1 demonstrates the development of operation between Cj−1 x1,x2 and Cjx 1,x2 and their L1 and RD+w.
Then again, when an article moves inside of a cell (case 2) , it doesn't influence the limits of any framework cell, notwithstanding, this development influences the #D-neighbors of all the un-pruned questions in the G. Fig. 2 demonstrates the development of operation between Cj−1 x1,x2 and Cjx 1,x2 where Cj−1 x1,x2 = Cjx 1,x2. We call the phones influenced by the SC-items target cells. Target cells oblige re-exception discovery with the entry of new state.
Target Cells: In practice, there are more than one SCobjects between tj−1 to tj . Therefore, we expand the idea to more than one SC-objects. Hence, the target cells can be classified into following 3 types.
Type A: Cells containing SC-objects which have moved to or from another cell at time tj (Cj−1x1,x2 and Cjx1,x2 in Fig. 3). Type B: L1 and RD+wσ neighboring cells of Type A cells, except those classified as Type A.
Type C: Un-pruned cells of the grid G. Type C cells may include Type A and B cells.
Every one of the three cell sorts, i.e., A, B and C oblige re-exception location with the landing of new state set, while rest of the cells doesn’t should be prepared. Calculation is utilized for the preparing of target cells.
V. EXPERIMENTS
IJEDR1503106
International Journal of Engineering Development and Research (www.ijedr.org)5
figures, the incremental calculations utilizing the routine Gaussian and the limited Gaussian vulnerabilities are indicated by DM (CG) furthermore, DM (BG), separately. These two calculations are contrasted and the basic based strategy (CM). In the CM, the cell-based calculation of Sec. IV is executed for all the articles in the state set at each timestamp.A. Datasets
Vocation insights of 200 present cricketers who had played no less than 20 ODI matches is chosen as the data dataset. By applying Cell-construct bunching calculation with respect to this dataset; 22 players are doled out to the all-adjusting bunch, 53 players are appointed to the batting bunch, 100 players are allotted to the playing bunch, 53 players are relegated to the Outstanding Batsman group and 9 players are appointed to the Outstanding Bowler bunch. Via watchful investigation it has been found that the bunching appears to relate with some master bunched rundown like ICC ODI batsman, bowler and all rounder records.
At that point this bunched information is utilized to fit likelihood thickness models for batsmen, bowlers and all-adjusting players independently. At that point fittingly sifted exceptions from these models are positioned taking into account the likelihood allocated to them in these models. The extraordinary batsmen, bowlers and all rounding players list produced by the anomaly location process Appears absolutely with ICC ODI players rank rundown [10]. Cell-based models fitted for batsmen, bowlers, and match winning batsmen also, match winning bowlers are delineated in Figure 1. The separated extraordinary players of every class are portrayed by circles in the separate models. In the batsmen model, players who are situated higher along the strike rate hub are well known hitters, though players who are situated higher along the batting normal are more steady players.
The TABLE II presents the all-adjusting player rank rundown gotten from the anomaly discovery process – the majority of the players in this rank rundown are found in ICC main 10 all-adjusting players list.
B. Results
Analyses are directed to assess the productivity of the proposed calculations. Since there are no known calculations for Incremental-construct anomaly location in light of Incremental information streams, the straightforward cell-based strategy (CM) is utilized as gauge.
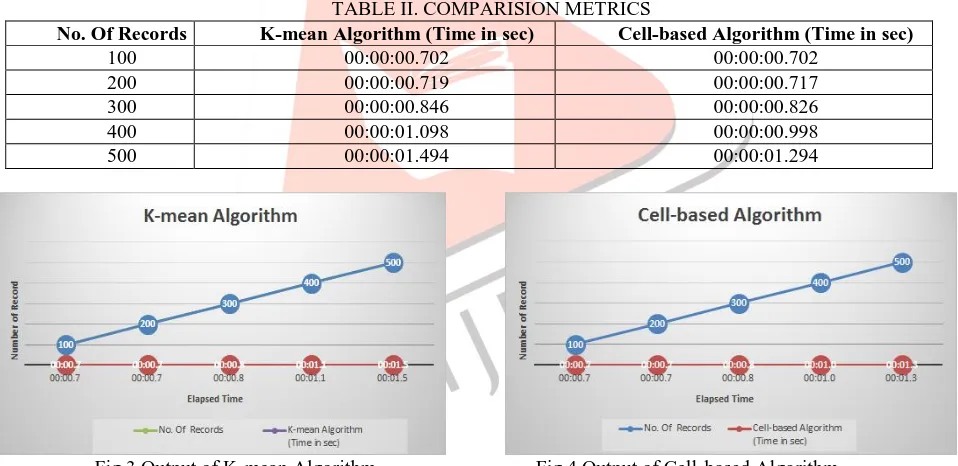
TABLE II. COMPARISION METRICS
No. Of Records K-mean Algorithm (Time in sec) Cell-based Algorithm (Time in sec)
100 00:00:00.702 00:00:00.702
200 00:00:00.719 00:00:00.717
300 00:00:00.846 00:00:00.826
400 00:00:01.098 00:00:00.998
500 00:00:01.494 00:00:01.294
Fig 3 Output of K-mean Algorithm. Fig 4 Output of Cell-based Algorithm.
Base on the accompanying correlation of diverse calculation I got the accompanying results. The fig 3 and fig 4 seen the genuine graphical representation of taking after change of cell-base calculation. Cell-construct calculation is work in light of Incremental information sets with all the more productively look at K-mean approach. Base on taking after result the Outlier location on proceeds with landing of information sets is taking less time and simple to get genuine result.
VI. CONCLUSION
In this study I have connected Cell-construct Outlier recognition approach with respect to cricket players' vocation measurements dataset to consequently assemble the players taking into account their level of commitment in batting and playing, and to distinguish the extraordinary players and predominant colleagues. It has been found that the outcomes got from this study appear to relate with some master produced rank records where they have utilized distinctive subjective way to deal with rank the players.
IJEDR1503106
International Journal of Engineering Development and Research (www.ijedr.org)6
calculation for the productive discovery of exceptions inside of a state set, in both the incremental calculations. Later on, we plan to develop this work for high-dimensional information and general instability model.VII. ACKNOWLEDGEMENT
I might want to thanks my examination guide Mr. Maulik Dhamecha for some examinations and for giving a rules to my examination work. The creators might want to express their profound appreciation to the mysterious analysts of this paper. Their helpful remarks have assumed a noteworthy part in enhancing the nature of this work.
REFERENCES
[1] D. Hawkins, “Identification of outliers,” ser. Monographs on Applied Probability and Statistics, 1980, pp. 1–12.
[2] B. Sharma, L. Golubchik, and R. Govindan, “Sensor faults: Detection methods and prevalence in real-world datasets,” ACM Trans. Sen. Netw., vol. 6, no. 3, pp. 23:1–23:39, 2010.
[3] S. A. Shaikh and H. Kitagawa, “Efficient distance-based outlier detection on uncertain datasets of gaussian distribution,” World Wide Web,pp. 1–28, 2013.
[4] E. M. Knorr, R. T. Ng, and V. Tucakov, “Distance-based outliers: Algorithms and applications,” VLDB J., vol. 8, no. 3-4, pp. 237–253, 2000.
[5] S. Ramaswamy, R. Rastogi, and K. Shim, “Efficient algorithms for mining outliers from large data set,” SIGMOD Rec., vol. 29, no. 2, 2000.
[6] F. Angiulli and C. Pizzuti, “Fast outlier detection in high dimensional spaces,” in Principles of Data Mining and Knowledge Discovery, 2002,pp. 15–27.
[7] M. Kontaki, A. Gounaris, A. Papadopoulos, K. Tsichlas, and Y. Manolopoulos, “Continuous monitoring of distance-based outliers over data streams,” in ICDE, 2011.
[8] K. Ishida and H. Kitagawa, “Detecting current outliers: Cont. outlier detect. Over time-series data streams,” in DEXA, 2008. [9] C. C. Aggarwal and P. S. Yu, “Outlier Detection with Uncertain Data,”in SDM, 2008.
[10] http://www.espncricinfo.com/